Posts tagged ‘NOAA’

Why Global Warming Does Not Necessarily Translate to Daily High Temperature Records

Most folks assume that global warming results in record high daily temperatures, but this is not necessarily the case.  When your local news station blames a high temperature record on global warming, they may be wrong for two reasons.

  1.  Most of the temperature stations used by your local news channels for weather are full of urban heat island biases.  This is particularly true of the airport temperature that many local news stations use as their official reading (though to be fair UHI has much more effect on evening temperatures than temperatures at the daily high).
  2.  Most global warming, at least in the US where we have some of the best records, does not occur during the day -- it occurs at night

The latter point is surprising to most folks, but as a result we are not seeing an unusual number of daily high temperature records set (many were set in the 1930s and still stand).  What we are seeing instead is a large number of record high low temperature readings.  This is confusing, but basically it means that the lowest temperature that is reached at nighttime is higher than it has been in the past.  The chart below is a bit dated but still holds:

When I give presentations I try to use examples from local data.  Here is the comparison of night time warming vs. day time warming in Amherst, MA.

I bring this all up again because Dr. Roy Spencer has done a similar analysis for the US from the relatively new AIRS database (a satellite-based data set that avoids some of the problems of land thermometer data sets like urban heat island biases and geographic coverage gaps).  He shows this same finding, that over 80% of the warming we have seen recently in the US is at night.

This is a bit over-complicated because it is looking at temperatures through different heights of the atmosphere when most of you only care about the surface.  But you can just look at the 0 height line to see the surface warming trend.  Note that in general the data is pretty consistent with the UAH lower-troposphere temperature (satellite) and the NOAA metric (ground thermometers).

No particular point except to highlight something that is poorly understood by most folks because the media never talks about it.


So Where Is The Climate Science Money Actually Going If Not To Temperature Measurement?

You are likely aware that the US, and many other countries, are spending billions and billions of dollars on climate research.  After drug development, it probably has become the single most lucrative academic sector.

Let me ask a question.  If you were concerned (as you should be) about lead in soil and drinking water and how it might or might not be getting into the bloodstream of children, what would you spend money on?  Sure, better treatments and new technologies for filtering and cleaning up lead.  But wouldn't the number one investment be in more and better measurement of environmental and human lead concentrations, and how they might be changing over time?

So I suppose if one were worried about the global rise in temperatures, one would look at better and more complete measurement of these temperatures.  Hah!  You would be wrong.

There are three main global temperature histories: the combined CRU-Hadley record (HADCRU), the NASA-GISS (GISTEMP) record, and the NOAA record. All three global averages depend on the same underlying land data archive, the Global Historical Climatology Network (GHCN). Because of this reliance on GHCN, its quality deficiencies will constrain the quality of all derived products.

The number of weather stations providing data to GHCN plunged in 1990 and again in 2005. The sample size has fallen by over 75% from its peak in the early 1970s, and is now smaller than at any time since 1919.

Well, perhaps they have focused on culling a large poor quality network into fewer, higher quality locations?  If they have been doing this, there is little or no record of that being the case.  To outsiders, it looks like stations just keep turning off.   And in fact, by certain metrics, the quality of the network is falling:

The collapse in sample size has increased the relative fraction of data coming from airports to about 50 percent (up from about 30 percent in the 1970s). It has also reduced the average latitude of source data and removed relatively more high-altitude monitoring sites.

Airports, located in the middle of urban centers by and large, are terrible temperature measurement points, subject to a variety of biases such as the urban heat island effect.  My son and I measured over 10 degrees Fahrenheit different between the Phoenix airport and the outlying countryside in an old school project.  Folks who compile the measurements claim that they have corrected for these biases, but many of us have reasons to doubt that (consider this example, where an obviously biased station was still showing in the corrected data as the #1 warming site in the country).  I understand why we have spent 30 years correcting screwed up biased stations because we need some stations with long histories and these are what we have (though many long lived stations have been allowed to expire), but why haven't we been building a new, better-sited network?

Ironically, there has been one major investment effort to improve temperature measurement, and that is through satellite measurements.  We now use satellites for official measures of cloud cover, sea ice extent, and sea level, but the global warming establishment has largely ignored satellite measurement of temperatures.  For example, James Hansen (Al Gore's mentor and often called the father of global warming) strongly defended 100+ year old surface temperature measurement technology over satellites.  Ironically, Hansen was head, for years, of NASA's Goddard Institute of Space Studies (GISS), so one wonders why he resisted space technology in this one particular area.  Cynics among us would argue that it is because satellites give the "wrong" answer, showing a slower warming rate than the heavily manually adjusted surface records.

Inability to Evaluate Risk in A Mature and Reasoned Fashion

A while back I wrote a long post on topics like climate change, vaccinations, and GMO foods where I discussed the systematic problems many in the political-media complex have in evaluating risks in a reasoned manner.

I didn't have any idea who the "Food Babe" was but from this article she sure seems to be yet another example.  If you want to see an absolute classic of food babe "thinking", check out this article on flying.   Seriously, I seldom insist you go read something but it is relatively short and you will find yourself laughing, I guarantee it.

Postscript:  I had someone tell me the other day that I was inconsistent.  I was on the side of science (being pro-vaccination) but against science (being pro-fossil fuel use).   I have heard this or something like it come up in the vaccination debate a number of times, so a few thoughts:

  1. The commenter is assuming their conclusion.  Most people don't actually look at the science, so saying you are for or against science is their way of saying you are right or wrong.
  2. The Luddites are indeed taking a consistent position here, and both "Food babe" and RFK Jr. represent that position -- they ascribe large, unproveable risks to mundane manmade items and totally discount the benefits of these items.  This includes vaccines, fossil fuels, GMO foods, cell phones, etc.
  3. I am actually with the science on global warming, it is just what the science says is not well-portrayed in the media.  The famous 97% of scientists actually agreed with two propositions:  That the world has warmed over the last century and that man has contributed to that warming.  The science is pretty clear on these propositions and I agree with them.  What I disagree with is that temperature sensitivity to a doubling of CO2 concentrations is catastrophic, on the order of 4 or 5C or higher, as many alarmist believe, driven by absurdly high assumptions of positive feedback in the climate system.   But the science is very much in dispute about these feedback assumptions and thus on the amount of warming we should expect in the future -- in fact the estimates in scientific papers and the IPCC keep declining each year heading steadily for my position of 1.5C.  Also, I dispute that things like recent hurricanes and the California drought can be tied to manmade CO2, and in fact the NOAA and many others have denied that these can be linked.  In being skeptical of all these crazy links to global warming (e.g. Obama claims global warming caused his daughter's asthma attack), I am totally with science.  Scientists are not linking these things, talking heads in the media are.

Adjusting the Temperature Records

I have been getting inquiries from folks asking me what I think about stories like this one, where Paul Homewood has been looking at the manual adjustments to raw temperature data and finding that the adjustments actually reverse the trends from cooling to warming.  Here is an example of the comparisons he did:

Raw, before adjustments;

puertoraw


After manual adjustments

puertoadj2


I actually wrote about this topic a few months back, and rather than rewrite the post I will excerpt it below:

I believe that there is both wheat and chaff in this claim [that manual temperature adjustments are exaggerating past warming], and I would like to try to separate the two as best I can.  I don't have time to write a well-organized article, so here is just a list of thoughts

  1. At some level it is surprising that this is suddenly news.  Skeptics have criticized the adjustments in the surface temperature database for years.
  2. There is certainly a signal to noise ratio issue here that mainstream climate scientists have always seemed insufficiently concerned about.  For example, the raw data for US temperatures is mostly flat, such that the manual adjustments to the temperature data set are about equal in magnitude to the total warming signal.  When the entire signal one is trying to measure is equal to the manual adjustments one is making to measurements, it probably makes sense to put a LOT of scrutiny on the adjustments.  (This is a post from 7 years ago discussing these adjustments.  Note that these adjustments are less than current ones in the data base as they have been increased, though I cannot find a similar chart any more from the NOAA discussing the adjustments)
  3. The NOAA HAS made adjustments to US temperature data over the last few years that has increased the apparent warming trend.  These changes in adjustments have not been well-explained.  In fact, they have not really be explained at all, and have only been detected by skeptics who happened to archive old NOAA charts and created comparisons like the one below.  Here is the before and after animation (pre-2000 NOAA US temperature history vs. post-2000).  History has been cooled and modern temperatures have been warmed from where they were being shown previously by the NOAA.  This does not mean the current version  is wrong, but since the entire US warming signal was effectively created by these changes, it is not unreasonable to act for a detailed reconciliation (particularly when those folks preparing the chart all believe that temperatures are going up, so would be predisposed to treating a flat temperature chart like the earlier version as wrong and in need of correction. 1998changesannotated
  4. However, manual adjustments are not, as some skeptics seem to argue, wrong or biased in all cases.  There are real reasons for manual adjustments to data -- for example, if GPS signal data was not adjusted for relativistic effects, the position data would quickly get out of whack.  In the case of temperature data:
    • Data is adjusted for shifts in the start/end time for a day of measurement away from local midnight (ie if you average 24 hours starting and stopping at noon).  This is called Time of Observation or TOBS.  When I first encountered this, I was just sure it had to be BS.  For a month of data, you are only shifting the data set by 12 hours or about 1/60 of the month.  Fortunately for my self-respect, before I embarrassed myself I created a spreadsheet to monte carlo some temperature data and play around with this issue.  I convinced myself the Time of Observation adjustment is valid in theory, though I have no way to validate its magnitude  (one of the problems with all of these adjustments is that NOAA and other data authorities do not release the source code or raw data to show how they come up with these adjustments).   I do think it is valid in science to question a finding, even without proof that it is wrong, when the authors of the finding refuse to share replication data.  Steven Goddard, by the way, believes time of observation adjustments are exaggerated and do not follow NOAA's own specification.
    • Stations move over time.  A simple example is if it is on the roof of a building and that building is demolished, it has to move somewhere else.  In an extreme example the station might move to a new altitude or a slightly different micro-climate.  There are adjustments in the data base for these sort of changes.  Skeptics have occasionally challenged these, but I have no reason to believe that the authors are not using best efforts to correct for these effects (though again the authors of these adjustments bring criticism on themselves for not sharing replication data).
    • The technology the station uses for measurement changes (e.g. thermometers to electronic devices, one type of electronic device to another, etc.)   These measurement technologies sometimes have known biases.  Correcting for such biases is perfectly reasonable  (though a frustrated skeptic could argue that the government is diligent in correcting for new cooling biases but seldom corrects for warming biases, such as in the switch from bucket to water intake measurement of sea surface temperatures).
    • Even if the temperature station does not move, the location can degrade.  The clearest example is a measurement point that once was in the country but has been engulfed by development  (here is one example -- this at one time was the USHCN measurement point with the most warming since 1900, but it was located in an open field in 1900 and ended up in an asphalt parking lot in the middle of Tucson.)   Since urban heat islands can add as much as 10 degrees F to nighttime temperatures, this can create a warming signal over time that is related to a particular location, and not the climate as a whole.  The effect is undeniable -- my son easily measured it in a science fair project.  The effect it has on temperature measurement is hotly debated between warmists and skeptics.  Al Gore originally argued that there was no bias because all measurement points were in parks, which led Anthony Watts to pursue the surface station project where every USHCN station was photographed and documented.  The net result was that most of the sites were pretty poor.  Whatever the case, there is almost no correction in the official measurement numbers for urban heat island effects, and in fact last time I looked at it the adjustment went the other way, implying urban heat islands have become less of an issue since 1930.  The folks who put together the indexes argue that they have smoothing algorithms that find and remove these biases.  Skeptics argue that they just smear the bias around over multiple stations.  The debate continues.
  5. Overall, many mainstream skeptics believe that actual surface warming in the US and the world has been about half what is shown in traditional indices, an amount that is then exaggerated by poorly crafted adjustments and uncorrected heat island effects.  But note that almost no skeptic I know believes that the Earth has not actually warmed over the last 100 years.  Further, warming since about 1980 is hard to deny because we have a second, independent way to measure global temperatures in satellites.  These devices may have their own issues, but they are not subject to urban heat biases or location biases and further actually measure most of the Earth's surface, rather than just individual points that are sometimes scores or hundreds of miles apart.  This independent method of measurement has shown undoubted warming since 1979, though not since the late 1990's.
  6. As is usual in such debates, I find words like "fabrication", "lies",  and "myth" to be less than helpful.  People can be totally wrong, and refuse to confront their biases, without being evil or nefarious.

To these I will add a #7:  The notion that satellite results are somehow pure and unadjusted is just plain wrong.  The satellite data set takes a lot of mathematical effort to get right, something that Roy Spencer who does this work (and is considered in the skeptic camp) will be the first to tell you.  Satellites have to be adjusted for different things.  They have advantages over ground measurement because they cover most all the Earth, they are not subject to urban heat biases, and bring some technological consistency to the measurement.  However, the satellites used are constantly dieing off and being replaced, orbits decay and change, and thus times of observation of different parts of the globe change [to their credit, the satellite folks release all their source code for correcting these things].   I have become convinced the satellites, net of all the issues with both technologies, provide a better estimate but neither are perfect.

California Drought Update -- Not Even Close to Worst Drought Ever

There is little trend evidence anywhere that climate is getting -- pick the world -- weirder, more extreme, out of whack, whatever.  In particular, name any severe weather category you can imagine, and actual data in trend charts likely will not show any recent trend.

The reasons the average person on the street will swear you are a crazy denier for pointing such a thing out to them is that the media bombards them with news of nearly every 2+ sigma weather event, calling most of these relatively normal episodes as "the worst ever".

A great example is the California drought.  Here is the rolling average 5-year precipitation chart for California.  Find the worst drought "ever".

multigraph3

I know no one trusts anyone else's data in public debates, but you can make these charts yourself at the NOAA site, just go here:  http://www.ncdc.noaa.gov/cag/.  The one record set was that 2013 had the lowest measured CA precipitation in the last century plus, so that was indeed a record bad year, but droughts are typically made up of multiple years of below average precipitation and by that measure the recent CA drought is the fourth or fifth worst.

By the way, Paul Homewood points out something that even surprised me and I try not to be susceptible to the mindless media bad news stampeded:  California rainfall this year was close to normal.  And, as you can see, there is pretty much no trend over the last century plus in California rainfall:

multigraph1


As discussed previously, let's add the proviso that rainfall is not necessarily the best metric of drought.  The Palmer drought index looks at moisture in soil and takes into account other factors like temperature and evaporation, and by that metric this CA drought is closer to the worst of the century, though certainly not what one would call unprecedented.  Also, there is a worsening trend in the Palmer data.

multigraph_palmer


Update:  By the way, the fact that two measures of drought give us two different answers on the relative severity of the drought and on the trend in droughts is typical.   It makes a mockery of the pretense to certainty on these topics in the media.  Fortunately, I am not so invested in the whole thing that I can't include data that doesn't support my thesis.

Why Do Climate Change Claims Consistently Get a Fact-Checker Pass?

It is almost impossible to read a media story any more about severe weather events without seeing some blurb about such and such event being the result of manmade climate change.  I hear writers all the time saying that it is exhausting to run the gauntlet of major media fact checkers, so why do they all get a pass on these weather statements?  Even the IPCC, which we skeptics think is exaggerating manmade climate change effects, refused to link current severe weather events with manmade CO2.

The California drought brings yet another tired example of this.  I think pretty much everyone in the media has operated from the assumption that the current CA drought is 1. unprecedented and 2. man-made. The problem is that neither are true.  Skeptics have been saying this for months, pointing to 100-year California drought data and pointing to at 2-3 other events in the pre-manmade-CO2 era that were at least as severed.  But now the NOAA has come forward and said roughly the same thing:

Natural weather patterns, not man-made global warming, are causing the historic drought parching California, says a study out Monday from federal scientists.

"It's important to note that California's drought, while extreme, is not an uncommon occurrence for the state," said Richard Seager, the report's lead author and professor with Columbia University's Lamont Doherty Earth Observatory. The report was sponsored by the National Oceanic and Atmospheric Administration. The report did not appear in a peer-reviewed journal but was reviewed by other NOAA scientists.

"In fact, multiyear droughts appear regularly in the state's climate record, and it's a safe bet that a similar event will happen again," he said.

The persistent weather pattern over the past several years has featured a warm, dry ridge of high pressure over the eastern north Pacific Ocean and western North America. Such high-pressure ridges prevent clouds from forming and precipitation from falling.

The study notes that this ridge — which has resulted in decreased rain and snowfall since 2011 — is almost opposite to what computer models predict would result from human-caused climate change.

There is an argument to be made that this drought was made worse by the fact that the low precipitation was mated with higher-than average temperatures that might be partially attributable to man-made climate change.  One can see this in the Palmer drought severity index, which looks at more factors than just precipitation.  While the last 3 years was not the lowest for rainfall in CA over the last 100, I believe the Palmer index was the lowest for the last 3 years of any period in the last 100+ years.  The report did not address this warming or attempt to attribute some portion of it to man, but it is worth noting that temperatures this year in CA were, like the drought, not unprecedented, particularly in rural areas (urban areas are going to be warmer than 50 years ago due to increasing urban heat island effect, which is certainly manmade but has nothing to do with CO2.)

Update:  By the way, note the article is careful to give several paragraphs after this bit to opponents who disagree with the findings.  Perfectly fine.  But note that this is the courtesy that is increasingly denied to skeptics when the roles are reversed.  Maybe I should emulate climate alarmists and be shouting "false balance!  the science is settled!"

Reconciling Seemingly Contradictory Climate Claims

At Real Science, Steven Goddard claims this is the coolest summer on record in the US.

The NOAA reports that both May and June were the hottest on record.

It used to be the the media would reconcile such claims and one might learn something interesting from that reconciliation, but now all we have are mostly-crappy fact checks with Pinocchio counts.  Both these claims have truth on their side, though the NOAA report is more comprehensively correct.  Still, we can learn something by putting these analyses in context and by reconciling them.

The NOAA temperature data for the globe does indeed show May and June as the hottest on record.  However, one should note a couple of things

  • The two monthly records do not change the trend over the last 10-15 years, which has basically been flat.  We are hitting records because we are sitting on a plateau that is higher than the rest of the last century (at least in the NOAA data).  It only takes small positive excursions to reach all-time highs
  • There are a number of different temperature data bases that measure the temperature in different ways (e.g. satellite vs. ground stations) and then adjust those raw readings using different methodologies.  While the NOAA data base is showing all time highs, other data bases, such as satellite-based ones, are not.
  • The NOAA database has been criticized for manual adjustments to temperatures in the past which increase the warming trend.  Without these adjustments, temperatures during certain parts of the 1930's (think: Dust Bowl) would be higher than today.  This was discussed here in more depth.  As is usual when looking at such things, some of these adjustments are absolutely appropriate and some can be questioned.  However, blaming the whole of the warming signal on such adjustments is just wrong -- satellite data bases which have no similar adjustment issues have shown warming, at least between 1979 and 1999.

The Time article linked above illustrated the story of these record months with a video partially on wildfires.  This is a great example of how temperatures are indeed rising but media stories about knock-on effects, such as hurricanes and fires, can be full of it.  2014 has actually been a low fire year so far in the US.

So the world is undeniably on the warm side of average (I won't way warmer than normal because what is "normal"?)  So how does Goddard get this as the coolest summer on record for the US?

Well, the first answer, and it is an important one to remember, is that US temperatures do not have to follow global temperatures, at least not tightly.  While the world warmed 0.5-0.7 degrees C from 1979-1999, the US temperatures moved much less.  Other times, the US has warmed or cooled more than the world has.  The US is well under 5% of the world's surface area.  It is certainly possible to have isolated effects in such an area.  Remember the same holds true the other way -- heat waves in one part of the world don't necessarily mean the world is warming.

But we can also learn something that is seldom discussed in the media by looking at Goddard's chart:

click to enlarge

First, I will say that I am skeptical of any chart that uses "all USHCN" stations because the number of stations and their locations change so much.  At some level this is an apples to oranges comparison -- I would be much more comfortable to see a chart that looks at only USHCN stations with, say, at least 80 years of continuous data.  In other words, this chart may be an artifact of the mess that is the USHCN database.

However, it is possible that this is correct even with a better data set and against a backdrop of warming temperatures.  Why?  Because this is a metric of high temperatures.  It looks at the number of times a data station reads a high temperature over 90F.  At some level this is a clever chart, because it takes advantage of a misconception most people, including most people in the media have -- that global warming plays out in higher daytime high temperatures.

But in fact this does not appear to be the case.  Most of the warming we have seen over the last 50 years has manifested itself as higher nighttime lows and higher winter temperatures.  Both of these raise the average, but neither will change Goddard's metric of days above 90F.  So it is perfectly possible Goddard's chart is right even if the US is seeing a warming trend over the same period.  Which is why we have not seen any more local all-time daily high temperature records set recently than in past decades.  But we have seen a lot of new records for high low temperature, if that term makes sense.  Also, this explains why the ratio of daily high records to daily low records has risen -- not necessarily because there are a lot of new high records, but because we are setting fewer low records.  We can argue about daytime temperatures but nighttime temperatures are certainly warmer.

This chart shows an example with low and high temperatures over time at Amherst, MA  (chosen at random because I was speaking there).  Note that recently, most warming has been at night, rather than in daily highs.

On The Steven Goddard Claim of "Fabricated" Temperature Data

Steven Goddard of the Real Science blog has a study that claims that US real temperature data is being replaced by fabricated data.  Christopher Booker has a sympathetic overview of the claims.

I believe that there is both wheat and chaff in this claim, and I would like to try to separate the two as best I can.  I don't have time to write a well-organized article, so here is just a list of thoughts

  1. At some level it is surprising that this is suddenly news.  Skeptics have criticized the adjustments in the surface temperature database for years
  2. There is certainly a signal to noise ratio issue here that mainstream climate scientists have always seemed insufficiently concerned about.  Specifically, the raw data for US temperatures is mostly flat, such that the manual adjustments to the temperature data set are about equal in magnitude to the total warming signal.  When the entire signal one is trying to measure is equal to the manual adjustments one is making to measurements, it probably makes sense to put a LOT of scrutiny on the adjustments.  (This is a post from 7 years ago discussing these adjustments.  Note that these adjustments are less than current ones in the data base as they have been increased, though I cannot find a similar chart any more from the NOAA discussing the adjustments)
  3. The NOAA HAS made adjustments to US temperature data over the last few years that has increased the apparent warming trend.  These changes in adjustments have not been well-explained.  In fact, they have not really be explained at all, and have only been detected by skeptics who happened to archive old NOAA charts and created comparisons like the one below.  Here is the before and after animation (pre-2000 NOAA US temperature history vs. post-2000).  History has been cooled and modern temperatures have been warmed from where they were being shown previously by the NOAA.  This does not mean the current version  is wrong, but since the entire US warming signal was effectively created by these changes, it is not unreasonable to act for a detailed reconciliation (particularly when those folks preparing the chart all believe that temperatures are going up, so would be predisposed to treating a flat temperature chart like the earlier version as wrong and in need of correction.
    1998changesannotated
  4. However, manual adjustments are not, as some skeptics seem to argue, wrong or biased in all cases.  There are real reasons for manual adjustments to data -- for example, if GPS signal data was not adjusted for relativistic effects, the position data would quickly get out of whack.  In the case of temperature data:
    • Data is adjusted for shifts in the start/end time for a day of measurement away from local midnight (ie if you average 24 hours starting and stopping at noon).  This is called Time of Observation or TOBS.  When I first encountered this, I was just sure it had to be BS.  For a month of data, you are only shifting the data set by 12 hours or about 1/60 of the month.  Fortunately for my self-respect, before I embarrassed myself I created a spreadsheet to monte carlo some temperature data and play around with this issue.  I convinced myself the Time of Observation adjustment is valid in theory, though I have no way to validate its magnitude  (one of the problems with all of these adjustments is that NOAA and other data authorities do not release the source code or raw data to show how they come up with these adjustments).   I do think it is valid in science to question a finding, even without proof that it is wrong, when the authors of the finding refuse to share replication data.  Steven Goddard, by the way, believes time of observation adjustments are exaggerated and do not follow NOAA's own specification.
    • Stations move over time.  A simple example is if it is on the roof of a building and that building is demolished, it has to move somewhere else.  In an extreme example the station might move to a new altitude or a slightly different micro-climate.  There are adjustments in the data base for these sort of changes.  Skeptics have occasionally challenged these, but I have no reason to believe that the authors are not using best efforts to correct for these effects (though again the authors of these adjustments bring criticism on themselves for not sharing replication data).
    • The technology the station uses for measurement changes (e.g. thermometers to electronic devices, one type of electronic device to another, etc.)   These measurement technologies sometimes have known biases.  Correcting for such biases is perfectly reasonable  (though a frustrated skeptic could argue that the government is diligent in correcting for new cooling biases but seldom corrects for warming biases, such as in the switch from bucket to water intake measurement of sea surface temperatures).
    • Even if the temperature station does not move, the location can degrade.  The clearest example is a measurement point that once was in the country but has been engulfed by development  (here is one example -- this at one time was the USHCN measurement point with the most warming since 1900, but it was located in an open field in 1900 and ended up in an asphalt parking lot in the middle of Tucson.)   Since urban heat islands can add as much as 10 degrees F to nighttime temperatures, this can create a warming signal over time that is related to a particular location, and not the climate as a whole.  The effect is undeniable -- my son easily measured it in a science fair project.  The effect it has on temperature measurement is hotly debated between warmists and skeptics.  Al Gore originally argued that there was no bias because all measurement points were in parks, which led Anthony Watts to pursue the surface station project where every USHCN station was photographed and documented.  The net results was that most of the sites were pretty poor.  Whatever the case, there is almost no correction in the official measurement numbers for urban heat island effects, and in fact last time I looked at it the adjustment went the other way, implying urban heat islands have become less of an issue since 1930.  The folks who put together the indexes argue that they have smoothing algorithms that find and remove these biases.  Skeptics argue that they just smear the bias around over multiple stations.  The debate continues.
  5. Overall, many mainstream skeptics believe that actual surface warming in the US and the world has been about half what is shown in traditional indices, an amount that is then exaggerated by poorly crafted adjustments and uncorrected heat island effects.  But note that almost no skeptic I know believes that the Earth has not actually warmed over the last 100 years.  Further, warming since about 1980 is hard to deny because we have a second, independent way to measure global temperatures in satellites.  These devices may have their own issues, but they are not subject to urban heat biases or location biases and further actually measure most of the Earth's surface, rather than just individual points that are sometimes scores or hundreds of miles apart.  This independent method of measurement has shown undoubted warming since 1979, though not since the late 1990's.
  6. As is usual in such debates, I find words like "fabrication", "lies",  and "myth" to be less than helpful.  People can be totally wrong, and refuse to confront their biases, without being evil or nefarious.

Postscript:  Not exactly on topic, but one thing that is never, ever mentioned in the press but is generally true about temperature trends -- almost all of the warming we have seen is in nighttime temperatures, rather than day time.  Here is an example from Amherst, MA (because I just presented up there).  This is one reason why, despite claims in the media, we are not hitting any more all time daytime highs than we would expect from a normal distribution.  If you look at temperature stations for which we have 80+ years of data, fewer than 10% of the 100-year highs were set in the last 10 years.  We are setting an unusual number of records for high low temperature, if that makes sense.

click to enlarge


Some Responsible Press Coverage of Record Temperatures

The Phoenix New Times blog had a fairly remarkable story on a record-hot Phoenix summer.  The core of the article is a chart from the NOAA.  There are three things to notice in it:

  • The article actually acknowledges that higher temperatures were due to higher night-time lows rather than higher daytime highs  Any mention of this is exceedingly rare in media stories on temperatures, perhaps because the idea of a higher low is confusing to communicate
  • It actually attributes urban warming to the urban heat island effect
  • It makes no mention of global warming

Here is the graphic:

hottest-summer


This puts me in the odd role of switching sides, so to speak, and observing that greenhouse warming could very likely manifest itself as rising nighttime lows (rather than rising daytime highs).  I can only assume the surrounding area of Arizona did not see the same sort of records, which would support the theory that this is a UHI effect.

Phoenix has a huge urban heat island effect, which my son actually measured.  At 9-10 in the evening, we measured a temperature differential of 8-12F from city center to rural areas outside the city.  By the way, this is a fabulous science fair project if you know a junior high or high school student trying to do something different than growing bean plants under different color lights.

Savage Austerity

It seems very popular to publicly declare, even continually reiterate, that there is a trend without actually, you know, showing the trend data.  I won't declare this to be a media trend, but this summer we were plagued with news reports about the drought "trend" when in fact no such trend exists in the US data  (NOAA data from this article). Something similar holds for the supposed British austerity.  Here is British government spending in real dollars (via here)

Global Warming Ate My House

This has already made the rounds but I can't resist mocking an HBS professors whose classes I assiduously avoided when I was there.  Her house was hit by lightning.  Apparently, this was not the fault of poor lightning protection for her house, but was due to your SUV:

I am not a climate change scientist, but I have come to understand that I am a climate change victim. Our daughter took the lead investigating destructive lightning in Maine. She found that the NASA Goddard Institute estimates a 5-6% change in global lightning frequencies for every 1 degree Celsius global warming. The Earth has already warmed .8 degrees Celsius since 1802 and isexpected to warm another 1.1-6.4 degrees by the end of the century. Maine's temperatures rose 1.9 degrees Celsius in the last century and another 2.24 degree rise is projected by 2104. I learned from our insurance company that while the typical thunderstorm produces around 100 lightning strikes, there were 217 strikes around our house that night. I was shocked to discover that when it comes to increased lightning frequency and destructiveness, a NASA study concluded that eastern areas of North America like Maine are especially vulnerable. Scientists confirm a 10% increase in the incidence of extreme weather events in our region since 1949.

This is one of those paragraphs that is so bad, I put off writing about it because I could write a book about all the errors.

  • The 5-6% lightning strike estimate comes from one single study that I have never seen replicated, but more importantly comes from running a computer model.  Though it may exist, I have found no empirical evidence that lightning activity has net increased with increases in temperature
  • The world has warmed about 0.8C over the last century or two. Congrats.  Infinite monkeys and Shakespeare and all that.
  • We could argue the forecasts, but they are irrelevant to this discussion as we are talking about current weather which cannot be influenced by future warming.
  • Her claim that Maine's temperature rose 1.9C in the last Century is simply absurd.  Apparently she got the data from some authoritative place called nextgenerationearth.com, but its impossible to know since in the few days since she published this article that site has taken down the page.  So we will just have to rely on a lesser source like the NOAA for Maine temperatures.  Here story is from 2009 so I used data through 2009

Annual Averages in Maine:

Oops, not a lot of warming here, and certainly not 1.9C.  In fact, there has not even been a single year that has been 1.9C above the average for the century since the early 1900s.  And 2009 was a below average year.
Well, she said it was in summer.  That's when we get the majority of thunderstorms.  Maybe it is just summer warming?  The NOAA does not have a way to get just summer, but I can run average temperatures for July-September of each year, which matches summer within about 8 days.

Whoa!  What's this?  A 0.3-0.4C drop in the last 100 years.   And summer of 2009 (the last data point) was well below average. Wow, I guess cooling causes lightning.  We better do something about that cooling, and fast!  Or else buy this professor some lightning rods.
And you have to love evidence like this

I learned from our insurance company that while the typical thunderstorm produces around 100 lightning strikes, there were 217 strikes around our house that night

What is this, the climate version of the Lake Wobegone Effect?  If all our storms are not below average, then that is proof of climate change.  Is this really how a Harvard professor does statistical analysis?  She can just look at a sample and the mean and determine from that one sample that the mean is shifting?

Finally, she goes on to say that extreme weather in her area is up 10% from some source called the Gulf of Maine Council on Marine Environment.  Well, of course, you can't find that fact anywhere on the source she links.  And besides, even if Maine extreme weather is up, it can't be because of warming because Maine seems to be cooling.

This is just a classic example of the observer bias that is driving the whole "extreme weather" meme.  I will show you what is going on by analogy.  This is from the Wikipedia page on "Summer of the Shark":

The media's fixation with shark attacks began on July 6, when 8-year-old Mississippi boy Jessie Arbogast was bitten by a bull shark while standing in shallow water at Santa Rosa Island's Langdon Beach. ...

Immediately after the near-fatal attack on Arbogast, another attack severed the leg of a New Yorker vacationing in The Bahamas, while a third attack on a surfer occurred about a week later on July 15, six miles from the spot where Arbogast was bitten.[6] In the following weeks, Abrogast's spectacular rescue and survival received extensive coverage in the 24-hour news cycle, which was renewed (and then redoubled) with each subsequent report of a shark incident. The media fixation continued story with a cover story in the July 30th issue of Time magazine.

In mid-August, many networks were showing footage captured by helicopters of hundreds of sharks coalescing off the southwest coast of Florida. Beach-goers were warned of the dangers of swimming,[7] despite the fact that the swarm was likely part of an annual shark migration.[8] The repeated broadcasts of the shark group has been criticized as blatant fear mongering, leading to the unwarranted belief of a so-called shark "epidemic".[8]...

In terms of absolute minutes of television coverage on the three major broadcast networks—ABCCBS, and NBCshark attacks were 2001's third "most important" news story prior toSeptember 11, behind the western United States forest fires, and the political scandal resulting from the Chandra Levy missing persons case.[11] However, the comparatively higher shock value of shark attacks left a lasting impression on the public. According to the International Shark Attack File, there were 76 shark attacks that occurred in 2001, lower than the 85 attacks documented in 2000; furthermore, although 5 people were killed in attacks in 2001, this was less than the 12 deaths caused by shark attacks the previous year.[12]

A trend in news coverage <> a trend in the underlying frequency. If these were correlated, gas prices would only go up and would never come down.

CO2 and Tornadoes

Well, you now have a simple algorithm for sorting flakes and politicized hacks from honest scientists -- anyone who is going around this week saying that the tornadoes in Alabama this week were due to manmade CO2 sit firmly in the former category.  First up, Dr. Roy Spencer

If there is one weather phenomenon global warming theory does NOT predict more of, it would be severe thunderstorms and tornadoes.

Tornadic thunderstorms do not require tropical-type warmth. In fact, tornadoes are almost unheard of in the tropics, despite frequent thunderstorm activity.

Instead, tornadoes require strong wind shear (wind speed and direction changing rapidly with height in the lower atmosphere), the kind which develops when cold and warm air masses “collide”. Of course, other elements must be present, such as an unstable airmass and sufficient low-level humidity, but wind shear is the key. Strong warm advection (warm air riding up and over the cooler air mass, which is also what causes the strong wind shear) in advance of a low pressure area riding along the boundary between the two air masses is where these storms form.

But contrasting air mass temperatures is the key. Active tornado seasons in the U.S. are almost always due to unusually COOL air persisting over the Midwest and Ohio Valley longer than it normally does as we transition into spring.

For example, the poster child for active tornado seasons was the Superoutbreak of 1974, which was during globally cool conditions. This year, we are seeing much cooler than normal conditions through the corn belt, even delaying the planting schedule. Cool La Nina years seem to favor more tornadoes, and we are now coming out of a persistent La Nina. The global-average temperature has plummeted by about 1 deg. F in just one year.

An unusually warm Gulf of Mexico of 1 or 2 degrees right now cannot explain the increase in contrast between warm and cold air masses which is key for tornado formation because that slight warmth cannot compete with the 10 to 20 degree below-normal air in the Midwest and Ohio Valley which has not wanted to give way to spring yet.

The “extra moisture” from the Gulf is not that important, because it’s almost always available this time of year…it’s the wind shear that caused this outbreak.

More tornadoes due to “global warming”, if such a thing happened, would be more tornadoes in Canada, where they don’t usually occur. NOT in Alabama.

Thus we yet again run into the logic of the marketing campaign to change the effect of CO2 from global warming to climate change, as if CO2 could somehow make for random climate changes without the intermediate step of warming.

We all draw upon fallible memories to come to conclusions about whether events are more or less prevalent today, and in many cases our memories fail us (often due to observer bias, in particular the increasing frequency of an event in the media being mistaken for the increasing underlying frequency of the event).  I will say that my memory is that the seventies were the time in my life with the most severe weather (including horrible regional famines) and the seventies were the coldest decade of my life so far.

Anyway, tornadoes are something we can measure, rather than just remember, so let's go to the data:

In An Inconvenient Truth, Al Gore and company said that global warming was increasing the number of tornadoes in the US.  He claimed 2004 was the highest year ever for tornadoes in the US.  In his PowerPoint slide deck (on which the movie was based) he sometimes uses this chart (form the NOAA):

Whoa, that’s scary.  Any moron can see there is a trend there.  Its like a silver bullet against skeptics or something.  But wait.  Hasn’t tornado detection technology changed over the last 50 years?  Today, we have doppler radar, so we can detect even smaller size 1 tornadoes, even if no one on the ground actually spots them (which happens fairly often).  But how did they measure smaller tornadoes in 1955 if no one spotted them?  Answer:  They didn’t.  In effect, this graph is measuring apples and oranges.  It is measuring all the tornadoes we spotted by human eye in 1955 with all the tornadoes we spotted with doppler radar in 2000.   The NOAA tries to make this problem clear on their web site.

With increased national doppler radar coverage, increasing population, and greater attention to tornado reporting, there has been an increase in the number of tornado reports over the past several decades. This can create a misleading appearance of an increasing trend in tornado frequency. To better understand the true variability and trend in tornado frequency in the US, the total number of strong to violent tornadoes (F3 to F5 category on the Fujita scale) can be analyzed. These are the tornadoes that would have likely been reported even during the decades before Dopplar radar use became widespread and practices resulted in increasingtornado reports. The bar chart below indicates there has been little trend in the strongest tornadoes over the past 55 years.

So itt turns out there is a decent way to correct for this.  We don’t think that folks in 1955 were missing many of the larger class 3-5 tornadoes, so comparing 1955 and 2000 data for these larger tornadoes should be more apples to apples (via NOAA).

Well, that certainly is different (note 2004 in particular, given the movie claim).  No upward trend at all when you get the data right.  I wonder if Al Gore knows this?  I am sure he is anxious to set the record straight.

The last chart is dated - am I hiding something?  Nope, here is the update (from here)

By the way, note the 2nd to last bar, which I believe it the 2008 bar (this chart is really hard to read, but it is the only way I have found the data from the NOAA).  In spring of 2008, the media went nuts with a spring spate of tornadoes, saying that the apocalypse was here and this was the ultimate proof of global warming.  In particular, ABC ran a story about how the frequency was twice the previous year.  Beyond the insanity of drawing long term trends in a noisy system from 2 data points, notice that the previous year was virtually the lowest number in half a century, and despite being twice as high, 2008 turned out to be an average to lower-than-average tornado year.  This is what the media does with the climate issue, and why you can trust almost none of it.

Update: By the way, 10 of the top 10 deadliest tornadoes occurred before 1955?  An artifact of increasing wealth, better construction, and in particular better warning and communication systems?  Likely -- it is no accident, I think, these all occurred before the popularization of TV.  However, remember this argument when you see charts of increasing property damage from hurricanes.  These are also an artifact of increasing wealth, but the other way around -- more rich people build expensive houses on the beech, the more property damage from hurricanes irregardless of hurricane strength or frequency.

Update#2:  The entire outbreak may be the third deadliest in the century.

Fake but Accurate -- Now Coming to the Hard Sciences

Most of us remember the famous "fake but accurate" defense of Dan Rather's story on GWB using forged National Guard documents.  If the post-modernism movement were to have an insignia, their tag line  (their "E. Pluribus Unum') could well be "fake but accurate." 

I have written for a while that post-modernism seems to be coming to the hard sciences (I differentiate the hard sciences, because the soft sciences like sociology or women's studies are already dominated by post-modernist thinking).  For example, I quoted this:

For
those of you who cling to scientific method, this is pretty bizarre
stuff. But she, and many others, are dead serious about it. If a
research finding could harm a class of persons, the theory is that
scientists should change the way they talk about that finding. Since scientific method is a way of building a body of knowledge based on skeptical testing, replication, and publication, this is a problem.The tight framework of scientific method mandates figuring out what would disprove the theory being tested and then looking for the disproof.
The thought process that spawned the scientific revolution was
inherently skeptical, which is why disciples of scientific method say
that no theory can be definitively and absolutely proved, but only
disproved (falsified). Hypotheses are elevated to the status of
theories largely as a result of continued failures to disprove the
theory and continued conformity of experimentation and observation with
the theory, and such efforts should be conducted by diverse parties.Needless to say postmodernist schools of thought and scientific method are almost polar opposites.

So here is today's example of fake but accurate in the sciences, not surprisingly also from climate science:

While the critic's advice - to use trained statisticians in studies
reliant on statistics - may seem too obvious to need stating, the
"science is settled" camp resists it. Mann's hockey-stick graph may be
wrong, many experts now acknowledge, but they assert that he
nevertheless came to the right conclusion.

To which the critics,
and doubtless others who want more rigourous science, shake their heads
in disbelief. They are baffled by the claim that the incorrect method
doesn't matter because the answer is correct anyway. With bad science, only true believers can assert that they nevertheless obtained the right answer.

A huge number of physicists and geologists who actually take the time to look into the details of climate science come away being shocked at the scholarship.  Take a world class physicist, drop him into a discussion of the details of the Mann hockey stick analysis, and in an hour you will have a skeptic.

Crazy?  Remember the words of from National Center for Atmospheric Research (NOAA) climate researcher and global warming action promoter, Steven Schneider:

We
have to offer up scary scenarios, make simplified, dramatic statements,
and make little mention of any doubts we have. Each of us has to decide
what the right balance is between being effective and being honest.

Today's Science Experiment

(Cross posted from Climate Skeptic)

Using this chart from the NOAA:

Marchmay2008conus

Explain how larger than average midwestern flooding in 2008 is due to global warming.  For those
who wish to make the argument that global temperatures, not just US
temperatures, matter because the world is one big interelated climate system,
you may use this chart of global temperatures instead in your explanation:

Rss_may_08520

For extra credit, also blame 2008 spike in tornadoes on global warming.  Don't forget to explain how global warming caused the late onset of Spring this year and the especially heavy snowfalls over the winter. 
Thanks for charts to Anthony
Watt
.

Tornadoes

It is incredible to me that anyone could treat Senator Kerry seriously at this point, but a credulous media seems to be lapping up his accusations that recent tornadoes represent an increase in such storm activity caused by global warming. 

I am way too tired of refuting this stuff over and over to repeat the whole post I put up a while ago about tornado frequency, but you can find it here.  But here is the short answer for those to tired to click through:  Apparent increases in tornado frequency are an artifact of improved technology that can detect more tornadoes.  If one corrects for this by looking only at tornadoes of the larger sizes (3-5) that were consistently detectable with 1950's technology, there has actually been a small decreasing trend in tornado strikes in the US.

This is drop-dead obvious to anyone who knows anything about weather.  However, since it keeps coming up, the NOAA has an explanation quite similar to mine plastered all over their site.

With increased national doppler radar coverage, increasing population,
and greater attention to tornado reporting, there has been an increase
in the number of tornado reports over the past several decades. This
can create a misleading appearance of an increasing trend in tornado
frequency. To better understand the true variability and trend in
tornado frequency in the US, the total number of strong to violent
tornadoes (F3 to F5 category on the Fujita scale) can be analyzed.
These are the tornadoes that would have likely been reported even
during the decades before Dopplar radar use became widespread and
practices resulted in increasing tornado reports. The bar chart below
indicates there has been little trend in the strongest tornadoes over
the past 55 years.

My daughter when she was 9 years old was able to more accurately portray this fact in a class project than did Mr. Kerry.

Supply and Demand, But Not In Water

Thanks to a reader comes this article from the NY Times that yet again discusses a water shortage and possible government action without once mentioning the word "price."  If water prices floated like gas prices, we wouldn't have to discuss things like these:

Within two weeks, Carol Couch, director of the Georgia Environmental
Protection Division, is expected to send Gov. Sonny Perdue
recommendations on tightening water restrictions, which may include
mandatory cutbacks on commercial and industrial users.

If that
happens, experts at the National Drought Mitigation Center said, it
would be the first time a major metropolitan area in the United States
had been forced to take such drastic action to save its water supply.

But of course politicians love being responsible for resource allocation through command-and-control government, because it creates winners and losers and both will then donate to the next election cycle.  Atlanta already has fairly expensive water, but a quick 50% rate hike about 3 months ago would have likely obviated this shortage while also providing the municipality with additional funds to develop new sources.

I wrote a lot more about water scarcity and the price mechanism, including the observation that Phoenix ridiculously has some of the lowest water prices in the country, here.

postscript: One of the media tricks to make things look worse and panicky is to present asymmetric charts.  For example, the NY Times presents this drought map:
2007droughtgraphic

All you see is what one presumes to be normal in white and then a lot of drought.  But in fact, this chart is truncated.  It omits all the data for areas that are wetter than usual.  Here is the chart for September form the NOAA with both over and under precipitation over the past 12 months:

Spi12_200709_pg

Whoa, that shows a different picture, huh?  Basically, about as much stuff is wetter than normal as drier than normal.  Which is exactly what one might expect in any period.  And by the way, if you look at the last five years, the US is pretty freaking wet:

Usnmx20070960monpctpcppg

A Temperature Adjustment Example

I won't go back into all the details, but I have posted before about just how large the manual adjustments to temperature numbers are (the "noise") as compared to the magnitude of measured warming (the "signal").  This issue of manual temperature corrections is the real reason the NASA temperature restatements are important (not the absolute value of the restatement).

Here is a quick visual example.  Both charts below are from James Hansen and the GISS and are for the US only.  Both use basically the same temperature measurement network (the USHCN).  The one on the left was Hansen's version of US temperatures in 1999.  The one on the right he published in 2001.
Hansen_1999_v_2001

The picture at the right is substantially different  than the one on the left.  Just look at 1932 and 1998.  Between the first and second chart, none of the underlying temperature measurements changed.  What changed  were the adjustments to the underlying measurements applied by the NOAA and by the GISS.  For some reason, temperatures after 1980 have been raised and temperatures in the middle of the century were lowered.

For scientists to apply a negative temperature adjustment to measurements, as they did for the early 1930's, it means they think there was some warming bias in 1932 that does not exist today.  When scientists raise current temperatures, they are saying there is some kind of cooling bias that exists today that did not exist in the 1930's.  Both of these adjustments are basically implying the same thing:  That temperature measurement was more biased upwards, say by asphalt and urbanization and poor sitings, in 1932 than they are today.  Does this make any freaking sense at all?

Of course, there may be some other bias at work here that I don't know about.  But I and everyone else in the world are forced to guess because the NOAA and the GISS insist on keeping their adjustment software and details a secret, and continue to resist outside review.

Read much more about this from Steve McIntyre.

Some Final Thoughts on The NASA Temperature Restatement

I got a lot of traffic this weekend from folks interested in the US historical temperature restatement at NASA-GISS.  I wanted to share to final thoughts and also respond to a post at RealClimate.org (the #1 web cheerleader for catastrophic man-made global warming theory).

  1. This restatement does not mean that the folks at GISS are necessarily wrong when they say the world has been warming over the last 20 years.  We know from the independent source of satellite measurements that the Northern Hemisphere has been warming (though not so much in the Southern Hemisphere).  However, surface temperature measurements, particularly as "corrected" and aggregated at the GISS, have always been much higher than the satellite readings.  (GISS vs Satellite)  This incident may start to give us an insight into how to bring those two sources into agreement. 
  2. For years, Hansen's group at GISS, as well as other leading climate scientists such as Mann and Briffa (creators of historical temperature reconstructions) have flaunted the rules of science by holding the details of their methodologies and algorithm's secret, making full scrutiny impossible.  The best possible outcome of this incident will be if new pressure is brought to bear on these scientists to stop saying "trust me" and open their work to their peers for review.  This is particularly important for activities such as Hansen's temperature data base at GISS.  While measurement of temperature would seem straight forward, in actual fact the signal to noise ration is really low.  Upward "adjustments" and fudge factors added by Hansen to the actual readings dwarf measured temperature increases, such that, for example, most reported warming in the US is actually from these adjustments, not measured increases.
  3. In a week when Newsweek chose to argue that climate skeptics need to shut up, this incident actually proves why two sides are needed for a quality scientific debate.  Hansen and his folks missed this Y2K bug because, as a man-made global warming cheerleader, he expected to see temperatures going up rapidly so he did not think to question the data.  Mr. Hansen is world-famous, is a friend of luminaries like Al Gore, gets grants in quarter million dollar chunks from various global warming believers.  All his outlook and his incentives made him want the higher temperatures to be true.  It took other people with different hypotheses about climate to see the recent temperature jump for what it was: An error.

The general response at RealClimate.org has been:  Nothing to see here, move along.

Among other incorrect stories going around are that the mistake was due
to a Y2K bug or that this had something to do with photographing
weather stations. Again, simply false.

I really, really don't think it matters exactly how the bug was found, except to the extent that RealClimate.org would like to rewrite history and convince everyone this was just a normal adjustment made by the GISS themselves rather than a mistake found by an outsider.  However, just for the record, the GISS, at least for now until they clean up history a bit, admits the bug was spotted by Steven McIntyre.  Whatever the bug turned out to be, McIntyre initially spotted it as a discontinuity that seemed to exist in GISS data around the year 2000.  He therefore hypothesized it was a Y2K bug, but he didn't know for sure because Hansen and the GISS keep all their code as a state secret.  And McIntyre himself says he became aware of the discontinuity during a series of posts that started from a picture of a weather station at Anthony Watts blog.  I know because I was part of the discussion, talking to these folks online in real time.  Here is McIntyre explaining it himself.

In sum, the post on RealClimate says:

Sum total of this change? A couple of hundredths of degrees in the US
rankings and no change in anything that could be considered
climatically important (specifically long term trends).

A bit of background - surface temperature readings have read higher than satellite readings of the troposphere, when the science of greenhouse gases says the opposite should be true.  Global warming hawks like Hansen and the GISS have pounded on the satellite numbers, investigating them 8 ways to Sunday, and have on a number of occasions trumpeted upward corrections to satellite numbers that are far smaller than these downward corrections to surface numbers. 

But yes, IF this is the the only mistake in the data, then this is a mostly correct statement from RealClimate.org..  However, here is my perspective:

  • If a mistake of this magnitude can be found by outsiders without access to Hansen's algorithm's or computer code just by inspection of the resulting data, then what would we find if we could actually inspect the code?  And this Y2K bug is by no means the only problem.  I have pointed out several myself, including adjustments for urbanization and station siting that make no sense, and averaging in rather than dropping bad measurement locations
  • If we know significant problems exist in the US temperature monitoring network, what would we find looking at China? Or Africa?  Or South America.  In the US and a few parts of Europe, we actually have a few temperature measurement points that were rural in 1900 and rural today.  But not one was measuring rural temps in these other continents 100 years ago.  All we have are temperature measurements in urban locations where we can only guess at how to adjust for the urbanization.  The problem in these locations, and why I say this is a low signal to noise ratio measurement, is that small percentage changes in our guesses for how much the urbanization correction should be make enormous changes (even to changing the sign) of historic temperature change measurements.

Here are my recommendations:

  1. NOAA and GISS both need to release their detailed algorithms and computer software code for adjusting and aggregating USHCN and global temperature data.  Period.  There can be no argument.  Folks at RealClimate.org who believe that all is well should be begging for this to happen to shut up the skeptics.  The only possible reason for not releasing this scientific information that was created by government employees with taxpayer money is if there is something to hide.
  2. The NOAA and GISS need to acknowledge that their assumptions of station quality in the USHCN network are too high, and that they need to incorporate actual documented station condition (as done at SurfaceStations.org) in their temperature aggregations and corrections.  In some cases, stations like Tucson need to just be thrown out of the USHCN.  Once the US is done, a similar effort needs to be undertaken on a global scale, and the effort needs to include people whose incentives and outlook are not driven by making temperatures read as high as possible.
  3. This is the easiest of all.  Someone needs to do empirical work (not simulated, not on the computer, but with real instruments) understanding how various temperature station placements affect measurements.  For example, how do the readings of an instrument in an open rural field compare to an identical instrument surrounded by asphalt a few miles away?  These results can be used for step #2 above.  This is cheap, simple research a couple of graduate students could do, but climatologists all seem focused on building computer models rather than actually doing science.
  4. Similar to #3, someone needs to do a definitive urban heat island study, to find out how much temperature readings are affected by urban heat, again to help correct in #2.  Again, I want real research here, with identical instruments placed in various locations and various radii from an urban center  (not goofy proxys like temperature vs. wind speed -- that's some scientist who wants to get a result without ever leaving his computer terminal).  Most studies have shown the number to be large, but a couple of recent studies show smaller effects, though now these studies are under attack not just for sloppiness but outright fabrication.  This can't be that hard to study, if people were willing to actually go into the field and take measurements.  The problem is everyone is trying to do this study with available data rather than by gathering new data.

Postscript:  The RealClimate post says:

However, there is clearly a latent and deeply felt wish in some sectors for the whole problem of global warming to be reduced to a statistical quirk or a mistake.

If catastrophic man-made global warming theory is correct, then man faces a tremendous lose-lose.  Either shut down growth, send us back to the 19th century, making us all substantially poorer and locking a billion people in Asia into poverty they are on the verge of escaping, or face catastrophic and devastating changes in the planet's weather.

Now take two people.  One in his heart really wants this theory not to be true, and hopes we don't have to face this horrible lose-lose tradeoff.  The other has a deeply felt wish that this theory is true, and hopes man does face this horrible future.  Which person do you like better?  And recognize, RealClimate is holding up the latter as the only moral man. 

Update:  Don't miss Steven McIntyre's take from the whole thing.  And McIntyre responds to Hansen here.

Breaking News: Recent US Temperature Numbers Revised Downwards Today

This is really big news, and a fabulous example of why two-way scientific discourse is still valuable, in the same week that both Newsweek and Al Gore tried to make the case that climate skeptics were counter-productive and evil. 

Climate scientist Michael Mann (famous for the hockey stick chart) once made the statement that  the 1990's were the
warmest decade in a millennia and that "there is a 95 to 99% certainty
that 1998 was the hottest year in the last one thousand years." (By
the way, Mann now denies he ever made this claim, though you can watch him say
these exact words in the CBC documentary Global
Warming:  Doomsday Called Off
).

Well, it turns out, according to the NASA GISS database, that 1998 was not even the hottest year of the last century.  This is because many temperatures from recent decades that appeared to show substantial warming have been revised downwards.  Here is how that happened (if you want to skip the story, make sure to look at the numbers at the bottom).

One of the most cited and used historical surface temperature databases is that of NASA/Goddard's GISS.  This is not some weird skeptics site.  It is considered one of the premier world temperature data bases, and it is maintained by anthropogenic global warming true believers.  It has consistently shown more warming than any other data base, and is thus a favorite source for folks like Al Gore.  These GISS readings in the US rely mainly on the US Historical Climate Network (USHCN) which is a network of about 1000 weather stations taking temperatures, a number of which have been in place for over 100 years.

Frequent readers will know that I have been a participant in an effort led by Anthony Watts at SurfaceStations.org to photo-document these temperature stations as an aid to scientists in evaluating the measurement quality of each station.  The effort has been eye-opening, as it has uncovered many very poor instrument sitings that would bias temperature measurements upwards, as I found in Tucson and Watts has documented numerous times on his blog.

One photo on Watt's blog got people talking - a station in MN with a huge jump in temperature about the same time some air conditioning units were installed nearby.   Others disagreed, and argued that such a jump could not be from the air conditioners, since a lot of the jump happened with winter temperatures when the AC was dormant.  Steve McIntyre, the Canadian statistician who helped to expose massive holes in Michael Mann's hockey stick methodology, looked into it.  After some poking around, he began to suspect that the GISS data base had a year 2000 bug in one of their data adjustments.

One of the interesting aspects of these temperature data bases is that they do not just use the raw temperature measurements from each station.  Both the NOAA (which maintains the USHCN stations) and the GISS apply many layers of adjustments, which I discussed here.  One of the purposes of Watt's project is to help educate climate scientists that many of the adjustments they make to the data back in the office does not necessarily represent the true condition of the temperature stations.  In particular, GISS adjustments imply instrument sitings are in more natural settings than they were in say 1905, an outrageous assumption on its face that is totally in conflict to the condition of the stations in Watt's data base.  Basically, surface temperature measurements have a low signal to noise ratio, and climate scientists have been overly casual about how they try to tease out the signal.

Anyway, McIntyre suspected that one of these adjustments had a bug, and had had this bug for years.  Unfortunately, it was hard to prove.  Why?  Well, that highlights one of the great travesties of climate science.  Government scientists using taxpayer money to develop the GISS temperature data base at taxpayer expense refuse to publicly release their temperature adjustment algorithms or software (In much the same way Michael Mann refused to release the details for scrutiny of his methodology behind the hockey stick).  Using the data, though, McIntyre made a compelling case that the GISS data base had systematic discontinuities that bore all the hallmarks of a software bug.

Today, the GISS admitted that McIntyre was correct, and has started to republish its data with the bug fixed.  And the numbers are changing a lot.  Before today, GISS would have said 1998 was the hottest year on record (Mann, remember, said with up to 99% certainty it was the hottest year in 1000 years) and that 2006 was the second hottest.  Well, no more.  Here are the new rankings for the 10 hottest years in the US, starting with #1:

1934, 1998, 1921, 2006, 1931, 1999, 1953, 1990, 1938, 1939

Three of the top 10 are in the last decade.  Four of the top ten are in the 1930's, before either the IPCC or the GISS really think man had any discernible impact on temperatures.  Here is the chart for all the years in the data base:
New_giss

There are a number of things we need to remember:

  • This is not the end but the beginning of the total reexamination that needs to occur of the USHCN and GISS data bases.  The poor correction for site location and urbanization are still huge issues that bias recent numbers upwards.  The GISS also has issues with how it aggregates multiple stations, apparently averaging known good stations with bad stations a process that by no means eliminates biases.  As a first step, we must demand that NOAA and GISS release their methodology and computer algorithms to the general public for detailed scrutiny by other scientists.
  • The GISS today makes it clear that these adjustments only affect US data and do not change any of their conclusions about worldwide data.  But consider this:  For all of its faults, the US has the most robust historical climate network in the world.  If we have these problems, what would we find in the data from, say, China?  And the US and parts of Europe are the only major parts of the world that actually have 100 years of data at rural locations.  No one was measuring temperature reliably in rural China or Paraguay or the Congo in 1900.  That means much of the world is relying on urban temperature measurement points that have substantial biases from urban heat.
  • All of these necessary revisions to surface temperatures will likely not make warming trends go away completely.  What it may do is bring the warming down to match the much lower satellite measured warming numbers we have, and will make current warming look more like past natural warming trends (e.g. early in this century) rather than a catastrophe created by man.  In my global warming book, I argue that future man-made warming probably will exist, but will be more like a half to one degree over the coming decades than the media-hyped numbers that are ten times higher.

So how is this possible?  How can the global warming numbers used in critical policy decisions and scientific models be so wrong with so basic of an error?  And how can this error have gone undetected for the better part of a decade?  The answer to the latter question is because the global warming  and climate community resist scrutiny.  This weeks Newsweek article and statements by Al Gore are basically aimed at suppressing any scientific criticism or challenge to global warming research.  That is why NASA can keep its temperature algorithms secret, with no outside complaint, something that would cause howls of protest in any other area of scientific inquiry.

As to the first question, I will leave the explanation to Mr. McIntyre:

While acolytes may call these guys "professionals", the process of
data adjustment is really a matter of statistics and even accounting.
In these fields, Hansen and Mann are not "professionals" - Mann
admitted this to the NAS panel explaining that he was "not a
statistician". As someone who has read their works closely, I do not
regard any of these people as "professional". Much of their reluctance
to provide source code for their methodology arises, in my opinion,
because the methods are essentially trivial and they derive a certain
satisfaction out of making things appear more complicated than they
are, a little like the Wizard of Oz. And like the Wizard of Oz, they
are not necessarily bad men, just not very good wizards.

For more, please see my Guide to Anthropogenic Global Warming or, if you have less time, my 60-second argument for why one should be skeptical of catastrophic man-made global warming theory.

Update:
Nothing new, just thinking about this more, I cannot get over the irony that in the same week Newsweek makes the case that climate science is settled and there is no room for skepticism, skeptics discover a gaping hole and error in the global warming numbers.

Update #2:  I know people get upset when we criticize scientists.  I get a lot of "they are not biased, they just made a mistake."  Fine.  But I have zero sympathy for a group of scientists who refuse to let other scientists review their methodology, and then find that they have been making a dumb methodology mistake for years that has corrupted the data of nearly every climate study in the last decade.

Update #3:  I labeled this "breaking news," but don't expect to see it in the NY Times anytime soon.  We all know this is one of those asymmetric story lines, where if the opposite had occurred (ie things found to be even worse/warmer than thought) it would be on the front page immediately, but a lowered threat will never make the news.

Oh, and by he way.  This is GOOD news.  Though many won't treat it that way.  I understand this point fairly well because, in a somewhat parallel situation, I seem to be the last anti-war guy who treats progress in Iraq as good news.

Update #4: I should have mentioned that the hero of the Newsweek story is catastrophic man-made global warming cheerleader James Hansen, who runs the GISS and is most responsible for the database in question as well as the GISS policy not to release its temperature aggregation and adjustment methodologies.  From IBD, via CNN Money:

Newsweek portrays James Hansen, director of NASA's Goddard Institute for Space Studies, as untainted by corporate bribery.

Hansen
was once profiled on CBS' "60 Minutes" as the "world's leading
researcher on global warming." Not mentioned by Newsweek was that
Hansen had acted as a consultant to Al Gore's slide-show presentations
on global warming, that he had endorsed John Kerry for president, and
had received a $250,000 grant from the foundation headed by Teresa
Heinz Kerry.

Update #5: My letter to the editor at Newsweek.  For those worried that this is some weird skeptic's fevered dream, Hansen and company kind of sort of recognize the error in the first paragraph under background here.  Their US temperature chart with what appears is the revised data is here.

Update #6: Several posts are calling this a "scandal."  It is not a scandal.  It is a mistake from which we should draw two lessons:

  1. We always need to have people of opposing opinions looking at a problem.  Man-made global warming hawks expected to see a lot of warming after the year 2000, so they never questioned the numbers.  It took folks with different hypotheses about climate to see the jump in the numbers for what it was - a programming error.
  2. Climate scientists are going to have to get over their need to hold their adjustments, formulas, algorithms and software secret.  It's just not how science is done.  James Hansen saying "trust me, the numbers are right, I don't need to tell you how I got them" reminds me of the mathematician Fermat saying he had a proof of his last theorem, but it wouldn't fit in the margin.  How many man-hours of genius mathematicians was wasted because Fermat refused to show his proof (which was most likely wrong, given how the theorem was eventually proved).

Final Update:  Some parting thoughts, and recommendations, here.

Storm Frequency

I already discussed Newsweek's happy little ad hominem attack on climate skeptics here.  However, as promised, I wanted to talk about the actual, you know, science for a bit, starting from the Newsweek author's throwaway statement that she felt required no
proof, "The frequency of Atlantic hurricanes has already doubled in the
last century."

This is really a very interesting topic, much more interesting than following $10,000 of skeptics' money around in a global warming industry spending billions on research.  One would think the answer to this hurricane question is simple.  Can we just look up the numbers?  Well, let's start there.  Total number of Atlantic hurricanes form the HURDAT data base, first and last half of the last century:

1905-1955 = 366
1956-2006 = 458

First, you can see nothing like a doubling.  This is an increase of 25%.  So already, we see that in an effort to discredit skeptics for fooling America about the facts, Newsweek threw out a whopper that absolutely no one in climate science, warming skeptic or true believer, would agree with.

But let's go further, because there is much more to the story.  Because 25% is a lot, and could be damning in and of itself.  But there are problems with this data.  If you think about storm tracking technology in 1905 vs. 2005, you might see the problem.  To make it really clear, I want to talk about tornadoes for a moment.

In An Inconvenient Truth, Al Gore and company said that global warming was increasing the number of tornadoes in the US.  He claimed 2004 was the highest year ever for tornadoes in the US.  In his PowerPoint slide deck (on which the movie was based) he sometimes uses this chart (form the NOAA):

Whoa, that's scary.  Any moron can see there is a trend there.  Its like a silver bullet against skeptics or something.  But wait.  Hasn't tornado detection technology changed over the last 50 years?  Today, we have doppler radar, so we can detect even smaller size 1 tornadoes, even if no one on the ground actually spots them (which happens fairly often).  But how did they measure smaller tornadoes in 1955 if no one spotted them?  Answer:  They didn't.  In effect, this graph is measuring apples and oranges.  It is measuring all the tornadoes we spotted by human eye in 1955 with all the tornadoes we spotted with doppler radar in 2000.   The NOAA tries to make this problem clear on their web site.

With increased national doppler
radar coverage, increasing population, and greater attention to tornado
reporting, there has been an increase in the number of tornado reports over the
past several decades. This can create a misleading appearance of an increasing
trend in tornado frequency. To better understand the true variability and trend
in tornado frequency in the US, the total number of strong to violent tornadoes
(F3 to F5 category on the Fujita scale) can be analyzed. These are the
tornadoes that would have likely been reported even during the decades before
Dopplar radar use became widespread and practices resulted in increasing
tornado reports. The bar chart below indicates there has been little trend in
the strongest tornadoes over the past 55 years.

So itt turns out there is a decent way to correct for this.  We don't think that folks in 1955 were missing many of the larger class 3-5 tornadoes, so comparing 1955 and 2000 data for these larger tornadoes should be more apples to apples (via NOAA).

Well, that certainly is different (note 2004 in particular, given the movie claim).  No upward trend at all when you get the data right.  I wonder if Al Gore knows this?  I am sure he is anxious to set the record straight.

OK, back to hurricanes.  Generally, whether in 1905 or 2005, we know if a hurricane hits land in the US.  However, what about all the hurricanes that don't hit land or hit land in some undeveloped area?  Might it be that we can detect these better in 2006 with satellites than we could in 1905?  Just like the tornadoes?

Well, one metric we have is US landfall.  Here is that graph  (data form the National Weather Service -- I have just extrapolated the current decade based on the first several years).

Not much of a trend there, though the current decade is high, in part due to the fact that it does not incorporate the light 2006 season nor the light-so-far 2007 season.  The second half of the 20th century is actually lower than the first half, and certainly not "twice as large".  But again, this is only a proxy.  There may be reasons more storms are formed but don't make landfall (though I would argue most Americans only care about the latter).

But what about hurricane damages?  Everyone knows that the dollar damages from hurricanes is way up.  Well, yes.  But the amount of valuable real estate on the United State's coast is also way up.  Roger Pielke and Chris Landsea (you gotta love a guy studying hurricane strikes named Landsea) took a shot at correcting hurricane damages for inflation and the increased real estate value on the coasts.  This is what they got:

Anyway, back to our very first data, several scientists are trying to correct the data for missing storms, particularly in earlier periods.  There is an active debate here about corrections I won't get into, but suffice it to say the difference between the first half of the 20th century to the latter half in terms of Atlantic hurricane formations is probably either none or perhaps a percentage increase in the single digits (but nowhere near 100% increase as reported by Newsweek).

Debate continues, because there was a spike in hurricanes from 1995-2005 over the previous 20 years.  Is this anomalous, or is it similar to the spike that occurred in the thirties and forties?  No one is sure, but isn't this a lot more interesting than figuring out how the least funded side of a debate gets their money?  And by the way, congratulations again to MSM fact-checkers.

My layman's guide to skepticism of catastrophic man-made global warming is here.  A shorter, 60-second version of the best climate skeptic's arguments is here.

Update:  If the author bothered to have a source for her statement, it would probably be Holland and Webster, a recent study that pretty much everyone disagrees with and many think was sloppy.  And even they didn't say activity had doubled.  Note the only way to get a doubling is to cherry-pick a low decade in the first half of the century and a high decade in the last half of the century and compare just those two decades -- you can see this in third paragraph of the Scientific American article.  This study bears all the hallmarks -- cherry picking data, ignoring scientific consensus, massaging results to fit an agenda -- that the Newsweek authors were accusing skeptics of.

Update #2:  The best metric for hurricane activity is not strikes or numbers but accumulated cyclonic energy.  Here is the ACE trend, as measured by Florida State.  As you can see, no upward trend.

6a00e54eeb9dc1883400e553bfddf188338

An Interesting Source of Man-Made Global Warming

The US Historical Climate Network (USHCN) reports about a 0.6C temperature increase in the lower 48 states since about 1940.  There are two steps to reporting these historic temperature numbers.  First, actual measurements are taken.  Second, adjustments are made after the fact by scientists to the data.  Would you like to guess how much of the 0.6C temperature rise is from actual measured temperature increases and how much is due to adjustments of various levels of arbitrariness?  Here it is, for the period from 1940 to present in the US:

Actual Measured Temperature Increase: 0.1C
Adjustments and Fudge Factors: 0.5C
Total Reported Warming: 0.6C

Yes, that is correct.  Nearly all the reported warming in the USHCN data base, which is used for nearly all global warming studies and models, is from human-added fudge factors, guesstimates, and corrections.

I know what you are thinking - this is some weird skeptic's urban legend.  Well, actually it comes right from the NOAA web page which describes how they maintain the USHCN data set.  Below is the key chart from that site showing the sum of all the plug factors and corrections they add to the raw USHCN measurements:
Ushcn_corrections
I hope you can see this significance.  Before we get into whether these measurements are right or wrong or accurate or guesses, it is very useful to understand that almost all the reported warming in the US over the last 70 years is attributable to the plug figures and corrections a few government scientists add to the data in the back room.  It kind of reduces one's confidence, does it not, in the basic conclusion about catastrophic warming? 

Anyway, lets look at the specific adjustments.  The lines in the chart below should add to the overall adjustment line in the chart above.
Ushcn_corrections2

  • Black line is a time of observation adjustment, adding about 0.3C since 1940
  • Light Blue line is a missing data adjustment that does not affect the data much since 1940
  • Red line is an adjustment for measurement technologies, adding about 0.05C since 1940
  • Yellow line is station location quality adjustment, adding about 0.2C since 1940
  • Purple line is an urban heat island adjustment, subtracting about 0.05C since 1950.

Let's take each of these in turn.  The time of observation adjustment is defined as follows:

The Time of Observation Bias (TOB) arises when the 24-hour daily
summary period at a station begins and ends at an hour other than local
midnight. When the summary period ends at an hour other than midnight,
monthly mean temperatures exhibit a systematic bias relative to the
local midnight standard

0.3C seems absurdly high for this adjustment, but I can't prove it.  However, if I understand the problem, a month might be picking up a few extra hours from the next month and losing a few hours to the previous month.  How is a few hour time shift really biasing a 720+ hour month by so large a number? I will look to see if I can find a study digging into this. 

I will skip over the missing data and measurement technology adjustments, since they are small.

The other two adjustments are fascinating.  The yellow line says that siting has improved on USHCN sites such that, since 1900, their locations average 0.2C cooler due to being near more grass and less asphalt today than in 1900. 

During this time, many sites were relocated from city locations to
airports and from roof tops to grassy areas. This often resulted in
cooler readings than were observed at the previous sites.

OK, without a bit of data, does that make a lick of sense?  Siting today in our modern world has GOT to be worse than it was in 1900 or even 1940.  In particular, the very short cable length of the newer MMTS sensors that are standard for USHCN temperature measurement guarantee that readings today are going to be close to buildings and paving.  Now, go to SurfaceStations.org and look at pictures of actual installations, or look at the couple of installations in the Phoenix area I have taken pictures of here.  Do these look more grassy and natural than measurement sites were likely to be in 1900?  Or go to Anthony Watts blog and scroll down his posts on horrible USHCN sites.

The fact is that not only is NOAA getting this correction wrong, but it probably has the SIGN wrong.  The NOAA has never conducted the site by site survey that we discussed above.  Their statement that locations are improving is basically a leap of faith, rather than a fact-based conclusion.  In fact, NOAA scientists who believe that global warming is a problem tend to overlay this bias on the correction process.  Note the quote above -- temperatures that don't increase as they expect are treated as an error to be corrected, rather than a measurement that disputes their hypothesis.

Finally, lets look the urban heat island adjustment.  The NOAA is claiming that the sum total of urban heat island effects on its network since 1900 is just 0.1C, and less than 0.05C since 1940.  We're are talking about the difference between a rural America with horses and dirt roads and a modern urban society with asphalt and air conditioning and cars.  This rediculously small adjustment reflects two biases among anthropogenic global warming advocates:  1)  That urban heat island effects are negligible and 2) That the USHCN network is all rural.  Both are absurd.  Study after study has show urban heat island effects as high as 6-10 degrees.  Just watch you local news if you live in a city --  you will see actual temperatures and forecasts lower by several degrees in the outlying areas than in the center of town.  As to the locations all being rural, you just have to go to surfacestations.org and see where these stations are.  Many of these sites might have been rural in 1940, but they have been engulfed by cities and towns since.

To illustrate both these points, lets take the case of the Tucson site I visited.  In 1900, Tucson was a dusty one-horse town (Arizona was not even a state yet).  In 1940, it was still pretty small.  Today, it is a city of over one million people and the USHCN station is dead in the center of town, located right on an asphalt parking lot.  The adjustment NOAA makes for all these changes?  Less than one degree.  I don't think this is fraud, but it is willful blindness.

So, let's play around with numbers.  Let's say that instead of a 0.2C site quality adjustment we instead used a -0.1C adjustment, which is still probably generous.  Let's assume that instead of a -0.05C urban adjustment we instead used -0.2C.  The resulting total adjustment from 1940 to date would be +0.05 and the total measurement temperature increase in the US would fall from 0.6C to 0.15C.  And this is without even changing the very large time of observation adjustment, and is using some pretty conservative assumptions on my part.  Wow!  This would put US warming more in the range of what satellite data would imply, and would make it virtually negligible. It means that the full amount of reported US warming may well be within the error bars for the measurement network and the correction factors.

While anthropogenic global warming enthusiasts are quick to analyze the reliability of any temperature measurement that shows lower global warming numbers (e.g. satellite), they have historically resisted calls to face up to the poor quality of surface temperature measurement and the arbitrariness of current surface temperature correction factors.  As the NOAA tellingly states:

The U.S. Historical Climatology Network (USHCN, Karl et al. 1990)
is a high-quality moderate sized data set of monthly averaged maximum,
minimum, and mean temperature and total monthly precipitation developed
to assist in the detection of regional climate change. The USHCN is
comprised of 1221 high-quality stations from the U.S. Cooperative
Observing Network within the 48 contiguous United States.

Does it sound defensive to anyone else when they use "high-quality" in both of the first two sentences?  Does anyone think this is high qualityOr this?  Or this?  Its time to better understand what this network as well as its limitations.

My 60-second climate skepticism argument is here.  The much longer paper explaining the breath of skeptic's issues with catastrophic man-made global warming is available for free here.

PS- This analysis focuses only on the US.  However, is there anyone out there who thinks that measurement in China and India and Russia and Africa is less bad?

UpdateThis pdf has an overview of urban heat islands, including this analysis showing the magnitude of the Phoenix nighttime UHI as well as the fact that this UHI has grown substantially over the last 30 years.

Uhi1

Update2: Steve McIntyre looks at temperature adjustments for a couple of California Stations.  In one case he finds a station that has not moves for over one hundred years getting an adjustment that implies a urban heat island reduction over the past 100 years.

Global Warming Book Comment Thread

I turned off comments on the published HTML version of my Skeptical Layman's Guide to Man-made Global Warming    (pdf here) to avoid spam problems.  However, it was not my intention to forgo the ability of readers to comment.  So I am going to link this comment thread from the bottom of each chapter.

I have gotten several comments back similar to what Steven Dutch says here:

So You Still Don't Believe In Global Warming?

Fine. Here's what you have to do....

  • Show conclusively that an increase in carbon dioxide will
    not result in global warming. Pointing to flaws in the climate models,
    possible alternative explanations, and unanswered questions won't cut it. We
    know carbon dioxide traps infrared and we know climate is
    getting warmer. There's a plausible cause and effect relationship there. You
    have to show there is
    not a causal link. You can do that either by
    identifying what
    is the cause ("might be" or "possible alternative"
    isn't good enough) or by showing that somehow extra carbon dioxide does

    not trap solar heat.

This might be correct if we were in a college debating society, where the question at hand was "does man contribute to global warming?"  However, we are in a real world policy debate, where the question is instead "Is man causing enough warming and thereby contributing to sufficiently dire consequences to justify massive interventions into the world economy, carrying enormous costs and demonstrable erosions in individual freedoms."  Remember, we know monetary and liberty costs of abatement with a fair amount of cerntainty, so in fact the burden of proof is on man-made global warming advocates, not skeptics, who need to prove the dangers from the man-made component of global warming outweigh the costs of these abatements.

That is why the premise for my paper is as follows:

There is no doubt that CO2 is a
greenhouse gas, and it is pretty clear that CO2 produced by man has an
incremental impact on warming the Earth's surface. 

However, recent
warming is the result of many natural and man-made factors, and it is
extraordinarily difficult to assign all the blame for current warming to
man. 

In turn, there are very good reasons to suspect that climate
modelers may be greatly exaggerating future warming due to man.  Poor
economic forecasting, faulty assumptions about past and current conditions, and
a belief that climate is driven by runaway positive feedback effects all
contribute to this exaggeration. 

As a result, warming due to man's
impacts over the next 100 years may well be closer to one degree C than the
forecasted six to eight.  In either case, since AGW supporters tend to grossly
underestimate the cost of CO2 abatement, particularly in lost wealth creation
in poorer nations, there are good arguments that a warmer but richer world,
where aggressive CO2 abatement is not pursued, may be the better end state than
a poor but cooler world.

Interventionists understand that their job is not to prove that man is causing some global warming, but to prove that man is doing enough damage to justify massive economic interventions.  That is why Al Gore says tornadoes are increasing when they are not, or why he says sea levels will rise 20 feet when even the IPCC says a foot and a half.  And I will leave you with this quote
from National Center for Atmospheric Research (NOAA) climate researcher and
global warming action promoter, Steven Schneider:

We have to
offer up scary scenarios, make simplified, dramatic statements, and make little
mention of any doubts we have. Each of us has to decide what the right balance
is between being effective and being honest.

Comment away.  I don't edit or delete comments, except in the cases of obvious spam.

Update:  Here is another reason why there is an important difference between "man causes any warming at all" and "man causes most of the warming."

Nothing Sinister Here. Move Along.

A while back, I discussed an effort by Anthony Watts to create a pictorial data base of the US Historical Climate Network, the 1000 or so temperature and weather sensors whose data are used in historical climate numbers, including IPCC and NOAA and GISS global warming data bases. 

Already, this effort has identified numerous egregious installations that call into question the quality of historical temperature measurement.  Note here and here and here and here.  The whole data base is at SurfaceStations.org and my humble contributions are here and here.  Was 2006 the second warmest of all time, or did 2006 have the most hot exhaust blowing on measurement instruments?

Roger Pielke, a climate scientist in Colorado, reports on an odd response by the NOAA to this effort:

Recently, Anthony Watts has established a website [www.surfacestations.org] to record these photographs. He has worked to assure that the photographs are obtained appropriately.

As a result of this effort, NOAA has removed location information
from their website as to where they are located. This information has
been available there for years.

There are a few USHCN stations at people's homes, so in some cases there may be privacy concerns, but most all of the ones I have seen are at public locations, from fire houses to ranger stations to water plants.  Pielke offers up a logical solution for where there are privacy issues:

"over 4 years ago there was a big push in the Cooperative Observer
program to make sure that all 7000+ sites across the country were
photodocumented. All 120 Data Acquisition Programs were equipped with
high quality digital cameras. Most took photos. However, at the higher
levels where they were developing the upload and archive system for the
photos the issue of observer privacy was raised and as best we can tell
the result was that those photos were not archived and certainly are
not available."

This is a very disturbing development, as individuals in NOAA's
leadership have used their authority to prevent the scientific
community and the public access to critical information that is being
used as part of establishing climate and energy policy in the United
States.

The solution to this issue is, of course, straightforward. Either
make the photographs where datasets are being used in research (i.e.
the HCN sites), available, or permit others to take them. Privacy
rules, such as not publishing the names and addresses of the observers,
should be made, however, the photographs themselves, viewing the site,
and views in the four orthogonal directions must be public. Volunteers
who are HCN Cooperative Observers need to either grant this permission
or not volunteer.

If you observe the state of climate science at all, you will know that any measurement (e.g. satellite or radiosonde temperature measurements) that conflict even the slightest with the main story line of anthropogenic global warming are subjected to intense and withering scrutiny.  Even the tiniest source of error or methodological sloppiness in these conflicting data sets cause global warming zealots to throw out the data as flawed.  It is instructive that perhaps the sloppiest data set of all is the surface climate measurement system they use primarily to support their case, and it is one they show absolutely no interest in scrutinizing, or letting anyone else scrutinize.

The 800-Year Lag

Until I watched the Global Warming Swindle, I had confined my criticisms of anthropogenic global warming theory to two general areas:  1)  The models for future warming are overstated and 2) The costs of warming may not justify the costs of preventing it.

The movie offered an alternate hypothesis about global warming and climate change that, rather than refute the magnitude of anthropogenic global warming, provided a counter hypothesis.  You should watch the movie, but the counter hypothesis is that historic temperature changes have been the result of variations in solar activity.  Rather than causing these changes, increased atmospheric CO2 levels resulted from these temperature increases, as rising ocean temperatures caused CO2 to be driven out of solution from the world's oceans.

I thought one of the more compelling charts from Al Gore's pPwerpoint deck, which made the movie An Invconvienent Truth, was the hundred thousand year close relationship between atmospheric CO2 levels and global temperature, as discovered in ice core analysis.  The Swindle movie, however, claims that Gore is hiding something from that analysis in the scale of his chart -- that the same ice core analyses show that global temperature changes have led CO2 concentration changes by as much as 800 years.  (short 2-minute snippet of this part of the movie here, highly recommended).

Well, this would certainly be something important to sort out.  I have not done much real science since my physics days at Princeton, but my sense is that, except maybe at the quantum level, when B follows A it is hard to argue that B caused A.

So I have poked around a bit to see -- is this really what the ice core data shows, or is Swindle just making up facts or taking facts out of context ala the truther hypotheses about 9/11?  Well, it turns out that everyone, even the die-hard global warming supporters, accept this 800-year lag as correct (Watch the Al Gore clip above -- it is clear he knows. You can tell by the very careful way he describes the relationship).  LuboÃ…¡ Motl summarizes in his blog:

However, the most popular - and the most straightforward - explanation
of the direction of the causal relationship is the fact that in all
cases, the CO2 concentration only changed its trend roughly 800 years
after temperature had done the same thing. There have been many papers
that showed this fact and incidentally, no one seems to disagree with
it....

The whole "group" at RealClimate.ORG
[ed: one of the leading sites promoting the anthropogenic theory] has agreed that there was a lag. But they say that in the first 800
years when the influence of temperature on CO2 is manifest, it was
indeed temperature that drove the gases. But in the remaining 4200
years of the trend, it was surely the other way around: CO2 escalated
the warming, they say.

Frequent readers will know that I have criticized forward looking climate models on many occasions for being too reliant on positive feedback processes.  For example, in the most recent IPCC models, over 2/3 of future warming come not from CO2 but from various positive feedback effects (section 8.6 of the 2007 report). 

The folks at RealClimate.org are similarly positing a positive feedback mechanism in the past -- "something" causes initial warming, which drives CO2 to outgas from the oceans, which causes more warming, etc. 

I am not sure I have ever done so, so let me take a minute to discuss positive feedbacks.  This is something I know a fair amount about, since my specialization at school in mechanical engineering was in control theory and feedback processes.  Negative feedback means that when you disturb an object or system in some way, forces tend to counteract this disturbance.  Positive feedback means that the forces at work tend to reinforce or magnify a disturbance.

You can think of negative feedback as a ball sitting in the bottom of a bowl.  Flick the ball in any direction, and the sides of the bowl, gravity, and friction will tend to bring the ball back to rest in the center of the bowl.  Positive feedback is a ball balanced on the pointy tip of a mountain.  Flick the ball, and it will start rolling faster and faster down the mountain, and end up a long way away from where it started with only a small initial flick.

Almost every process you can think of in nature operates by negative feedback.  Roll a ball, and eventually friction and wind resistance bring it to a stop (except, apparently, on the greens at Augusta).  There is a good reason for this.  Positive feedback breeds instability, and processes that operate by positive feedback are dangerous, and usually end up in extreme states.  These processes tend to "run away."   I can illustrate this with an example:  Nuclear fission is a positive feedback process.  A high energy neutron causes the fission reaction, which produces multiple high energy neutrons that can cause more fission.  It is a runaway process, it is dangerous and unstable.  We should be happy there are not more positive feedback processes on our planet.

Since negative feedback processes are much more common, and since positive feedback processes almost never yield a stable system, scientists assume that processes they meet are negative feedback until proven otherwise.  Except in climate, it seems, where everyone assumes positive feedback is common.

Back to the climate question.  The anthropogenic guys are saying that when the earth heated, it caused CO2 to outgas from the oceans, which in turn caused more warming, which causes more outgassing, etc.  But where does it stop?  If this is really how things work, why isn't the Earth more like Venus?  If you are going to posit such a runaway process, you have to also posit what stops it.  So far, the only thing I can think of is that the process would stop when the all bands of light that are absorbable by CO2 are fully saturated.

But the feedback is worse than this.  I won't go into it now, but as you can see from this post, or from section 8.6 of the 2007 IPCC report, the current climate models assume that warming from CO2 itself yields further positive feedback effects (e.g. more humidity) that further accelerate warming, acting as a multiplier as great as 3-times on CO2 effects alone.

So here is the RealClimate view of the world:  Any small warming from some outside source (think Mr. Sun) is accelerated by outgassing CO2 which is in turn accelerated by these other effects in their climate models.  In other words, global temperature is a ball sitting perched on the top of a mountain, and the smallest nudge causes it to accelerate away.  This is the point at which, despite having only limited knowledge about the climate, I have to call bullshit!  There is just no way our planet's climate could be as stable as it has been long-term and be built on such positive feedback loops.  No way.  Either these folks are over-estimating the positive feedback or ignoring negative feedbacks or both.  (and yes, I know we have had ice ages and such but against the backdrop of the range of temperatures the Earth theoretically could have in different situations, our climate variation has been small).

Postscript:  The other day I mentioned that it was funny a group studying solar output felt the need to put in a statement validating anthropogenic global warming despite the fact that nothing in their research said any such thing.  Motl points to a similar thing in the ice core studies:

Well, the website tells us that the paper that reported the lag contained the following sentence:

  • ...
    is still in full agreement with the idea that CO2 plays, through its
    greenhouse effect, a key role in amplifying the initial orbital forcing
    ...

Again, this statement was included despite the fact that their study pretty clearly refutes some key premises in anthropogenic global warming theory.  It's become a phrase like "no animal was hurt in the filming of this movie" that you have to append to every climate study.  Or, probably a better analogy, it is like Copernicus spending a few chapters assuring everyone he still believes in God and the Bible before he lays out his heliocentric view of the solar system. 

Update: All this is not to say that there are not positive feedback loops in climate.  Ice albedo is probably one -- as temperatures rise, ice melts and less sunlight is reflected back into space by the ice so the world warms more.  My point is that it does not make any sense to say that positive feedback processes dominate.

Correction: Like a moron, I have been using anthropomorphic rather than anthropogenic to refer to man-made climate effects.  Oops.  Thanks to my reader who corrected me.  I have fixed this article but am too lazy to go back and edit the past.

Further Update:  The irony of my correction above juxtaposed against the title of the previous post is not lost on me.

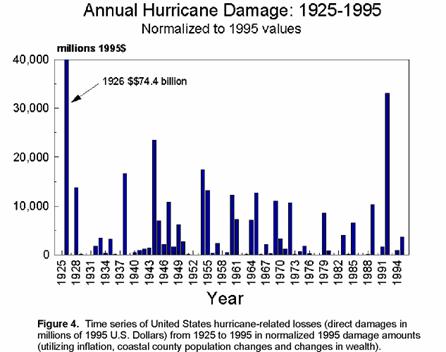
Update to the Postscript: Oh my god, here it is again.  An NOAA-funded study comes to the conclusion that global warming might actually reduce hurricane strength and frequency.  Nowhere in the study did the researchers touch any topic related to anthropogenic warming -- they just studied what might happen to hurricanes if the world warms for any reason.  But here is that disclaimer again:

"This study does not, in any way, undermine the widespread consensus in the scientific community about the reality of global warming," said co-author Brian Soden, Rosenstiel School associate professor of meteorology and physical oceanography whose research is partly funded by NOAA.

Does the NOAA and other funding bodies actually require that this boilerplate be added to every study?

Oh My God, We're All Going to Die

Headline from the Canadian, via Hit and Run:

"Over 4.5 Billion people could die from Global Warming-related causes by 2012"

In case you are struggling with the math, that means that they believe Global Warming could kill three quarters of the world's population in the next five years.  And the media treats these people with total respect, and we skeptics are considered loony?  It appears that the editors of the Canadian have taken NOAA climate research Steven Schneider at his word:

We have to offer up scary scenarios, make simplified, dramatic statements,
and make little mention of any doubts we have. Each of us has to decide what
the right balance is between being effective and being honest.

However, this example is a very good one to again raise the issue of the skeptical middle ground on climate. 

The methane hydrate disaster case in this article may be extreme, but it is consistent in certain ways with the current climate theories of those who advocate various extreme warming scenarios that require massive government intervention (i.e. every climate study that the media chooses to report on).  To oversimplify a bit, their warming models work in two parts:

  1. Man-made CO2 builds up in the atmosphere and acts to absorb more solar energy in the atmosphere than a similar atmospheric gas mix with less CO2 would.  Most climate scientists agree that since CO2 only absorbs selected wavelengths, this a diminishing-return type effect.  In other words, the second 10% increase in CO2 concentrations in the atmosphere has a smaller impact on global temperatures than the first 10%, and so on.  Eventually, this effect becomes "saturated" such that all the wavelengths of sunlight that are going to be absorbed are absorbed, and further increases in CO2 concentration will have no further effect on world temperatures.  No one knows where this saturation point is, but it might be as low as plus 2 degrees C, meaning the most we could raise global temperatures (without effects in part 2 below) is less than 2 degrees (assuming we have already seen some of this rise).  By the way, though I think what I have just said fits the climate scientists' current "consensus,"  nothing in the italics part ever seems to get printed in the media.
  2. As temperatures rise worldwide due to warming from man-made CO2, other things in the climate will change.  Hotter weather may cause more humidity from vaporized water, or more cloud cover, from the same effect.  As posited in the article linked above, some methane hydrates in ice or in the ocean might vaporize due to higher temperatures.  More plants or algae might grow in certain areas, less in others.  All of these secondary effects might in turn further effect the global temperature.  For example, more cloud cover might act to counter-act warming and cool things off.  In turn, vaporizing methane hydrates would put more greenhouse gasses in the air that could accelerate warming.

    Scientists typically call these secondary reactions feedback loops.  Feedbacks that tend to counteract the initial direction of the process (e.g. warming creates clouds which then reduce warming) are called negative feedbacks.  Feedbacks that tend to accelerate the process (warming vaporizes methane which causes more warming) are positive feedbacks.  Negative feedback is a ball at the bottom of a valley that rolls back to its starting point when you nudge it; positive feedback is a ball perched on top of a mountain, where one slight nudge causes it to roll downhill faster and faster.   Most natural processes are negative feedbacks -- otherwise nothing would be stable.  In fact, while positive feedback processes are not unknown in nature, they are rare enough that most non-scientists would be hard-pressed to name one.  The best one I can think of is nuclear fission and fusion, which should give you an idea of what happens when nature gets rolling on a positive feedback loop and why we wouldn't be around if there were many such processes.

    So it is interesting that nearly every climate model that you hear of in the press assumes that the secondary effects from CO2-based warming are almost all positive, rather than negative feedbacks.  Scientists, in a competition to see who can come up with the most dire model, have dreamed up numerous positive feedback effects and have mostly ignored any possible negative feedbacks.  In other words, most climate scientists are currently hypothesizing that the world's climate is different from nearly every other natural process we know of and is one of the very very few runaway positive feedback processes in nature.

I want to offer up a couple of observations based on this state of affairs:

  • Climate science is very hard and very chaotic, so there is nothing we really know with certainty.  However, we have a far, far, far better understanding of #1 above than #2.  In fact, models based just on effect #1 (without any feedbacks) do a decent job of explaining history (though they still overestimate actual warming some).  However, models based on adding the positive feedback processes in #2 fail miserably at modeling history.  (Several scientists have claimed to have "fixed" this by incorporating fudge factors, a practice many model-based financial market speculators have been bankrupted by).  We have no real evidence yet to support any of the positive feedbacks, or even to support the hypothesis that the feedback is in fact positive rather than negative.  I had a professor once who liked to make the lame joke that it was a bad "sign" if you did not even know if an effect was positive or negative.
  • Because global warming advocates are much more comfortable arguing #1 than #2, they like to paint skeptics as all denying #1.  This makes for a great straw man that is easy to beat, and is aided by the fact that there is a true minority who doesn't believe #1  (and who, despite everything that is written, have every right to continue to express that opinion without fear of reprisal).  Actually, even better, they like to avoid defending their position at all and just argue that all skeptics are funded by Exxon.
  • However, it is step #2 that is the key, and that we should be arguing about.  Though the most extreme enviro-socialists just want to shut down growth and take over the world economy at any cost, most folks recognize that slowing warming with current technology represents a real trade-off between economic growth and CO2 output.  And, most people recognize that reducing economic growth might be survivable in the rich countries like the US, but for countries like India and China, which are just starting to develop, slowing growth means locking hundreds of millions into poverty they finally have a chance to escape.

    I am going to simplify this, but I think the following statement is pretty close:  The warming from #1 alone (CO2 without positive feedbacks) will not be enough to justify the really harsh actions that would slow CO2 output enough to have any effect at all;  only with substantial positive feedbacks from #2, such that the warming from CO2 alone is tripled, quadrupled or more (e.g. 8 degrees rather than 2) are warming forecasts dire enough to warrant substantial activity today.

So that is why I am a skeptic.  I believe #1, though I know there are also things other than manmade CO2 causing some of the current warming (e.g. the sun's output is higher today than it has been in centuries).  I do not think anyone has completed any really convincing work on #2, and Occam's razor tends to make me suspicious of hypothesizing positive feedback loops without evidence (since they are so much more rare than negative ones).

More on the skeptical middle ground hereDiscussion of things like the "hockey stick" is here.  For a small insight into how global warming advocates are knowingly exaggerating their case, see the footnote to this post.

Update:  Increasingly, folks seem to want to equate "skeptic" with "denier."  If so, I will have to change my terminology.  However, that would be sad, as "skeptic" is a pretty good word.  I accept there is some CO2 caused warming, but I am skeptical that the warming and its effects are as bad as folks like Al Gore make it out to be, and I am skeptical that the costs of an immediate lock-down on CO2 production will outweigh the benefits.  That is why I call myself a skeptic.  If that is now a bad term, someone needs to suggest a new one.