Archive for August 2007

Why I Blog

I had a call today from a reporter at the Christian Science Monitor who wanted to discuss climate skepticism.  What a disaster of an interview I am!  He would ask an open-ended question, and off I would go into feedback theory and then to acoustics and then into helicopter dynamics and back to the ice age and then to temperature measurement in Tucson.  I try to follow 6 trains of thought simultaneously and the result is a mess. 

The poor reporter was quite friendly and ended with "I am not sure where we are going with this story" which is the universal reporter speak for "your interview was such a mess I am not sure how we would ever use it."  LOL.  Only by writing, with the implicit governor applied by the keyboard, am I able to organize my thoughts well.  Which is why I have never invested in a computer dictation product - I shudder to think what I would find on the page after a session.  Which reminds me of the early Doonesbury cartoons with Duke when he was a reporter at the Rolling Stone, when he would come into the his editor's office and claim to have dictated some really powerful stuff, only to find a garbled drug-induced mess, which was obviously a reference to Hunter S. Thompson, who... oh crap, I'm doing it again.

On the Virtues of the Modern Economy

Best thing I have read in a long time:

Imagine an egalitarian world in which all food is organic and local,
the air is free of industrial pollution, and vigorous physical exertion
is guaranteed. Sound idyllic?

But hold on"¦ Life expectancy is 30 at most; many children die at or
soon after birth; life is constantly lived on the edge of starvation;
there are no doctors or dentists or modern toilets. If it is
egalitarian it is because everyone is dirt poor, and there is no
industrial pollution because there are no factories. Food is organic
because there are no pesticides or high technology farming methods. As
a result, producing food means long hours of back-breaking physical
work which may end up yielding little.

There is "“ or at least was "“ such a
place. It is called the past. And few of us, it seems, recognise the
enormous benefits to humanity of escaping from it. On the contrary,
there is a pervasive culture of complaint about the perils of affluence
and a common tendency to romanticise the simple life.

Via Hit and Run.  I made a fairly similar point here when I compared California "robber baron" Mark Hopkins mid-19th century house to one a friend of mine used to own in Seattle:

One house has hot and cold running water, central air conditioning,
electricity and flush toilets.  The other does not.  One owner has a a
computer, a high speed connection to the Internet, a DVD player with a
movie collection, and several television sets.  The other has none of
these things.  One owner has a refrigerator, a vacuum cleaner, a
toaster oven, an iPod, an alarm clock that plays music in the morning,
a coffee maker, and a decent car.  The other has none of these.  One
owner has ice cubes for his lemonade, while the other has to drink his
warm in the summer time.  One owner can pick up the telephone and do
business with anyone in the world, while the other had to travel by
train and ship for days (or weeks) to conduct business in real time.

Why the NASA Temperture Adjustments Matter

NASA's GISS was recently forced to restate its historical temperature database for the US when Steve McIntyre (climate gadfly) found discontinuities in the data that seemed to imply a processing error.  Which indeed turned out to be the case (store here).

The importance of this is NOT the actual change to the measurements, though it was substantial.  The importance, which the media reporting on this has entirely missed, is it highlights why NASA and other government-funded climate scientists have got to release their detailed methodologies and software for scrutiny.  The adjustments they are making to historical temperatures are often larger(!) than the measured historical warming (here, here, here) so the adjustment methodology is critical. 

This post from Steve McIntyre really shows how hard government-funded climate scientists like James Hansen are working to avoid scientific scrutiny.  Note the contortions and detective work McIntyre and his readers must go through to try to back into what NASA and Hansen are actually doing.  Read in this context, you should be offended by this article.  Here is an excerpt (don't worry if you can't follow the particular discussion, just get a sense of how hard NASA is making it to replicate their adjustment process):

If I average the data so adjusted, I get the NASA-combined version
up to rounding of 0.05 deg C. Why these particular values are chosen is
a mystery to say the least. Version 1 runs on average a little warmer
than version 0 where they diverge ( and they are identical after 1980).
So why version 0 is adjusted down more than version 1 is hard to figure
out.

Why is version 2 adjusted down prior to 1990 and not after? Again
it's hard to figure out. I'm wondering whether there isn't another
problem in splicing versions as with the USHCN data. One big version of
Hansen's data was put together for Hansen and Lebedeff 1987 and the
next publication was Hansen et al 1999 - maybe different versions got
involved. But that's just a guess. It could be almost anything....It would be interesting to check their source code and see how they get this adjustment, that's for sure.

A basic tenant of science is that you publish enough information such that others can replicate your work.  Hansen and NASA are not doing this, which is all the more insane given that we as taxpayers pay for their work.

Hansen cites the fact that Phil Jones gets somewhat similar results as
evidence of the validity of his calculations. In fairness to Hansen,
while they have not archived code, they have archived enough data
versions to at least get a foothold on what they are doing. In
contrast, Phil Jones at CRU maintains lockdown anti-terrorist security
on his data versions and has even refused FOI requests for his data.
None of these sorts of analyses are possible on CRU data, which may or
may not have problems of its own.

Poverty Ain't What it Used to Be

The Heritage Foundation has an interesting study out on the population that lives below the poverty line.  While we typically get lots of headlines like "A million more people in poverty,"  the real headline should be "Poverty ain't what it used to be."  Create a mental image for yourself about poverty then read the first part of the article.

I won't repeat the studies points -- you can read them at the link or you have probably seen the study already linked around the blogosphere (e.g. Captains Quarters, Cato-at-Liberty, Reason, Maggie's Farm).  Reading the descriptions, its clear that most of our visual images and assumptions about US "poverty" don't line up well with this list.   This is by design.  Progressives who want more transfer payments and more government interventionism work hard to create a stark mental image of poverty through anecdotes, and then try to apply that mental image to a much larger population based on a very different definition of poverty than in this mental image. 

However, this approach may be set to backfire.  By defining poverty broadly to try to pump up the numbers, they are at risk of people losing sympathy for the poor.  I can see the progressive reaction now -- they are going to say (correctly) that buried in these numbers are a hard core of people who are really destitute.  And they are correct.  But they only have themselves to blame for burying these folks in a larger group whose lives don't match our mental picture of poverty.  And the poverty numbers aren't the only place where this approach is taken. 

I am sure you have heard the commercials that say something like one in six kids in America are hungry.  It's a crock.  There are at most perhaps 2-3 million people in this country who are really destitute.  The Census department found that only 6% of the people below the poverty line, about 2 million people, reported they sometimes did not have enough food to eat.  Sure, that sucks.  Which is why I volunteer with my kids at the local food bank.  But it's way, way short of the numbers activists try to use to justify huge new government programs and transfers.

Other thoughts

One issue not discussed, but covered in other studies, is the transience of people in the bottom quintile of income.  Most of us imagine the same people in poverty survey after survey, and again that is probably true for the hard core of 2-3 million.  But many of the rest move out of poverty over time.  In particular, we have had a huge influx of immigrants (legal and illegal) over the last several decades.  These folks are all counted in the poverty numbers.  Many immigrants arrive below the poverty line, and then work their way out of it. 

In a related post, Brad DeLong looks at what life was like even for the well off in 1900, and one can easily come to the conclusion that being poor today might be better than well off in 1900.  I made a similar point in this post, when I compared the life of the very rich in 1850 to the middle class today.  All of this is empirical proof that wealth is not zero-sum, as assumed by progressives, but is created and expends.  My post of the zero-sum wealth fallacy is here.

I've made the point for a long time that our poor are better off than the middle class in most countries of the world.  This living space comparison is an example - our poor typically have more living space in their homes than the middle class in Europe, or the well-to-do in many other countries.  But there is always that issue of income inequality that is raised, to which I typically answer "so what?"  If the poor are better off in the US, does it matter if the rich are really, really better off?  Note sometime the language that is always used in income inequality discussions.  You will hear folks talking about the "share of total income" as if income is a spring bubbling up in the desert, spewing a fixed amount of wealth, and the rich are the piggy folks up front getting more than their fair share of this limited resource. 

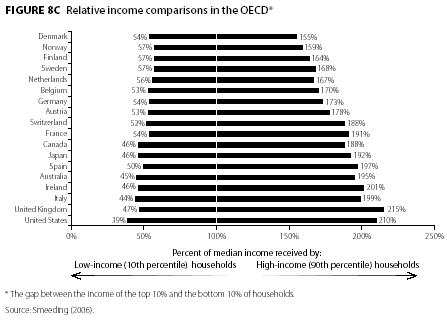
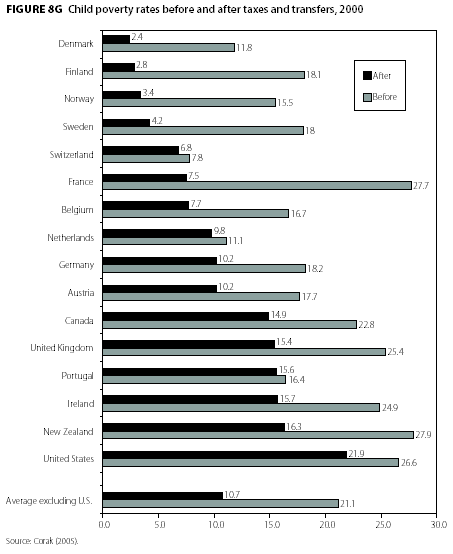
Leftish studies love to show how the US economic model is so much more heartless than those wonderful Europeans.   Below is a typical chart they use, and it will bring us full circle to our original point about measuring poverty.

Study1

Wow, those heartless damn Americans!  Letting those children suffer.  But wait, we talked earlier about definitions of poverty - how do they define poverty here?  It turns out that poverty is defined as income 50% or less of the median income in that country.  Yes, you heard that right -- the standard for poverty changes country to country.  So the US has the worst results here because in large part, since it has the highest median income of any country in this survey, it has been given the highest poverty line.  Of COURSE we will have higher poverty numbers if you give us a higher poverty bar.  The honest way to do this study would be to set an absolute poverty line and apply it to each country on a purchasing power parity basis.  But of course, the progressives would not like the results of such an honest study.

BUT, someone in this study made a mistake -- they should lose their socialist decoder card for this.  Because in a fit of honesty, they actually restated one of their charts on a relatively fair basis.  Here is the original income equality chart:
Study3

You get the point, the US sucks as always -- our poor are the poorest.  But are they?  Again, the standard in each line is the median income of that country, so it is a changing standard in each case.  But what if we restated it all to a common dollar amount.  This is where the progressives fell into a fit of honesty.  They restated this chart so that every bar is a percentage of the US median income.

Study2

Now we see the real story - except for Norway and Switzerland, our poorest folks are about on par with those in other western countries, and this is WITHOUT the crushing burden of welfare state regulation and taxation.  Further, the poor in the US are much more mobile than those in other country -- the ranks of our poor will have turned over much more than any of these other countries in 10 years.  Finally, my bet is that if you did this chart without recent immigrants, the US poor would best most every country in Europe in terms of income -- US has a lot of immigration and it is disproportionately poor vs. immigration into other European countries (note that most poverty numbers include illegal immigrants, but most official immigration numbers do not include illegal immigrants).

So, if our poor are doing just as well, then I leave it as an exercise to give any rational reason why the fact that our rich are doing much better matters one damn bit.

Contributing to Science, Follow-up

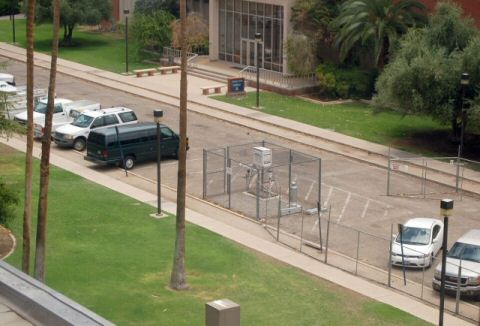
My photo survey of the Tucson USHCN climate station is still creating a lot of discussion.  Discussion, for example, is here, here, and here.

And you too can have the satisfaction of contributing to science.  All
you need is a camera (a GPS of some sort is also helpful).  I wrote a
post with instructions on how to find temperature stations near you and how to document them for science here.  Believe it or not, for all the work and money spent on global warming,
this is something that no one had done -- actually go document these
sites to check their quality and potential biases.

Mindless Rules Enforcement

So where do government bureaucrats go to learn how to push the frontiers of mindless rules enforcement?   Well, there are certain enclaves of the private sector who are pretty good at strict enforcement of silly rules -- The RIAA comes to mind.  But where do leading brain-dead bureaucracies, like say, school boards, learn to push the frontiers of pettiness?  Perhaps the NCAA can help out:

Just hours after Oklahoma football recruit Herman Mitchell was shot to
death Friday in Houston, Adam Fineberg started raising money for
Mitchell's family.

But after raising $4,500, enough to cover almost half the cost of
Mitchell's funeral, Fineberg stopped. An OU compliance officer told him
his actions would constitute an NCAA rules violation against the
Sooners.

Now, Mitchell's mother likely will never receive that money.

That money is considered illegal financial assistance under NCAA
rules because Mitchell's brother is a sophomore fullback at Westfield
High School in Spring, Texas, and because Fineberg is an OU fan who
attends Sooner football games and solicited donations through an OU fan
Web site. [. . .]

OU spokesman Kenny Mossman said the an official with the
university's compliance office contacted Fineberg on Monday asking to
him halt his fundraising efforts until the OU received a rules
interpretation from the NCAA. That interpretation came Tuesday.

"This is not a permissible expense for OU or someone who could be
construed as an OU supporter," said Mossman, an associate athletic
director for communications. "We're not trying to be the bad guys, but
we have to play by their rules."

Because it's still a recruiting violation, even if the recruit is dead.  The NCAA said the college could apply for a waiver.  They shouldn't even have to -- the NCAA's reaction should have been to issue a waiver without even being asked.  This should have taken a conference call among the key decision-makers about 8 seconds to decide.

Update:  I may have been wrong by putting the NCAA over school boards, as a Colorado Springs school board has banned playing tag.  So I guess smear the queer is out (we actually called it Kill the Man with the Ball, but I am told that Smear the Queer is the more common and even less politically correct name).

Recognition, Cool

Coyote Blog made another list of top economics blogs.  Awesome.  Also #23 here.

Official Arbiter of Language

This, via Reason, is interesting in the context of my post last week on English being a bottom-up language without an official government arbiter (emphasis added):

To the consternation of some nickname purists, children
are being given such offbeat English-language nicknames as Mafia or
Seven "” as in 7-Eleven, the convenience store.

With help from
language experts at the Royal Institute, the official arbiter of the
Thai language
, Mr. Vira plans to produce by the end of the year a
collection of thousands of old-fashioned nicknames, listed by such
wholesome categories as colors, animals and fruit and including simple
favorites like Yaay (big), Ouan (fat) and Dam (black).

Korakoad
Wongsinchai, an English teacher at a private primary school in Bangkok,
is also not sure whether the Culture Ministry's campaign will stem the
tide of English names...More than half of her students have English
names, she said, offering this sampling: Tomcruise, Elizabeth, Army,
Kiwi, Charlie and God.

OK, Maybe I Was Serious

A while back I suggested, part tongue-in-cheek:

Once trees hit their maturity, their growth slows and therefore the
rate they sequester CO2 slows.  At this point, we need to be cutting
more down, not less, and burying them in the ground, either as logs or
paper or whatever.  Just growing forests is not enough, because old
trees fall over and rot and give up their carbon as CO2.  We have to
bury them.   Right?

Now, Greenpeace co-founder Patrick Moore writes:

There is a misconception that cutting down an old tree will result
in a net release of carbon. Yet wooden furniture made in the
Elizabethan era still holds the carbon fixed hundreds of years ago.

Berman,
a veteran of the forestry protest movement, should by now have learned
that young forests outperform old growth in carbon sequestration.

Although
old trees contain huge amounts of carbon, their rate of sequestration
has slowed to a near halt. A young tree, although it contains little
fixed carbon, pulls CO2 from the atmosphere at a much faster rate.

When a tree rots or burns, the carbon contained in the wood is released back to the atmosphere....

To address climate change, we must use more wood, not less. Using wood
sends a signal to the marketplace to grow more trees and to produce
more wood. That means we can then use less concrete, steel and plastic
-- heavy carbon emitters through their production. Trees are the only
abundant, biodegradable and renewable global resource.

Ask a Question, Get an Answer

A while back, I wondered if the highest paid public employee of every state was a university men's football or basketball coach.  Well, its not exactly answering the same question, but via the Sports Economist comes this article that head coaches beat the governors 49-1 in the salary sweepstakes.  Only the Alaska governor makes more money than the state university head coaches (probably because there is no college football in Alaska).  Governors probably have more job security, though.

Unlike my question, the author considers coaches at any college, public or private.  For example, my readers found that NY is probably an exception -- there are public employees paid higher than public university coaches.  This article comes to the opposite conclusion, but only because they use Syracuse University, which is a private institution.

On Subprime and Payday Loans

I haven't had much to say about mortgage markets, mainly because what is going on is so obvious and straight-forward I wouldn't have thought it needed comment.  Even smart financial people get caught up in speculative bubbles, as was demonstrated in the late 1990's when they put money into some really dumb Internet investments.  New credit products can be difficult to price, since much of the costs come after the initial sales are made (in the form of defaults).  So some companies mispriced a new product, some others got caught up in a speculative bubble, same-old same-old.  This too will pass ... unless of course the government does something really stupid like bail some of these guys out, and then it will happen over and over again because no one will have an incentive to change their behavior.

I am afraid I also don't have tons of sympathy for the borrowers.  By definition, since most of these subprime loans were little or nothing down, folks are not losing their life-savings and equity, because they didn't have any equity.  They are being forced to move out of their house in the same way a tenant might if he couldn't make his rent payments, except in this case the "rent" was tax-deductable.  I do feel some sympathy for consumer borrowers who were enticed into borrowing against their home rather than through some sort of consumer loan, thus endangering their house to buy that big screen TV.  But who did the enticing - wasn't it the government, who provides a huge subsidy for home equity lending (via the mortgage interest deductibility on income taxes) versus other forms of borrowing?

But here is the amazing thing to me:  the same politicians who demagogue payday loan companies for providing loans that are too expensive can simultaneously demagogue subprime lenders for loans that were too cheap.  They criticize the same banks now for being too free with credit to the poor that they have criticized for years (via redlining suits and such) for being too stingy with credit to the poor. 

It's almost as if politicians don't really care what lenders are doing, they just want to find an excuse to get a few sound-bites on the local news back in their district and issue some legislation to expand federal power in the banking industry.

Problems With Catastrophic Global Warming Shown in Two Charts

OK, I understand that perhaps my worst flaw in trying to make a point is in being too loquacious.  In a previous post, I showed why estimates of climate catastrophe were overblown by using the earth's experience over the last 100 years as an empirical guide.  Today, I shall try to make the same point with fewer words and just two charts instead.

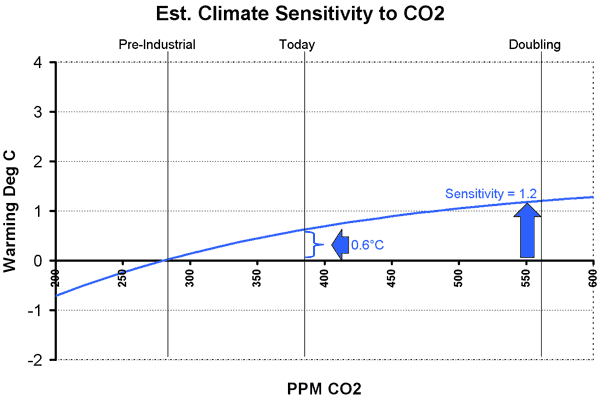
Scientists have a concept called climate sensitivity which refers to the amount of global warming in degrees Celsius we might expect from a doubling of CO2 concentrations from a pre-industrial 280ppm to 560ppm  (we are currently at about 380ppm today and will reach 560ppm between 2065 and 2100, depending on how aggressive a forecast you want to adopt).

A simple way to estimate sensitivity is from experience over the past century.  At the same time CO2 has gone up by 100ppm, global temperatures have gone up by at most 0.6 Celsius (from the 4th IPCC report).  I actually believe this number is over-stated due to uncorrected urban effects and other surface temperature measurement issues, but let's assume 0.6ºC.  Only a part of that 0.6ºC is due to man - some is likely do to natural cyclical effects, but again to avoid argument, let's assume man's CO2 has heated the earth 0.6 Celsius.  From these data points, we can project forward:

Sensitivity1

As you can see, the projection is actually a diminishing curve.  For reasons I will not go into again (you can read much more in my original post) this relationship HAS to be a diminishing curve.  It's a fact accepted by everyone.  True climate consensus.  We can argue about the slope and exact shape, but I have chosen midpoint values from a reasonable range.  The answer is not that sensitive to different assumptions anyway.  Even a linear extrapolation, which is clearly wrong scientifically, would only yield a sensitivity projection a few tenths of a degree higher.

What we arrive at is a sensitivity of about 1.2 degrees Celsius for a CO2 doubling (where the blue line crosses 560ppm).  In other words, we can expect another 0.6ºC increase over the next century, about the same amount we experienced (and most of us failed to notice) over the last century.

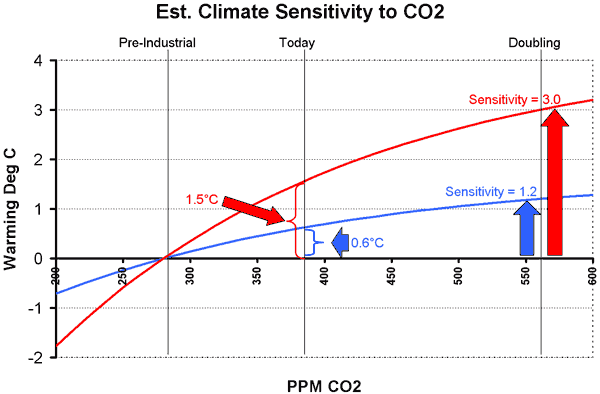
But, you are saying, global warming catastrophists get so much higher numbers.  Yes they do, with warming as high as 9-10C in the next century.  In fact, most global warming catastrophists believe the climate sensitivity is at least 3ºC per doubling, and many use estimates as high as 5ºC or 6ºC.  Do these numbers make sense?  Well, let's draw the same curve for a sensitivity of 3ºC, the low end of the catastrophists' estimates, this time in red:

Sensitivity2

To get a sensitivity of 3.0ºC, one has to assume that global warming due solely to man's CO2 (nothing else) would have to be 1.5ºC to date (where the red line intersects the current concentration of 380ppm).  But no one, not the IPCC or anyone else, believes measured past warming has been anywhere near this high.  So to believe the catastrophic man-made global warming case, you have to accept a sensitivity three or more times higher than historical empirical data would support.  Rather than fighting against climate consensus, which is how we are so often portrayed, skeptics in fact have history and empirical data on our side.  For me, this second chart is the smoking gun of climate skepticism.  We have a lot of other issues -- measurement biases, problems with historical reconstructions, role of the sun, etc -- but this chart highlights the central problem -- that catastrophic warming forecasts make no sense based on the last 100+ years of actual data.

Global warming catastrophists in fact have to argue against historical data, and say it is flawed in two ways:  First, they argue there are positive feedbacks in climate that will take hold in the future and accelerate warming; and second, they argue there are other anthropogenic effects, specifically sulphate aerosols, that are masking man-made warming.  Rather than just repeat myself (and in the interest in proving I can actually be succinct) I will point you to my original post, the second half of which deals in depth with these two issues. 

As always, you can find my Layman's Guide to Skepticism about Man-made Global Warming here.  It is available for free in HTML or pdf download, or you can order the printed book that I sell at cost.  My other recent posts about climate are here.

It's OK to be Scared. Just Tell Us.

I agree with Eugene Volokh when he observes that the Opus comic rejected by the Washington Post is pretty dang tame.  I found the cartoon to be poking fun more at men and male attitudes than at Islam.  I don't think there is any way the Post can argue now that their editorial policy is symmetric across all religions.  They are tiptoeing around Islam in a way they never would with Judaism or Christianity.  If they are scared of violent reprisals, they should just say so. 

Must...Not...Make...Ad...Hominem...Attack

A couple of weeks ago, Newsweek published a front-page article demonizing ExxonMobil for given $10,000 honorariums to researchers likely to publish work skeptical of catastrophic man-made global warming.  If $10,000 is corrupting and justifies such an ad hominem attack, what are we to make of $100 million (pronounced in Dr. Evil voice with pinkie to lips) a year in pro-catastrophe spending:

That's right, $100 million per year. Al Gore,
who seems to think it is sinister for other people to spend money in
order to communicate their ideas about sound public policy is going to
outspend the entire mass of climate policy critics tenfold in order to
spread his message of environmental catastrophism to the public.

Speech:  OK for me, but not for thee.

Postscript:  By the way, I fully support Mr. Gore and his donor's efforts to let their viewpoint be heard.  I just wonder why they don't extend me the same courtesy.

A National Security Announcement

Today, the world is a safer place.  Federal Agents from the Department of Homeland Security have siezed my Crest toothpaste.  You can all fly safely now.

Update:  Hey, I have an idea.  The airplane liquids ban makes so much sense, let's promote its author to Attorney General.  Nothing says "able to make clear-headed choices on tradeoffs between security and civil rights" like the liquids ban.  4oz - safe.  4.2 oz - security threat.

Reality Checking Global Warming Forecasts

I know I have deluged you with a lot of climate change posts of late.  I think this particular post is important, as it is the clearest single argument I can make as to why I am skeptical that man-made global warming will rise to catastrophic levels.  It is not comprehensive, it took me 80 pages to do that, but it should get anyone thinking.

It turns out to be quite easy to do a simple but fairly robust reality check of global warming forecasts, even without knowing what a "Watt" or a "forcing" is.   Our approach will be entirely empirical, based on the last 100 years of climate history.  I am sensitive that we skeptics not fall into the
9/11 Truther syndrome of arguing against a coherent theory from
isolated anomalies
.  To this end, my approach here is holistic and not
anomaly driven.  What we
will find is that, extrapolating from history, it is almost impossible to get warming numbers as high as those quoted by global warming alarmists.

Climate Sensitivity

The one simple concept you need to understand is "climate sensitivity."  As used in most global warming literature, climate sensitivity is the amount of global warming that results from a doubling in atmospheric CO2 concentrations.   Usually, when this number is presented, it refers to the warming from a doubling of CO2 concentrations since the beginning of the industrial revolution.  The pre-industrial concentration is generally accepted as 280ppm (0.028% of the atmosphere) and the number today is about 380ppm, so a doubling would be to 560ppm.

As a useful, though not required, first step before we begin, I encourage you to read the RealClimate simple "proof" for laymen that the climate sensitivity is 3ºC, meaning the world will warm 3 degrees C with a doubling of CO2 concentrations from their pre-industrial level.  Don't worry if you don't understand the whole description, we are going to do it a different, and I think more compelling, way (climate scientists are a bit like the Wizard of Oz -- they are afraid if they make things too simple someone might doubt they are a real wizard).  3ºC is a common number for sensitivity used by global warming hawks, though it is actually at the low end of the range that the UN IPCC arrived at in their fourth report.  The IPCC (4th report, page 798) said that the expected value is between 3ºC and 4ºC and that there was a greater chance the sensitivity was larger than 6ºC than that it was 1.5ºC or less.  I will show you why I think it is extraordinarily unlikely that the number is greater even than 1.5ºC.

Our Approach

We are going to derive the sensitivity (actually a reasonable range for sensitivity) for ourselves in three steps.  First, we will do it a simple way.  Then, we will do it a slightly harder but more accurate way.  And third, we will see what we would have to assume to get a number anywhere near 3ºC.  Our approach will be entirely empirical, using past changes in CO2 and temperature to estimate sensitivity.  After all, we have measured CO2 going up by about 100 ppm.  That is about 36% of the way towards a doubling from 280 to 560.  And, we have measured temperatures -- and though there are a lot of biases in these temperature measurements, these measurements certainly are better than our guesses, say, of temperatures in the last ice age.  Did you notice something odd, by the way, in the RealClimate derivation?  They never mentioned measured sensitivities in the last 100 years -- they jumped all the way back to the last ice age.  I wonder if there is a reason for that?

A First Approximation

OK, let's do the obvious.  If we have experienced 36% of a doubling, then we should be able to take the historic temperature rise from CO2 for the same period and multiply it by 2.8 (that's just reciprocal of 36%) and derive the temperature increase we would expect for a full doubling.

The problem is that we don't know the historic temperature rise solely form CO2.  But we do know how to bound it.  The IPCC and most global warming hawks place the warming since 1900 at about 0.6ºC.  Since no one attributes warming before 1900 to man-made CO2  (it did warm, but this is attributed to natural cyclical recovery from the little ice age) then the maximum historic man-made warming is 0.6ºC.  In fact, all of that warming is probably not from CO2.  Some probably is from continued cyclical warming out of the little ice age.  Some, I believe strongly, is due to still uncorrected biases, particularly of urban heat islands, in surface temperature data. 

But let's for a moment attribute, unrealistically, all of this 0.6ºC to man-made CO2 (this is in fact what the IPCC does in their report).   This should place an upper bound on the sensitivity number.  Taking 0.6ºC times 2.8 yields an estimated  climate sensitivity of  1.7ºC.  Oops.  This is about half of the RealClimate number or the IPCC number! And if we take a more realistic number for man-made historic warming as 0.4ºC, then we get a sensitivity of 1.1ºC.  Wow, that's a lot lower! We must be missing something important!  It turns out that we are, in this simple analysis, missing something important.  But taking it into account is going to push our sensitivity number even lower.

A Better Approximation

What we are missing is that the relation between CO2 concentration and warming is not linear, as implied in our first approximation.  It is a diminishing return.  This means that the first 50 ppm rise in CO2 concentrations causes more warming than the next 50 ppm, etc.  This effect has often been compared to painting a window.  The first coat of paint blocks out a lot of light, but the window is still translucent.  The next coat blocks out more light, but not as much as the first.  Eventually, subsequent coats have no effect because all the light is already blocked.  CO2 has a similar effect on warming.  It only absorbs certain wavelengths of radiation returning to space from earth.  Once the absorption of those wavelengths is saturated, extra CO2 will do almost nothing. (update:  By the way, this is not some skeptic's fantasy -- everyone in climate accepts this fact).

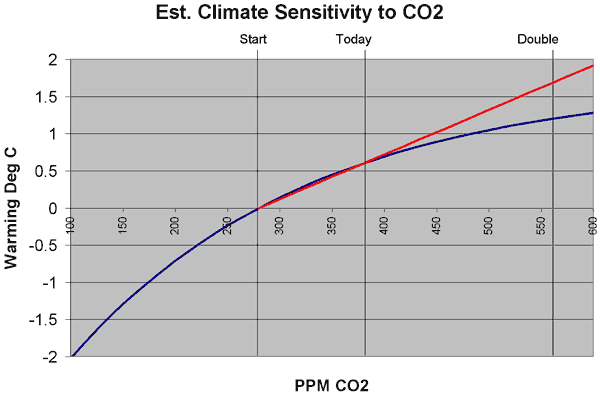
So what does this mean in English?  Well, in our first approximation, we assumed that 36% of a CO2 doubling would yield 36% of the temperature we would get in a doubling.  But in reality, since the relationship is a diminishing return, the first 36% of a CO2 doubling will yield MORE than 36% of the temperature increase you get for a doubling.  The temperature increase is front-loaded, and diminishes going forward.   An illustration is below, with the linear extrapolation in red and the more realistic decreasing exponential extrapolation in blue.
Sensitivity

The exact shape and equation of this curve is not really known, but we can establish a reasonable range of potential values.  For any reasonable shapes of this curve, 36% of a CO2 doubling (where we are today) equates to from 43% to 63% of the final temperature increase over a doubling.  This would imply that a multiplier between 2.3 and 1.6 for temperature extrapolation  (vs. 2.8 derived above for the straight linear extrapolation above) or a climate sensitivity of 1.4ºC to 1.0ºC if man-made historic warming was 0.6ºC and a range of 0.9ºC to 0.6ºC for a man-made historic warming of 0.4ºC.  I tend to use the middle of this range, with a multiplier of about 1.9 and a man-made historic warming of 0.5ºC to give a expected sensitivity of 0.95ºC, which we can round to 1ºC. 

This is why you will often hear skeptics cite numbers closer to 1ºC rather than 3ºC for the climate sensitivity.   Any reasonable analysis of actual climate experience over the last 100 years yields a sensitivity much closer to 1ºC than 3ºC.  Most studies conducted before the current infatuation with showing cataclysmic warming forecasts came up with this same 1ºC, and peer-reviewed work is still coming up with this same number

So what does this mean for the future?  Well, to predict actual temperature increases from this sensitivity, we would have to first create a CO2 production forecast and, you guessed it, global warming hawks have exaggerated that as well.  The IPCC says we will hit the full doubling to 560ppm around 2065 (Al Gore, incredibly, says we will hit it in the next two decades).  This means that with about 0.5C behind us, and a 3 sensitivity, we can expect 2.5C more warming in the next 60 years.  Multiply that times exaggerated negative effects of warming, and you get instant crisis.

However, since actual CO2 production is already below IPCC forecasts, we might take a more reasonable date of 2080-2100 for a doubling to 560.  And, combining this with our derived sensitivity of 1ºC (rather than RealClimate's 3ºC) we will get 0.5C more warming in the next 75-100 years.  This is about the magnitude of warming we experienced in the last century, and most of us did not even notice.

I know you are scratching you head and wondering what trick I pulled to get numbers so much less than the scientific "consensus."  But there is no trick, all my numbers are empirical and right out of the IPCC reports.  In fact, due to measurement biases and other climate effects that drive warming, I actually think the historic warming from CO2 and thus the sensitivity is even lower, but I didn't want to confuse the message. 

So what are climate change hawks assuming that I have not included?  Well, it turns out they add on two things, neither of which has much empirical evidence behind it.  It is in fact the climate hawks, not the skeptics, that need to argue for a couple of anomalies to try to make their case.

Is Climate Dominated by Positive Feedback?

Many climate scientists argue that there are positive feedbacks in the climate system that tend to magnify and amplify the warming from CO2.  For example, a positive feedback might be that hotter climate melts sea ice and glaciers, which reduces the reflectiveness of the earth's surface, which causes more sunlight to be absorbed, which warms things further.  A negative feedback might be that warmer climate vaporizes more water which forms more clouds which blocks sunlight and cools the earth. 

Climate scientists who are strong proponents of catastrophic man-made warming theory assume that the climate is dominated by positive feedbacks.  In fact, my reading of the IPCC report says that the climate "consensus" is that net feedback in the climate system is positive and tends to add 2 more degrees of temperature for every one added from CO2.  You might be thinking - aha - I see how they got a sensitivity of 3ºC:  Your 1ºC plus 2ºC in feedback equals 3ºC. 

But there is a problem with that.  In fact, there are three problems with this.  Here they are:

  1. We came up with our 1ºC sensitivity empirically.  In other words, we observed a 100ppm past CO2 increase leading to 0.5ºC measured temperature increase which implies 1ºC sensitivity.  But since this is empirical, rather than developed from some set of forcings and computer models, then it should already be net of all feedbacks.  If there are positive feedbacks in the system, then they have been operating and should be part of that 1ºC.
  2. There is no good scientific evidence that there is a large net positive feedback loop in climate, or even that the feedback is net positive at all.  There are various studies, hypotheses, models, etc., but no proof at all.  In fact, you can guess this from our empirical data.  History implies that there can't be any large positive feedbacks in the system or else we would have observed higher temperatures historically.  In fact, we can go back in to the distant historical record (in fact, Al Gore showed the chart I am thinking of in An Inconvenient Truth) and find that temperatures have never run away or exhibited any sort of tipping point effect.
  3. The notion that a system like climate, which has been reasonably stable for millions of years, is dominated by positive feedback should offend the intuition of any scientist.  Nature is dominated in large part by negative feedback processes.  Positive feedback processes are highly unstable, and tend to run away to a distant endpoint.  Nuclear fission, for example, is a positive feedback process

Do aerosols and dimming imply a higher sensitivity?

Finally, the last argument that climate hawks would employ is that anthropogenic effects, specifically emission of SO2 aerosols and carbon black, have been reflecting sunlight and offsetting the global warming effect.  But, they caution, once we eliminate these pollutants, which we have done in the West (only to be offset in China and Asia) temperatures will no longer be suppressed and we will see the full extent of warming.

First, again, no one really has any clue the magnitude of this effect, or even if it is an effect at all.  Second, its reach will tend to be localized over industrial areas (since their presence in the atmosphere is relatively short-lived), whereas CO2 acts worldwide.  If these aerosols and carbon black are concentrated say over 20% of the land surface of the world, this means they are only affecting the temperature over 5% of the total earth' s surface.  So its hard to argue they are that significant.

However, let's say for a moment this effect does exist.  How large would it have to be to argue that a 3.0ºC climate sensitivity is justified by historical data?  Well, taking 3.0ºC and dividing by our derived extrapolation multiplier of 1.9, we get required historic warming due to man's efforts of 1.6ºC.  This means that even if all past 0.6ºC of warming is due to man (a stretch), then aerosols must be suppressing a full 1ºC of warming.   I can't say this is impossible, but it is highly unlikely and certainly absolutely no empirical evidence exists to support any number like this. Particularly since dimming effects probably are localized, you would need as much as 20ºC suppression in these local areas to get a 1ºC global effect.  Not very likely.

Why the number might even be less

Remember that when we calculated sensitivity, we needed the historical warming due to man's CO2.  A simple equation for arriving at this number is:

Warming due to Man's CO2 = Total Historic Measured Warming - Measurement Biases - Warming from other Sources + Warming suppressed by Aerosols

This is why most skeptics care if surface temperature measurements are biased upwards or if the sun is increasing in intensity.  Global warming advocates scoff and say that these effects don't undermine greenhouse gas theory.  And they don't.  I accept greenhouse gases cause some warming.  BUT, the more surface temperature measurements are biased upwards and the more warming is being driven by non-anthropogenic sources, the less that is being caused by man.  And, as you have seen in this post, the less warming caused by man historically means less that we will see in the future.  And while global warming hawks want to paint skeptics as "deniers", we skeptics want to argue the much more interesting question "Yes, but how much is the world warming, and does this amount of warming really justify the costs of abatement, which are enormous."


As always, you can find my Layman's Guide to Skepticism about Man-made Global Warming here.  It is available for free in HTML or pdf download, or you can order the printed book that I sell at cost.  My other recent posts about climate are here.
Not Yet, Mr. King

I have a dream that my four little children will one day live in a nation
where they will not be judged by the color of their skin but by the content of
their character.

Today I am spending much of the day filling out my EEO-1 report for the government.  This report requires me to officially report the race of each of my employees.  One of the most distasteful things I have to do all year.

Academic Arguments for the Imperial Presidency

Well, this, from Opinio Juris, certainly got my blood moving this morning:

The first part of Posner and Vermeule's book offers a forceful
theoretical defense of executive authority during times of emergency.
The book offers a thoughtful and well-reasoned perspective on the
cost-benefit analysis at play when government seeks the optimal balance
between the competing goods of security and liberty. Posner and
Vermeule argue that there is a Pareto security-liberty frontier at
which no win-win improvements are possible. That is, at this frontier
any increase in security will require a decrease in liberty, and
vice-versa. From my perspective, the existence of this security-liberty
frontier appears unassailable.

Given this frontier, Posner and Vermeule then offer their central
argument of institutional competence. They argue that there are few or
no domains in which it is true both that government choices about
emergency policies are not accurate (on average) and
that judicial review can make things better. They further argue that
civil libertarians who subscribe to vigorous judicial review in times
of emergency fail to identify a large and important set of cases in
which government blunders or acts opportunistically during emergencies and in which judges can improve matters

I haven't read the book, and am only just getting through the symposium they are holding.  My first, primal reaction is YUK!  Here are a couple of random thoughts:

  • I don't know if the last statement in the second paragraph is true -- I suspect it is not, or at least is subject to "improve matters" being interpreted differently by each individual.  However, it strikes me that even if the statement is true, checks and reviews by other branches of government still circumscribe executive excesses by their threat.  And the act and/or the threat of review leads to open political debate that can redirect executive actions.  Even GWB, who has pushed the theory of executive powers to new levels, can arguably be said to have modified his management of the Iraq war in response to Congressional scrutiny, even without explicit legislation being passed. 
  • The incentive system in government is for the government and its employees to grab new powers over the populace.  Anything that slows down that process, even in a "Crisis" is a good thing
  • If they want to argue that the Congress is useless as a check because in times of crisis they just become the president's bitch, I can't argue with you.  Just look at how the Democratic majority actions on Patriot Act rollbacks (none) or FISA enforcement (they actually retroactively gave Bush the power he wanted).  But this does not mean we should give up hoping they will try.
  • Government officials love it when they can act with enhanced power and decreased accountability.  If we institutionalize an imperial presidency in times of "crisis" and then give the President the power to declare a "crisis", then you can bet we will always be in a crisis.   Even if checks and balances don't tend to improve civil liberties decision-making in times of crisis, they at least help us get out of the crisis and declare normality again.  Otherwise we would never go back.

The real problem is that a government full of lifetime government employees is never, ever going to make the right choice on the security-freedom curve.  Really, by security, we mean government intrusion, so you can think of this as the government power vs. individual power curve.  And lifetime government employees are always going to choose for more power for themselves.  The problem is not who in government should fix our point on this curve, the problem is that anyone in the government is allowed to fix this point. 

That was what the Constitution was supposed to be for -- an act of the people fixing this point for the government.  The founding fathers were well aware of republics that had processes for slipping into dictatorship in times of war.  Rome was a good example, and eventually demonstrated what happened in this system -- the crisis never went away and you got a dictator all the time with no republic.  The founders explicitly did not write such a capacity for the president into the Constitution.  And it should stay that way.

Hopefully I will have more coherent thoughts after having read more of their work.

Update:  This comes to mind, for example

A recent interview with
Mike McConnell, the director of national intelligence, suggests that
the administration also feels duty-bound to withhold information when
it might be useful to critics who oppose President Bush's
anti-terrorism policies, since those policies are necessary to protect
national security. But the very same information can"”indeed, should"”be
released at a more opportune time, when it will help the president
pursue his policies....

And then further, to the issue of eavesdropping international calls:

It's
pretty clear McConnell's real concern is that debating this issue
endangers national security because it threatens to prevent the
president from doing whatever he thinks is necessary to fight
terrorism. Hence Steven Aftergood, director of the Project on
Government Secrecy at the Federation of American Scientists, is not at
all exaggerating when he observes, "He's basically saying that
democracy is going to kill Americans." And not just democracy, but
constitutional government of any kind, since anything that interferes
with the president's unilateral decisions with respect to national
security (which is whatever he says it is) is going to kill Americans
too.

I think you're a vandal and extremely costly to our society

Apparently, we taxpayers gaurantee $645 billion in flood insurance so wealthy folks can build second homes on the beech, and have them wash away every few years at taxpayer expense.  USAToday, breaking from general habit, actually criticized a government giveaway in this article.  But I think that the John Stossel article linked by Q&O is better  (Memo to ABC web guys -- your articles stay online for years so it might be nice to add a year to that date in the byline).  Stossel points out that the tab for flood insurance understates the beachfront subsidy:  Costs for FEMA, disaster relief, Corps of Engineers projects, beech erosion abatement, etc. all are also government subsidies for living in dangerous locations.

But the outrage is that federal flood insurance exists at all. There is
a quarter-million-dollar limit on each payment, and as long as I build
my house in accordance with zoning laws and ordinances, there is no
limit on how many times the government will pay if a house keeps
washing away

Changes around Uranus

Sorry, but its just impossible for me to resist juvenile Uranus humor.  However, the rings around Uranus are indeed changing.  The other day, I wrote about something I call "scientific anthropomorphism," or our tendency to define "normal" in long-time-frame phenomena based upon our very short observational history.  Events on Uranus bear out this fallacy:

The images revealed that the inner rings of micron-sized
dust have changed significantly since the Voyager 2 spacecraft
photographed the Uranus system 21 years ago. Today the inner rings are
much more prominent than expected.

"People tend to think of the rings as unchanging, but
our observations show that not to be the case," said Dr de Pater.
"There are a lot of forces acting on small dust grains, so it is not
that crazy to find that the arrangement of rings has changed."

via The Reference Frame

Communications are a Pain

It always happens this way.

Pick a random message: Let's say I want my folks at Matagorda to know that what they do is important.  So I visit from time to time and tell them they are doing a great job.  I will email them with the same message, emphasizing how important Matagorda is to the company.  Each quarter I will compliment them on their results.  I will show Matagorda in all my long-term strategy documents as one of our core operations.  Every time I am on the phone with them I thank them for their had work at so important a facility.

And then one of our employee's mailman's wife's gynecologist's dog's veterinarian's receptionist might say at a social gathering that she heard our company was leaving Matagorda and the next day I will have 8 people emailing me to ask me why I was about to fire everyone and, further, how mad they were to hear about it second hand. 

Sometimes I want to just give up.

My Primary Proposal

Extrapolating from current events, states will soon be fighting over the week after last presidential election so they can hold the first primary of the next election cycle.  It's totally nuts, but completely predictable from the incentives:  No cost and large perceived benefit from moving one's state's primary forward.  What there needs to be is a countervailing cost to moving forward.

Here is the proposal I made 4 years ago:   States in the first 25% of primaries (by delegate count) can only award 25% of their delegates on their early primary date, and must hold a second primary three months later to award the rest.  States in the next 25% can only award half their delegates at the first primary, and must also hold a second primary to award the rest.  Everyone else in the back half can award as normal.  So the first half of the primaries only award 18.75% of the delegates.  Candidates may get momentum from early state wins, but over three quarters of the delegates will yet be awarded, so later states will matter too.

English as an Open Source Language

One of the great things about modern English is that it is bottom-up and open-source.  Years ago, the Oxford English Dictionary took the approach of documenting what English is, rather than the French approach of dictating what the language should be.  As a result, the language evolves based on how ordinary people are using it.  Which is perhaps why the word in many languages for new trends and technologies is often the English word (much to the consternation of the French). 

I tend to agree with Eugene Volokh's definition of "what is a word."  Then think how different this might be in statist cultures, where a word is only a word when the government says it is.

PS-  I acknowledge that this makes English harder to learn for people whose first language is less idiomatic.

Update: Much more here

Um, I think they are all non-native

I thought it was kind of silly how often I have seen blogs commenting on the story about Bette Midler cutting down her own trees in Hawaii.  We should be supporting her property rights, not searching around for trivial examples of supposed hypocrisy.  However, I did note this line from Midler's spokesman:

"The whole idea with cutting the trees down was with the idea of
improving the lot with native species" instead of the nonnative,
invasive species that had grown there, Graham said. "It's unfortunate
that a mistake was made."

Given that the island rose out of the sea as volcanic molten lava, my wild guess, without having a degree in botany, is that most all the plants and animals in Hawaii are non-native.  For example, the Big Island only rose out of the sea less than 500,000 years ago.  I am pretty sure no trees came up with the lava.

This strikes me as a common form of environmental anthropomorphism -- "Normal" is defined as the condition in which man has observed things over the last 200 or so years, a blink of the eye in geologic time.  So the only allowable plants and animals are those that existed at the moment man started to observe a certain location.  In the same way, "normal" for world temperatures is defined as what we observed them to be in about 1950.  Climate and nature and geology follow multiple cycles and trend lines, some of which stretch for millions of years.  It is hubris to say that we know what "normal" is.