So it turns out that the solar roads I was sure would not work have actually now been built and... they don't work.
One of the first solar roads to be installed is in Tourouvre-au-Perche, France. This has a maximum power output of 420 kW, covers 2,800 metres squared and cost €5 million to install. This implies a cost of €11,905 per installed kW.
The road's capacity factor – which measures the efficiency of the technology by dividing its average power output by its potential maximum power output – is just 4 percent.
In contrast, the Cestas solar plant near Bordeaux, which features rows of solar panels carefully angled towards the sun, has a maximum power output of 300,000 kW and a capacity factor of 14 percent. And at a cost of €360 million, or €1,200 per installed kW, one-tenth the cost of our solar roadway, it generates three times more power.
There is much more. I am embarrassed to say that when I slammed solar roads all those years, I actually was missing an important problem with them:
Unable to benefit from air circulation, its inevitable these panels will heat up more than a rooftop solar panel too.
As a result a significant drop in performance for a solar road, compared to rooftop solar panels, has to be expected. The question is by how much and what is the economic cost?
I will add this to the list, thanks.
When I write stuff like this, I get the same kind of mindless feedback that I get when I point out operational issues at Tesla, ie "you are in the pay of the Koch brothers" or "you have no vision." Well, I am actually putting solar on my roof and will get (hopefully) 45,000 KwH per year, which is about a third of the energy they get from this road but installed for a bit over 1% of the cost of the road. And the panels are all ideally angled and placed, they are up in the air with absolutely no shade on them at any time of the day, and they don't have any trucks driving over them.
Tags: feedback, solar, temperature, UK Category: Energy, Science |
Comments Off on In the Absolutely Most Predictable Scientific Finding Ever, Solar Roads Are Found to Suck
I have over several months been answering questions about my climate positions -- I think for a woman's school project but I honestly can't remember any more. Anyway, I answered a question for her today and though I did not spend a ton of time on it, I thought I would share.
She asked:
Why do you find it unproductive to argue for something based on how many experts are agreeing to it? Wouldn't it be hubris to dismiss the fact that a number of experts are contradicting you on a subject that is pretty complex and is something that isn't nesessarily understood intuitively?
Why do you believe it is unproductive to take such a point into serious consideration?
The way I see it. there is this kind of logic:
A math student works on a very complicated math problem from his homework and has all his justifications for his answer. However, it turns out that his math professor has a different answer-- which is saying something important. It would be a slippery slope for the student to posit that his answer is right and the professor's answer is wrong just because the justification he came up with on his own always leads him back to the same answer. (That is, unless he found out an explanation for why his professor got that answer, like say-- maybe the professor never worked out the problem by himself and looked at an answer key which was wrong.)
My off the cuff responses to the student:
This is not a simple math problem. It is a super complex multi-variable chaotic system in which we are trying to attribute changes in one output variable (temperature) to a single input variable out of thousands or millions (CO2). I think the majority of the hubris (given the state of our knowledge) is on the certainty side, not the doubting side. I would observe, by the way, that many of the exact same people who use this "you must respect the experts" argument against climate skeptics themselves challenge many expert assertions, e.g. that minimum wages reduce employment or that GMO's are safe, that are supported by at least as many experts in those other fields. You would be unusual if you personally do not disagree with some proposition that most of the "experts" support.
The way folks often describe science when trying to criticize climate skeptics sounds to me a lot more like religion than science. Saying that there are fundamental assertions that one cannot challenge is a feature of religion, not true science. Science is about having a theory, making predictions from that theory, and if those predictions consistently turn out to be true, then gaining confidence in the theory. Many of global warming predictions have been wrong -- they have overestimated temperature increases to date, hurricanes and tornadoes are not getting more frequent, droughts are not getting more frequent, etc (do not confuse the frequency of these events in the news with their actual underlying frequency -- go live with the data at the NOAA to see that all these severe weather trends are dead flat). But no one goes back and relooks at the model or theories and those that do point out these shortcomings, eg. skeptics, are threatened with censure. Does not sound like science to me.
I am not without relevant expertise. Though I don't have as deep of climate knowledge as some, I know a lot about modeling chaotic multivariable systems (in finance and economics) and know exactly what the shortcomings of models are and can recognize the patterns of many mistakes in climate that I have seen in other fields of modeling. Further, the key difference skeptics have with alarmists is the expectation of strong positive feedbacks in the climate accelerating temperatures greatly. My major and research work in college were in dynamic systems and feedbacks. Climate scientists are positing that there is more positive feedback in the climate system than exists in any other stable natural system we know about. That is worth some skepticism if one understands feedbacks.
The experts in climate would be a lot more credible if they were more transparent and open to discourse. Instead, they frequently refuse to release their data (even on government-funded projects) for replication and carefully engineer peer review panels so no one who actually disagrees with them are on it. It has been years since any climate "expert" has agreed to participate in a public debate.
The most important answer is that what the "experts" are saying and what the media and the general public are saying the experts are saying is completely different. There is a bait and switch going on, where the majority (though maybe not the most vocal) of the experts are very careful and conservative (little c) in their claims, but they are portrayed as being all-in en masse on the most outrageous and spectacular of the claims by activists. I would refer you to this article, but I will reprint below the key part to your question:
So let's come back to our original question -- what is it exactly that skeptics "deny." As we have seen, most don't deny the greenhouse gas theory, or that the Earth has warmed some amount over the last several year. They don't even deny that some of that warming has likely been via man-made CO2. What they deny is the catastrophe -- they argue that the theory of strong climate positive feedback is flawed, and is greatly exaggerating the amount of warming we will see from man-made CO2. And, they are simultaneously denying that most or all of past warming is man-made, and arguing instead that the amount that is natural and cyclic is being under-estimated.
So how about the "97% of scientists" who purportedly support global warming? What proposition do they support? Let's forget for a minute a variety of concerns about cherry-picking respondents in studies like this (I am always reminded by such studies of the quote attributed, perhaps apocryphally, to Pauline Kael that she couldn't understand how Nixon had won because no one she knew voted for him). Let's look at the actual propositions the 97% agreed to in one such study conducted at the University of Illinois. Here they are: 1. When compared with pre-1800s levels, do you think that mean global temperatures have generally risen, fallen, or remained relatively constant? 2. Do you think human activity is a significant contributing factor in changing mean global temperatures? The 97% answered "risen" and "yes" to these two questions. But depending on how one defines "significant" (is 20% a significant factor?) I could get 97% of a group of science-based skeptics to agree to the same answers. So this is the real problem at the heart of the climate debate -- the two sides are debating different propositions! In our chart, proponents of global warming action are vigorously defending the propositions on the left side [see chart in the original], propositions with which serious skeptics generally already agree. When skeptics raise issues about climate models, natural sources of warming, and climate feedbacks, advocates of global warming action run back to the left side of the chart and respond that the world is warming and greenhouse gas theory is correct. At best, this is a function of the laziness and scientific illiteracy of the media that allows folks to talk past one another; at worst, it is a purposeful bait-and-switch to avoid debate on the tough issues.
I could have also said that there were several times in class when I challenged the teacher on a math problem answer and I was right and they were wrong. My wife-to-be was actually in one of these classes and can testify to the fact.
By the way, I find the last point I made about bait and switch to be surprisingly similar to problems I have arguing net neutrality. The problem is that the FCC's actions under Obama were NOT net neutrality, they were applying early 1900's telephone regulation which pretty much killed innovation in that industry to the Internet. Unfortunately, everyone calls those regulations "net neutrality" so if you oppose these dumb counter-productive regulations one is somehow against net neutrality when in fact it is nothing of the sort.
Years ago I got tired of store-bought cards and cards with pictures of the family taken at Disneyland or skiing or whatever, so I created my own holiday card. We got positive feedback, so I did another (past examples here, here, here). I kept on with it, though over time it became a burden -- the weight of it would hit me about November 15: What am I going to do next year for a card?
But this year my daughter, who is off to art college in Pasadena this January, picked up the mantle and drew our family portrait for our card. Wow, what a relief. I feel like a tired 16th century farmer whose son just grew old enough to do the plowing.
So Merry Christmas, or happy whatever holiday you celebrate this time of year.
PS -- OK, I don't want to nitpick, but I guess the 16th century farmer probably criticized the straightness of his son's furrows. She made the drawing square, which necessitated a square envelope, which in turn cost us 20 cents extra in postage for each since square letters take special handling at the post office. But it was a small price to pay.
Update: To the comment that the choice of 16th century for my farmer analogy was sort of random, I happened at the time to be listening to yet another in the Great Courses series (love them) and it was just discussing agrigulture in the 16th century.
We have a number of ways to collect customer feedback and I ensure that any negative score or comment we get from any source comes right to my email box so I can investigate personally. We don't get that many negative comments, perhaps a couple a month (which is pretty good with over 2 million visitors last year). The most common negative comment is something like "your employee was very rude to me."
This comment is a good illustration of how it can be hard to parse customer comments. Because from my experience, the comment "your employee was rude to me" tends to mean one of two very different things:
My employees were actually rude to the customer, requiring an immediate intervention on my part
My employees were as patient and polite as can be expected, but were giving the customer an answer the customer did not want to hear (e.g. "you can't park on the grass, I need you to move your car.")
This year, I would say explanation #2 is in the lead by about 70%-30% over explanation 1. As an operator of a public campground, we must enforce the rules set by the public agency. We frequently encounter customers who simply do not like the rules and therefore consider the existence of the rules to be a violent aggression against them. A great example is food storage. In areas of high bear activity, it is important that customer properly store their food so as not to attract bears to the campground -- campers in these areas are given literature about food storage and our hosts come by to explain the rules and answer questions. But there are folks who simply won't comply, and these folks frequently complain to me that my people are being rude.
Postscript: As an added bonus, I will give you one example of why businesses often tear their hair out over online reviews. A year or so ago we got a Yelp review at a lakefront campground saying that the customer had been "lied to" because she was not allowed to use her jetskis in the lake. I was surprised at this, since the no jetski rule is set in stone by our government partner and I thought we had made it pretty clear on the web site. So I contacted the customer asking what we had done to mislead her. She said that her dad promised her that she could jetski and we wouldn't let her so that is why she said we lied. There are times in life when you just have to move on, and this seemed like one of them, so once I assured myself there was nothing we could do to correct errors in our web sites, I said "thanks for the feedback" and hung up.
In Bloomberg, Megan McArdle gives me a nice link to my climate series that begins here. Some of you may wonder if I know about such things in advance. The answer is no. The only way I really knew was that I woke up in my little hotel in Bruges and fired up my email on my 300 baud hotel internet connection and found about 20 loooong emails wishing to discuss some aspects of climate in detail. Which I actually really enjoy, except that I was sort of unprepared for the deluge.
I will get back to everyone in time. I do enjoy the feedback, and consider myself pretty persuadable on climate topics.
PS- If you have not seen the movie "In Bruges", it is not particularly well-known but is a good film, imho.
Having established that the Earth has warmed over the past century or so (though with some dispute over how much), we turn to the more interesting -- and certainly more difficult -- question of finding causes for past warming. Specifically, for the global warming debate, we would like to know how much of the warming was due to natural variations and how much was man-made. Obviously this is hard to do, because no one has two thermometers that show the temperature with and without man's influence.
I like to begin each chapter with the IPCC's official position, but this is a bit hard in this case because they use a lot of soft words rather than exact numbers. They don't say 0.5 of the 0.8C is due to man, or anything so specific. They use phrases like "much of the warming" to describe man's affect. However, it is safe to say that most advocates of catastrophic man-made global warming theory will claim that most or all of the last century's warming is due to man, and that is how we have put it in our framework below:
By the way, the "and more" is not a typo -- there are a number of folks who will argue that the world would have actually cooled without manmade CO2 and thus manmade CO2 has contributed more than the total measured warming. This actually turns out to be an important argument, since the totality of past warming is not enough to be consistent with high sensitivity, high feedback warming forecasts. But we will return to this in part C of this chapter.
Past, Mostly Abandoned Arguments for Attribution to Man
There have been and still are many different approaches to the attributions problem. In a moment, we will discuss the current preferred approach. However, it is worth reviewing two other approaches that have mostly been abandoned but which had a lot of currency in the media for some time, in part because both were in Al Gore's film An Inconvenient Truth.
Before we get into them, I want to take a step back and briefly discuss what is called paleo-climatology, which is essentially the study of past climate before the time when we had measurement instruments and systematic record-keeping for weather. Because we don't have direct measurements, say, of the temperature in the year 1352, scientists must look for some alternate measure, called a "proxy," that might be correlated with a certain climate variable and thus useful in estimating past climate metrics. For example, one might look at the width of tree rings, and hypothesize that varying widths in different years might correlate to temperature or precipitation in those years. Most proxies take advantage of such annual layering, as we have in tree rings.
One such methodology uses ice cores. Ice in certain places like Antarctica and Greenland is laid down in annual layers. By taking a core sample, characteristics of the ice can be measured at different layers and matched to approximate years. CO2 concentrations can actually be measured in air bubbles in the ice, and atmospheric temperatures at the time the ice was laid down can be estimated from certain oxygen isotope ratios in the ice. The result is that one can plot a chart going back hundreds of thousands of years that estimates atmospheric CO2 and temperature. Al Gore showed this chart in his movie, in a really cool presentation where the chart wrapped around three screens:
As Gore points out, this looks to be a smoking gun for attribution of temperature changes to CO2. From this chart, temperature and CO2 concentrations appear to be moving in lockstep. From this, CO2 doesn't seem to be a driver of temperatures, it seems to be THE driver, which is why Gore often called it the global thermostat.
But there turned out to be a problem, which is why this analysis no longer is treated as a smoking gun, at least for the attribution issue. Over time, scientists got better at taking finer and finer cuts of the ice cores, and what they found is that when they looked on a tighter scale, the temperature was rising (in the black spikes of the chart) on average 800 years before the CO2 levels (in red) rose.
This obviously throws a monkey wrench in the causality argument. Rising CO2 can hardly be the cause of rising temperatures if the CO2 levels are rising after temperatures.
It is now mostly thought that what this chart represents is the liberation of dissolved CO2 from oceans as temperatures rise. Oceans have a lot of dissolved CO2, and as the oceans get hotter, they will give up some of this CO2 to the atmosphere.
The second outdated attribution analysis we will discuss is perhaps the most famous: The Hockey Stick. Based on a research paper by Michael Mann when he was still a grad student, it was made famous in Al Gore's movie as well as numerous other press articles. It became the poster child, for a few years, of the global warming movement.
So what is it? Like the ice core chart, it is a proxy analysis attempting to reconstruct temperature history, in this case over the last 1000 years or so. Mann originally used tree rings, though in later versions he has added other proxies, such as from organic matter laid down in sediment layers.
Before the Mann hockey stick, scientists (and the IPCC) believed the temperature history of the last 1000 years looked something like this:
Generally accepted history had a warm period from about 1100-1300 called the Medieval Warm Period which was warmer than it is today, with a cold period in the 17th and 18th centuries called the "Little Ice Age". Temperature increases since the little ice age could in part be thought of as a recovery from this colder period. Strong anecdotal evidence existed from European sources supporting the existence of both the Medieval Warm Period and the Little Ice Age. For example, I have taken several history courses on the high Middle Ages and every single professor has described the warm period from 1100-1300 as creating a demographic boom which defined the era (yes, warmth was a good thing back then). In fact, many will point to the famines in the early 14th century that resulted from the end of this warm period as having weakened the population and set the stage for the Black Death.
However, this sort of natural variation before the age where man burned substantial amounts of fossil fuels created something of a problem for catastrophic man-made global warming theory. How does one convince the population of catastrophe if current warming is within the limits of natural variation? Doesn't this push the default attribution of warming towards natural factors and away from man?
The answer came from Michael Mann (now Dr. Mann but actually produced originally before he finished grad school). It has been dubbed the hockey stick for its shape:
The reconstructed temperatures are shown in blue, and gone are the Medieval Warm Period and the Little Ice Age, which Mann argued were local to Europe and not global phenomena. The story that emerged from this chart is that before industrialization, global temperatures were virtually flat, oscillating within a very narrow band of a few tenths of a degree. However, since 1900, something entirely new seems to be happening, breaking the historical pattern. From this chart, it looks like modern man has perhaps changed the climate. This shape, with the long flat historical trend and the sharp uptick at the end, is why it gets the name "hockey stick."
Oceans of ink and electrons have been spilled over the last 10+ years around the hockey stick, including a myriad of published books. In general, except for a few hard core paleoclimatologists and perhaps Dr. Mann himself, most folks have moved on from the hockey stick as a useful argument in the attribution debate. After all, even if the chart is correct, it provides only indirect evidence of the effect of man-made CO2.
Here are a few of the critiques:
Note that the real visual impact of the hockey stick comes from the orange data on the far right -- the blue data alone doesn't form much of a hockey stick. But the orange data is from an entirely different source, in fact an entirely different measurement technology -- the blue data is from tree rings, and the orange is form thermometers. Dr. Mann bristles at the accusation that he "grafted" one data set onto the other, but by drawing the chart this way, that is exactly what he did, at least visually. Why does this matter? Well, we have to be very careful with inflections in data that occur exactly at the point that where we change measurement technologies -- we are left with the suspicion that the change in slope is due to differences in the measurement technology, rather than in the underlying phenomenon being measured.
In fact, well after this chart was published, we discovered that Mann and other like Keith Briffa actually truncated the tree ring temperature reconstructions (the blue line) early. Note that the blue data ends around 1950. Why? Well, it turns out that many tree ring reconstructions showed temperatures declining after 1950. Does this mean that thermometers were wrong? No, but it does provide good evidence that the trees are not accurately following current temperature increases, and so probably did not accurately portray temperatures in the past.
If one looks at the graphs of all of Mann's individual proxy series that are averaged into this chart, astonishingly few actually look like hockey sticks. So how do they average into one? McIntyre and McKitrick in 2005 showed that Mann used some highly unusual and unprecedented-to-all-but-himself statistical methods that could create hockey sticks out of thin air. The duo fed random data into Mann's algorithm and got hockey sticks.
At the end of the day, most of the hockey stick (again due to Mann's averaging methods) was due to samples from just a handful of bristle-cone pine trees in one spot in California, trees whose growth is likely driven by a number of non-temperature factors like precipitation levels and atmospheric CO2 fertilization. Without these few trees, most of the hockey stick disappears. In later years he added in non-tree-ring series, but the results still often relied on just a few series, including the Tiljander sediments where Mann essentially flipped the data upside down to get the results he wanted. Taking out the bristlecone pines and the abused Tiljander series made the hockey stick go away again.
There have been plenty of other efforts at proxy series that continue to show the Medieval Warm Period and Little Ice Age as we know them from the historical record
As an aside, Mann's hockey stick was always problematic for supporters of catastrophic man-made global warming theory for another reason. The hockey stick implies that the world's temperatures are, in absence of man, almost dead-flat stable. But this is hardly consistent with the basic hypothesis, discussed earlier, that the climate is dominated by strong positive feedbacks that take small temperature variations and multiply them many times. If Mann's hockey stick is correct, it could also be taken as evidence against high climate sensitivities that are demanded by the catastrophe theory.
The Current Lead Argument for Attribution of Past Warming to Man
So we are still left wondering, how do climate scientists attribute past warming to man? Well, to begin, in doing so they tend to focus on the period after 1940, when large-scale fossil fuel combustion really began in earnest. Temperatures have risen since 1940, but in fact nearly all of this rise occurred in the 20 year period from 1978 to 1998:
To be fair, and better understand the thinking at the time, let's put ourselves in the shoes of scientists around the turn of the century and throw out what we know happened after that date. Scientists then would have been looking at this picture:
Sitting in the year 2000, the recent warming rate might have looked dire .. nearly 2C per century...
Or possibly worse if we were on an accelerating course...
Scientists began to develop a hypothesis that this temperature rise was occurring too rapidly to be natural, that it had to be at least partially man-made. I have always thought this a slightly odd conclusion, since the slope from this 20-year period looks almost identical to the slope centered around the 1930's, which was very unlikely to have much human influence.
But never-the-less, the hypothesis that the 1978-1998 temperature rise was too fast to be natural gained great currency. But how does one prove it?
What scientists did was to build computer models to simulate the climate. They then ran the computer models twice. The first time they ran them with only natural factors, or at least only the natural factors they knew about or were able to model (they left a lot out, but we will get to that in time). These models were not able to produce the 1978-1998 warming rates. Then, they re-ran the models with manmade CO2, and particularly with a high climate sensitivity to CO2 based on the high feedback assumptions we discussed in an earlier chapter. With these models, they were able to recreate the 1978-1998 temperature rise. As Dr. Richard Lindzen of MIT described the process:
What was done, was to take a large number of models that could not reasonably simulate known patterns of natural behavior (such as ENSO, the Pacific Decadal Oscillation, the Atlantic Multidecadal Oscillation), claim that such models nonetheless accurately depicted natural internal climate variability, and use the fact that these models could not replicate the warming episode from the mid seventies through the mid nineties, to argue that forcing was necessary and that the forcing must have been due to man.
Another way to put this argument is "we can't think of anything natural that could be causing this warming, so by default it must be man-made. With various increases in sophistication, this remains the lead argument in favor of attribution of past warming to man.
In part B of this chapter, we will discuss what natural factors were left out of these models, and I will take my own shot at a simple attribution analysis.
FIRE is looking for a client (University or aggrieved student) whom it can help sue the Department of Education over their sexual misconduct guidance
Five years ago today, the Department of Education’s Office for Civil Rights (OCR) announced sweeping new requirements for colleges and universities adjudicating allegations of sexual misconduct. By unilaterally issuing these binding mandates via a controversial “Dear Colleague” letter (DCL), OCR ignored its obligation under federal law to notify the public of the proposed changes and solicit feedback.
To correct this error, and to begin to fix a broken system of campus sexual assault adjudication that regularly fails all involved, the Foundation for Individual Rights in Education (FIRE) seeks a student or institution to challenge OCR’s abuse of power. FIRE has made arrangements to secure legal counsel for a student or institution harmed by OCR’s mandates and in a position to challenge the agency’s violation of the Administrative Procedure Act(APA). In keeping with FIRE’s charitable mission to advance the public interest, representation will be provided at no cost to the harmed party.
“In the five years since its issuance, OCR has acted as though the 2011 Dear Colleague letter is binding law—but it isn’t,” said FIRE Executive Director Robert Shibley. “By circumventing federal law, OCR ignored all stakeholders: victims, the accused, civil liberties advocates, administrators, colleges, law enforcement, and the general public. Real people’s lives are being irreparably harmed as a result. It’s time that OCR be held accountable.”
The DCL requires that schools use the low “preponderance of the evidence” standard of proof (i.e., that they find an accused student guilty with just 50.01 percent certainty) when adjudicating claims of sexual assault and sexual harassment. The DCL’s requirement that colleges use this standard—found nowhere in Title IX or its implementing regulations, and specified before 2011 only in letters between OCR and individual schools—effectively creates a new substantive rule for institutions to follow.
Here is what is amazing to me: Not a single university has challenged this rule, even though trashes the due process rights of is male students. These same universities had no problem defying the law on things like ROTC and army recruiting (which represent mostly voluntary enticements of their students) but have rolled over and played dead over this much more direct threat to their students' well-being.
We ended the last chapter on the greenhouse gas theory with this:
So whence comes the catastrophe? As mentioned in the introduction, the catastrophe comes from a second, independent theory that the Earth's climate system is dominated by strong positive feedbacks that multiply greenhouse warming many times into a catastrophe.
In this chapter, we will discuss this second, independent theory: that the Earth's climate system is dominated by positive feedbacks. I suppose the first question is, "What do we mean by feedback?"
In a strict sense, feedback is the connection of the output of a system to its input, creating a process that is circular: A system creates an output based on some initial input, that output changes the system's input, which then changes its output, which then in turn changes its input, etc.
Typically, there are two types of feedback: negative and positive. Negative feedback is a bit like the ball in the trough in the illustration above. If we tap the ball, it moves, but that movement creates new forces (e.g. gravity and the walls of the trough) that tend to send the ball back where it started. Negative feedback tends to attenuate any input to a system -- meaning that for any given push on the system, the output will end up being less than one might have expected from the push.
Positive feedback is more like the ball sitting on top of the hill. Even a small tap will send it rolling very far away, because the shape of the hill and gravity tend to push the ball even further in the direction of the tap. Positive feedback amplifies or multiplies any input to a system, meaning that even small pushes can lead to very large results.
The climate temperature system has a mix of positive and negative feedbacks.
For example, consider cumulus clouds. If the Earth warms, more water tends to evaporate from the oceans, and some of that water will form big fluffy white clouds. These clouds act as an umbrella for the Earth, reflecting heat back into space. So as more clouds form due to warming, there is a net new cooling effect that offsets some of the original warming. The amount of warming we might have expected is smaller due to the negative feedback of cloud formation.
On the other side, consider ice and snow. Ice and snow reflect sunlight back into space and keep the Earth cooler than it would be without the ice and snow cover. As the world warms, ice and snow will melt and thus reflect less sunlight back into space, having the effect of warming the Earth even more. So an initial warming leads to more warming, amplifying the effect of the initial warming.
Since we know both types of feedback exist, what we care about is the net effect -- does negative or positive feedback dominate? In every catastrophic forecast you have seen for global warming, in nearly every climate model the IPCC uses, the authors have assumed that the climate is dominated by strong positive feedbacks that multiply incremental warming from greenhouse gasses many times.
This is the result:
As a reminder, the green line is the warming from increases in atmospheric CO2 concentration solely from the greenhouse gas effect, without any feedbacks taken into account. It is generally agreed to be a warming rate of about 1.2C per doubling of CO2 concentrations, with which I and many (or most) science-based skeptics agree. The other lines, then, are a variety of forecasts for warming after feedbacks are taken into account. You can see that all these forecasts assume positive feedback, as the effect is multiplicative of the initial greenhouse gas warming (the pink, purple, and orange lines are approximately 3x, 5x, and 10x the green line, implying very high levels of positive feedback).
The pink line is the mean forecast from the 4th IPCC, implying a temperature sensitivity to CO2 of about 3C. The purple line is the high end of the IPCC forecast band, implying a temperature sensitivity of 5C. And the highest is not from a mathematical model per se, but from the mouth of Bill McKibben (sorry for the misspelling in the chart) who has on several occasions threatened that we could see as much as 10C of warming from CO2 by the end of the century.
Skeptics have pointed out a myriad of issues with the climate computer models that develop these forecasts, but I will leave those aside for now. Suffice it to say that the models exclude many important aspects of the climate and are subject to hand tuning that allows modellers to produce pretty much any output they like.
But I do want to say a few words about computer models and scientific proof. Despite what you will hear from the media, and even from the mouths of prominent alarmist scientists, computer models do not and cannot constitute "proof" of any sort. Computer models are merely tools we use to derive the predicted values of physical parameters from complex hypotheses. They are no different than the pen and paper computations an 18th century researcher might have made for the position of Saturn from Newton's celestial mechanics equations. The "proof" comes when we take these predicted values and compare them against actual measurements over time and find that they are or are not accurate predictions. Newton's laws were proved as his equations' outputs for Saturn's position were compared to Saturn's actual measured position (and in fact they were disproved, to a small extent, when Mercury's position did not accurately match and Einstein has to fix things a bit). Similarly, hypotheses about global warming will be proved or disproved when the predictions of various models are compared to actual temperatures.
So we can't really get much further until we get to actual observations of the climate, which we will address in the next several chapters. But I want to make sure that the two-part theory that leads to catastrophic global warming is clear.
This is the portion of the warming due to greenhouse gas theory:
As you can see, the portion due to greenhouse gas theory is relatively small and likely not catastrophic. The catastrophe comes from the second independent theory that the Earth's climate system is dominated by strong (very strong!) positive feedbacks.
It is the positive feedback that causes the catastrophe, not greenhouse gas theory. So in debating catastrophic man-made global warming theory, we should be spending most of our time debating the theory that the climate is dominated by strong positive feedbacks, rather than debating the greenhouse gas theory.
But in fact, this does not happen in the mainstream media. If you are an average consumer of climate news, I will be you have never heard a discussion in the media about this second theory.
And this second theory is far from settled. If on the "settled" scale from 1-10, greenhouse gas theory is an 8 or 9, this theory of strong positive feedbacks dominating the climate is about a 2. In fact, there is plenty of evidence that not only are scientists estimating feedbacks incorrectly, but that they don't even have the sign right and that net feedbacks may be negative.
This is a bit hard to communicate to a layman, but the positive feedbacks assumed by the most alarmist and catastrophic climate forecasts are very, very high. Way higher than one might expect in advance upon encountering a new system. This assumption of strong positive feedbacks is one that might even offend the sensibilities of the natural scientist. Natural systems that are long-term stable (and certainly for all its variation the climate system has remained in a pretty narrow range for millions and millions of years) are typically not dominated by positive feedbacks, they are dominated by negative feedbacks.
If in fact our climate temperature system is dominated by negative feedbacks, the future warming forecast would actually be below the green line:
OK, without getting in and criticizing the details of these models (which would by the way be a pointless wack-a-mole game because there are dozens of them) the best way to assess the validity of these various forecasts is to now consult actual observations. Which we will begin to do in our next chapter, part 4a on actual temperature measurements.
I need to try to be fair to Yelp. A reader sends me some second-hand comments from an ex-employee at Yelp:
He absolutely believes that there is no way for Yelp to hide or promote reviews just based on who the company is. This doesn't mean that they're not, of course. What my colleague says, though, is that the overriding criterion that they use to determine if a review should be "recommended" is if they can verify that the writer is a real person.
There are a couple ways you can do this, but two that will actually cause all of your past reviews to suddenly become recommended:
1) Work for Yelp--not really helpful, I know. I am told that Yelp will instantly fire anyone who leaves reviews while working there. But, once you leave, all of your reviews will always be recommended.
2) Connect your Yelp account to your Facebook, then connect with 100 friends.
There are other ways to have past reviews always come up recommended. If you post a review or several reviews, and, in aggregate, you get four interactions (they are marked as funny, cool, or useful), this will happen.
So I went back and looked. To see if one's reviews are in the non-recommended purgatory, you have to log out (Yelp will pretend to you that you are recommended until you log out**). Sure enough, all my 9 reviews seem to be in purgatory. In other words, any effort I expended on reviews has been wasted, because Yelp does not show them. I tend to write longer reviews, so apparently writing fewer more detailed reviews is not a practice Yelp wants to promote. Do they prefer folks who spam lots of short reviews? I can see how that may be, since more reviews bulk up Yelp's numbers.
I don't know what to make of this feedback. At one level, it seems right and makes sense. There are a lot of not recommended reviews where the review has just that one review. But not always. For example, for this store, reviewers with no picture, no name (just initials), just 2 total reviews and no friends are recommended, but someone who has a picture, a real name, 1 friend and 31 reviews is not. I have to say that either their algorithm has some purposely random element (to defeat reverse engineering) or else there are other factors involved than just the ones listed above. Also, some of the advice above simply has to be wrong. For example, the last sentence makes no sense since it is impossible to upvote or favorite reviews in not-recommended purgatory (they don't even give you the buttons to do so).
I will post some more reviews over time to see if I get pulled out of spam status by their computer, or if I am permanently exiled based on a corporate complaint.
** By the way, this could be the subject of a gripe in and of itself. It should not be so opaque that one's posts are all getting sent to the Yelp spam folder. It is kind of insulting to invest this effort and then find out later Yelp is trashing everything I write.
More recently, I have had calls from not one but two different attorneys who are representing Applied Underwriter customers. The one this morning was especially evocative -- he had years of experience as an attorney and litigating over contracts like this but thought he was crazy because he could not figure out the math on the Applied Underwriters statements until he read my post. I had had the exact same issue, almost in tears because I could not figure it out, until an industry insider explained to me that the numbers don't add up. After pages of step by step calculations, there is one step where they simply pull a number out of the air, essentially rendering irrelevant all the calculations that went before. I will respect their client confidentiality but say that the issues involved were very parallel to those I discussed in my article.
Feel free to contact me if you need help or are considering a policy with Applied Underwriters and I will lend you what knowledge I have.
On the list were Sabrina (CA), Big Pine Creek (CA), Cave Springs (AZ) and Sleepy Grass (NM). We always love getting positive feedback, of course, but are particularly thrilled in this case since the frequent criticism of private operation of public campgrounds is that private companies will somehow ruin the recreation areas for profit. Exactly how we would make money by destroying the natural beauty which draws paying visitors to these parks is never explained. But it is good to have confirmation that we private operators are doing a good job.
I didn't have any idea who the "Food Babe" was but from this article she sure seems to be yet another example. If you want to see an absolute classic of food babe "thinking", check out this article on flying. Seriously, I seldom insist you go read something but it is relatively short and you will find yourself laughing, I guarantee it.
Postscript: I had someone tell me the other day that I was inconsistent. I was on the side of science (being pro-vaccination) but against science (being pro-fossil fuel use). I have heard this or something like it come up in the vaccination debate a number of times, so a few thoughts:
The commenter is assuming their conclusion. Most people don't actually look at the science, so saying you are for or against science is their way of saying you are right or wrong.
The Luddites are indeed taking a consistent position here, and both "Food babe" and RFK Jr. represent that position -- they ascribe large, unproveable risks to mundane manmade items and totally discount the benefits of these items. This includes vaccines, fossil fuels, GMO foods, cell phones, etc.
I am actually with the science on global warming, it is just what the science says is not well-portrayed in the media. The famous 97% of scientists actually agreed with two propositions: That the world has warmed over the last century and that man has contributed to that warming. The science is pretty clear on these propositions and I agree with them. What I disagree with is that temperature sensitivity to a doubling of CO2 concentrations is catastrophic, on the order of 4 or 5C or higher, as many alarmist believe, driven by absurdly high assumptions of positive feedback in the climate system. But the science is very much in dispute about these feedback assumptions and thus on the amount of warming we should expect in the future -- in fact the estimates in scientific papers and the IPCC keep declining each year heading steadily for my position of 1.5C. Also, I dispute that things like recent hurricanes and the California drought can be tied to manmade CO2, and in fact the NOAA and many others have denied that these can be linked. In being skeptical of all these crazy links to global warming (e.g. Obama claims global warming caused his daughter's asthma attack), I am totally with science. Scientists are not linking these things, talking heads in the media are.
Stop calling me and other skeptics "climate deniers". No one denies that there is a climate. It is a stupid phrase.
I am willing, even at the risk of the obvious parallel that is being drawn to the Holocaust deniers, to accept the "denier" label, but it has to be attached to a proposition I actually deny, or that can even be denied.
As help in doing so, here are a few reminders (these would also apply to many mainstream skeptics -- I am not an outlier)
I don't deny that climate changes over time -- who could? So I am not a climate change denier
I don't deny that the Earth has warmed over the last century (something like 0.7C). So I am not a global warming denier
I don't deny that man's CO2 has some incremental effect on warming, and perhaps climate change (in fact, man effects climate with many more of his activities other than just CO2 -- land use, with cities on the one hand and irrigated agriculture on the other, has measurable effects on the climate). So I am not a man-made climate change or man-made global warming denier.
What I deny is the catastrophe -- the proposition that man-made global warming** will cause catastrophic climate changes whose adverse affects will outweigh both the benefits of warming as well as the costs of mitigation. I believe that warming forecasts have been substantially exaggerated (in part due to positive feedback assumptions) and that tales of current climate change trends are greatly exaggerated and based more on noting individual outlier events and not through real data on trends (see hurricanes, for example).
Though it loses some of this nuance, I would probably accept "man-made climate catastrophe denier" as a title.
** Postscript -- as a reminder, there is absolutely no science that CO2 can change the climate except through the intermediate step of warming. If you believe it is possible for CO2 to change the climate without there being warming (in the air, in the oceans, somewhere), then you have no right to call anyone else anti-science and you should go review your subject before you continue to embarrass yourself and your allies.
Here is the problem: There exists a highly dynamic, multi- multi- variable system. One input is changed. How much, and in what ways, did that change affect the system?
Here are two examples:
The government makes a trillion dollars in deficit spending to try to boost the economy. Did it do so? By how much? (This Reason article got me thinking about it)
Man's actions increase the amount of CO2 in the atmosphere. We are fairly confident that this has some warming effect, but how how much? There are big policy differences between the response to a lot and a little.
The difficulty, of course, is that there is no way to do a controlled study, and while one's studied variable is changing, so are thousands, even millions of others. These two examples have a number of things in common:
We know feedbacks play a large role in the answer, but the system is so hard to pin down that we are not even sure of the sign, much less the magnitude, of the feedback. Do positive feedbacks such as ice melting and cloud formation multiply CO2 warming many times, or is warming offset by negative feedback from things like cloud formation? Similarly in the economy, does deficit spending get multiplied many times as the money gets respent over and over, or is it offset by declines in other categories of spending like business investment?
In both examples, we have recent cases where the system has not behaved as expected (at least by some). The economy remained at best flat after the recent stimulus. We have not seen global temperatures increase for 15-20 years despite a lot of CO2 prodcution. Are these evidence that the hypothesized relationship between cause and effect does not exist (or is small), or simply evidence that other effects independently drove the system in the opposite direction such that, for example, the economy would have been even worse without the stimulus or the world would have cooled without CO2 additions.
In both examples, we use computer models not only to predict the future, but to explain the past. When the government said that the stimulus had worked, they did so based on a computer model whose core assumptions were that stimulus works. In both fields, we get this sort of circular proof, with the output of computer models that assume a causal relationship being used to prove the causal relationship
So, for those of you who may think that we are at the end of math (or science), here is a class of problem that is clearly, just from these two examples, enormously important. And we cannot solve it -- we can't even come close, despite the hubris of Paul Krugman or Michael Mann who may argue differently. We are explaining fire with Phlogiston.
I have no idea where the solution lies. Perhaps all we can hope for is a Goedel to tell us the problem is impossible to solve so stop trying. Perhaps the seeds of a solution exist but they are buried in another discipline (God knows the climate science field often lacks even the most basic connection to math and statistics knowledge).
Maybe I am missing something, but who is even working on this? By "working on it" I do not mean trying to build incrementally "better" economics or climate models. Plenty of folks doing that. But who is working on new approaches to tease out relationships in complex multi-variable systems?
Studies are still mixed about the direction of feedbacks, with as many showing negative as positive feedback. No study that I have seen supports positive feedbacks as large as those used in many climate models
As a result, climate models are systematically exaggerating warming (from Roy Spenser, click to enlarge). Note that the conformance through 1998 is nothing to get excited about -- most models were rewritten after that date and likely had plugs and adjustments to force the historical match.
To defend the forecasts, modellers are increasingly blaming natural effects like solar cycles on the miss, natural effects that the same modellers insisted were inherently trivial contributions when skeptics used them to explain part of the temperature rise from 1978-1998.
By the way, 1978-1998 is still the only period since 1940 when temperatures actually rose, such that increasingly all catastrophic forecasts rely on extrapolations from this one 20-year period. Seriously, look for yourself.
Alarmists are still blaming every two or three sigma weather pattern on CO2 on global warming (polar vortex, sigh).
Even when weather is moderate, media hyping of weather events has everyone convinced weather is more extreme, when it is not. (effect explained in context of Summer of the Shark)
My temperature forecast from 2007 still is doing well. Back in '07 I regressed temperature history to a linear trend plus a sine wave.
The journal Nature has finally caught up to the fact that ocean cycles may influence global surface temperature trends. Climate alarmists refused to acknowledge this when temperatures were rising and the cycles were in their warm phase, but now are grasping at these cycles for an explanation of the 15+ year hiatus in warming as a way to avoid abandoning high climate sensitivity assumptions (ie the sensitivity of global temperatures to CO2 concentrations, which IMO are exaggerated by implausible assumptions of positive feedback).
I cannot find my first use of this chart, but here is a version I was using over 5 years ago. I know I was using it long before that
It will be interesting to see if they find a way to blame cycles for cooling in the last 10-15 years but not for the warming in the 80's and 90's.
Next step -- alarmists have the same epiphany about the sun, and blame non-warming on a low solar cycle without simultaneously giving previous high solar cycles any credit for warming. For Nature's benefit, here is another chart they might use (from the same 2008 blog post). The number 50 below is selected arbitrarily, but does a good job of highlighting solar activity in the second half of the 20th century vs. the first half.
Dr. Roy Spencer has compared the output of 73 climate models to actual recent temperature measurements. He has focused on temperatures in the mid-troposphere in the tropics -- this is not the same as global surface temperatures but is of course related. The reason for this focus is 1) we have some good space-based data sources for temperatures in this region that don't suffer the same biases and limitations as surface thermometers and 2) This is the zone that catastrophic anthropogenic global warming theory says should be seeing the most warming, due to positive feedback effects of water vapor. The lines are the model results for temperatures, the dots are the actuals.
I continue to suspect that the main source of disagreement is that the models’ positive feedbacks are too strong…and possibly of even the wrong sign.
The lack of a tropical upper tropospheric hotspot in the observations is the main reason for the disconnect in the above plots, and as I have been pointing out this is probably rooted in differences in water vapor feedback. The models exhibit strongly positive water vapor feedback, which ends up causing a strong upper tropospheric warming response (the “hot spot”), while the observation’s lack of a hot spot would be consistent with little water vapor feedback.
The warming from manmade CO2 without positive feedbacks would be about 1.3C per doubling of CO2 concentrations, a fraction of the 3-10C predicted by these climate models. If the climate, like most other long-term stable natural systems, is dominated by negative feedbacks, the sensitivity would be likely less than 1C. Either way, the resulting predicted warming from manmade CO2 over the rest of this century would likely be less than 1 degree C.
I have not had the time to write much about climate of late, but after several years of arguing over emails (an activity with which I quickly grew bored), the field is heating up again, as it were.
As I have said many times, the key missing science in the whole climate debate centers around climate sensitivity, or the expected temperature increase from a doubling of CO2 concentrations in the atmosphere (as reference, CO2 in the industrial age has increased from about 270 ppm to close to 400 ppm, or about half a doubling).
In my many speeches and this video (soon to be updated, if I can just find the time to finish it), I have argued that climate computer models have exaggerated climate sensitivity. This Wikipedia page is a pretty good rehash of the alarmist position on climate sensitivity. According to this standard alarmist position, here is the distribution of studies which represent the potential values for sensitivity - note that virtually none are below 2°C.
The problem is that these are all made with computer models. They are not based on observational data. Yes, all these models nominally backcast history reasonably correctly (look at that chart above and think about that statement for a minute, see if you can spot the problem). But many an investor has been bankrupted by models that correctly backcast history. The guys putting together tranches of mortgages for securities all had models. What has been missing is any validation of these numbers with actual, you know, observations of nature.
Way back 6 or 7 years ago I began taking these numbers and projecting them backwards. In other words, if climate sensitivity is really, say, at 4°C, then what should that imply about historical temperature increases since the pre-industrial age? Let's do a back of the envelope with the 4°C example. We are at just about half of a doubling of CO2 concentrations, but since sensitivity is a logarithmic curve, this implies we should have seen about 57% of the temperature increase that we would expect from a full doubling of CO2. Applied to the 4°C sensitivity figure, this means that if sensitivity really is 4°C, we should have seen a 2.3°C global temperature increase over the last 150 years or so. Which we certainly have not -- instead we have seen 0.8°C from all causes, only one of which is CO2.
So these high sensitivity models are over-predicting history. Even a 2°C sensitivity over-predicts the amount of warming we have seen historically. So how do they make the numbers fit? The models are tuned and tweaked with a number of assumptions. Time delays are one -- the oceans act as a huge flywheel on world temperatures and tend to add large lags to getting to the ultimate sensitivity figure. But even this was not enough for high sensitivity models to back-cast accurately. To make their models accurately predict history, their authors have had to ignore every other source of warming (which is why they have been so vociferous in downplaying the sun and ocean cycles, at least until they needed these to explain the lack of warming over the last decade). Further, they have added man-made cooling factors, particularly from sulfate aerosols, that offset some of the man-made warming with man-made cooling.
Which brings us back to the problem I hinted at with the chart above and its distribution of sensitivities. Did you spot the problem? All these models claim to accurately back-cast history, but how can a model with a 2°C sensitivity and an 11°C sensitivity both accurately model the last 100 years? One way they do it is by using a plug variable, and many models use aerosol cooling as the plug. Why? Well, unlike natural cooling factors, it is anthropogenic, so they can still claim catastrophe once we clean up the aerosols. Also, for years the values of aerosol cooling were really uncertain, so ironically the lack of good science on them allowed scientists to assume a wide range of values. Below is from a selection of climate models, and shows that the higher the climate sensitivity in the model, the higher the negative forcing (cooling) effect assumed from aerosols. This has to be, or the models would not back-cast.
The reasons that these models had such high sensitivities is that they assumed the climate was dominated by net positive feedback, meaning there were processes in the climate system that would take small amounts of initial warming from CO2 and multiply them many times. The generally accepted value for sensitivity without these feedbacks is 1.2°C or 1.3°C (via work by Michael Mann over a decade ago). So all the rest of the warming, in fact the entire catastrophe that is predicted, comes not from CO2 but from this positive feedback that multiplies this modest 1.2°C many times.
I have argued, as have many other skeptics, that this assumption of net positive feedback is not based on good science, and in fact most long-term stable natural systems are dominated by negative feedback (note that you can certainly identify individual processes, like ice albedo, that are certainly a positive feedback, but we are talking about the net effect of all such processes combined). Based on a skepticism about strong positive feedback, and the magnitude of past warming in relation to CO2 increases, I have always argued that the climate sensitivity is perhaps 1.2°C and maybe less, but that we should not expect more than a degree of warming from CO2 in the next century, hardly catastrophic.
One of the interesting things you might notice from the Wikipedia page is that they do not reference any sensitivity study more recent than 2007 (except for a literature review in 2008). One reason might be that over the last 5 years there have been a series of studies that have begun to lower the expected value of the sensitivity number. What many of these studies have in common is that they are based on actual observational data over the last 100 years, rather than computer models (by the way, for those of you who like to fool with Wikipedia, don't bother on climate pages -- the editors of these pages will reverse any change attempting to bring balance to their articles in a matter of minutes). These studies include a wide range of natural effects, such as ocean cycles, left out of the earlier models. And, as real numbers have been put on aerosol concentrations and their effects, much lower values have been assigned to aerosol cooling, thus reducing the amount of warming that could be coming from CO2.
Recent studies based on observational approaches are coming up with much lower numbers. ECS, or equilibrium climate sensitivity numbers (what we would expect in temperature increases if we waited hundreds or thousands of years for all time delays to be overcome) has been coming in between 1.6°C and 2.0°C. Values for TCS, or transient climate sensitivity, or what we might expect to see in our lifetimes, has been coming in around 1.3°C per doubling of CO2 concentrations.
Yesterday saw the publication of a paper in a prestigious journal,Nature Geoscience, from a high-profile international team led by Oxford scientists. The contributors include 14 lead authors of the forthcoming Intergovernmental Panel on Climate Change scientific report; two are lead authors of the crucial chapter 10: professors Myles Allen and Gabriele Hegerl.
So this study is about as authoritative as you can get. It uses the most robust method, of analysing the Earth’s heat budget over the past hundred years or so, to estimate a “transient climate response†— the amount of warming that, with rising emissions, the world is likely to experience by the time carbon dioxide levels have doubled since pre-industrial times.
The most likely estimate is 1.3C. Even if we reach doubled carbon dioxide in just 50 years, we can expect the world to be about two-thirds of a degree warmer than it is now, maybe a bit more if other greenhouse gases increase too….
This is still tough work, likely with a lot of necessary improvement, because it is really hard to dis-aggregate multiple drivers in such a complex system. There may, for example, be causative variables we don't even know about so by definition were not included in the study. However, it is nice to see that folks are out there trying to solve the problem with real observations of Nature, and not via computer auto-eroticism.
Postscript: Alarmists have certainly not quit the field. The current emerging hypothesis to defend high sensitivities is to say that the heat is going directly into the deep oceans. At some level this is sensible -- the vast majority of the heat carrying capacity (80-90%) of the Earth's surface is in the oceans, not in the atmosphere, and so they are the best place to measure warming. Skeptics have said this for years. But in the top 700 meters or so of the ocean, as measured by ARGO floats, ocean heating over the last 10 years (since these more advanced measuring devices were launched) has been only about 15% of what we might predict with high sensitivity models. So when alarmists say today that the heat is going into the oceans, they say the deep oceans -- ie that the heat from global warming is not going into the air or the first 700 meters of ocean but directly into ocean layers beneath that. Again, this is marginally possible by some funky dynamics, but just like the aerosol defense that has fallen apart of late, this defense of high sensitivity forecasts is completely unproven. But the science is settled, of course.
As I have read Mr. Ridley over the years, I have found him to have staked out a position on anthropogenic climate change very similar to mine (we are both called "lukewarmers" because we accept that man's addition of greenhouse gasses to the atmosphere warms the world incrementally but do not accept catastrophic positive-feedback driven catastrophic warming forecasts).
I generally find room to nitpick even those whom I largely agree with, but from my perspective, this piece by Ridley is dead on. (thanks to a reader for the link)
For years, readers of this site know that I have argued that:
CO2 is indeed a greenhouse gas, and since man is increasing its atmospheric concentration, there is likely some anthropogenic contribution to warming
Most forecasts, including those of the IPCC, grossly exaggerate temperature sensitivity to CO2 by assuming absurd levels of net positive feedback in the climate system
Past temperature changes are not consistent with high climate sensitivities
Recently, there have been a whole spate of studies based on actual observations rather than computer models that have been arriving at climate sensitivity numbers far below the IPCC number. While the IPCC settled on 3C per doubling of CO2, it strongly implied that all the risk was to the upside, and many other prominent folks who typically get fawning attention in the media have proposed much higher numbers.
In fact, recent studies are coming in closer to 1.5C - 2C. I actually still think these numbers will turn out to be high. For several years now my money has been on a number from 0.8 to 1 C, sensitivity numbers that imply a small amount of negative feedback rather than positive feedback, a safer choice in my mind since most long-term stable natural systems are dominated by negative feedback.
Anyway, in an article that was as surprising as it is welcome, NY Times climate writer Andy Revkin has quite an article recently, finally acknowledging in the paper of record that maybe those skeptics who have argued for alower sensitivity number kind of sort of have a point.
“Worse than we thought” has been one of the most durable phrases lately among those pushing for urgent action to stem the buildup of greenhouse gases linked to global warming.
By the way, this is the only metric that matters. All the other BS about "climate change" and "dirty weather" are meaningless without warming. CO2 cannot change the climate or raise sea levels or any of that other stuff by any mechanism we understand or that has even been postulated, except via warming. Anyway, to continue:
There’s still plenty of global warming and centuries of coastal retreats in the pipeline, so this is hardly a “benign” situation, as some have cast it.
But while plenty of other climate scientists hold firm to the idea that the full range of possible outcomes, including a disruptively dangerous warming of more than 4.5 degrees C. (8 degrees F.), remain in play, it’s getting harder to see why the high-end projections are given much weight.
In fact, there is an accumulating body of reviewed, published researchshaving away the high end of the range of possible warming estimates from doubled carbon dioxide levels. Chief among climate scientists critical of the high-sensitivity holdouts is James Annan, an experienced climate modeler based in Japan who contributed to the 2007 science report from the Intergovernmental Panel on Climate Change. By 2006, he was already diverging from his colleagues a bit.
The whole thing is good. Of course, for Revkin, this is no excuse to slow down all the actions supposedly demanded by global warming, such as substantially raising the price and scarcity of hydrocarbons. Which to me simply demonstrates that people who have been against hydrocarbons have always been against them as an almost aesthetic choice, and climate change and global warming were mere excuses to push the agenda. After all, as there certainly are tradeoffs to limiting economic growth and energy use and raising the price of energy, how can a reduction in postulated harms from fossil fuels NOT change the balance point one chooses in managing their use?
In this case several factors not directly related to climate change converged to generate the event. On Sandy’s way north, it ran into a vast high-pressure system over Canada, which prevented it from continuing in that direction, as hurricanes normally do, and forced it to turn west. Then, because it traveled about 300 miles over open water before making landfall, it piled up an unusually large storm surge. An infrequent jet-stream reversal helped maintain and fuel the storm. As if all that weren’t bad enough, a full moon was occurring, so the moon, the earth, and the sun were in a straight line, increasing the moon’s and sun’s gravitational effects on the tides, thus lifting the high tide even higher. Add to this that the wind and water, though not quite at hurricane levels, struck an area rarely hit by storms of this magnitude so the structures were more vulnerable and a disaster occurred.
The last one is a key for me -- you have cities on the Atlantic Ocean that seemed to build and act as if they were immune from ocean storms. From my perspective growing up on the gulf coast, where one practically expects any structure one builds on the coast to be swept away every thirty years or so, this is a big contributing factor no one really talks about.
Silver chooses to focus on individuals working in a tight competition and their motives and individual biases, which he understands and explains well. For him, modeling is a man versus wild type thing, working with your wits in a finite universe to win the chess game.
He spends very little time on the question of how people act inside larger systems, where a given modeler might be more interested in keeping their job or getting a big bonus than in making their model as accurate as possible.
In other words, Silver crafts an argument which ignores politics. This is Silver’s blind spot: in the real world politics often trump accuracy, and accurate mathematical models don’t matter as much as he hopes they would....
My conclusion: Nate Silver is a man who deeply believes in experts, even when the evidence is not good that they have aligned incentives with the public.
Distrust the experts
Call me “asinine,” but I have less faith in the experts than Nate Silver: I don’t want to trust the very people who got us into this mess, while benefitting from it, to also be in charge of cleaning it up. And, being part of the Occupy movement, I obviously think that this is the time for mass movements.
Like Ms. O'Neill, I distrust "authorities" as well, and have a real problem with debates that quickly fall into dueling appeals to authority. She is focusing here on overt politics, but subtler pressure and signalling are important as well. For example, since "believing" in climate alarmism in many circles is equated with a sort of positive morality (and being skeptical of such findings equated with being a bad person) there is an underlying peer pressure that is different from overt politics but just as damaging to scientific rigor. Here is an example from the comments at Judith Curry's blog discussing research on climate sensitivity (which is the temperature response predicted if atmospheric levels of CO2 double).
While many estimates have been made, the consensus value often used is ~3°C. Like the porridge in “The Three Bears”, this value is just right – not so great as to lack credibility, and not so small as to seem benign.
Huybers (2010) showed that the treatment of clouds was the “principal source of uncertainty in models”. Indeed, his Table I shows that whereas the response of the climate system to clouds by various models varied from 0.04 to 0.37 (a wide spread), the variation of net feedback from clouds varied only from 0.49 to 0.73 (a much narrower relative range). He then examined several possible sources of compensation between climate sensitivity and radiative forcing. He concluded:
“Model conditioning need not be restricted to calibration of parameters against observations, but could also include more nebulous adjustment of parameters, for example, to fit expectations, maintain accepted conventions, or increase accord with other model results. These more nebulous adjustments are referred to as ‘tuning’.” He suggested that one example of possible tuning is that “reported values of climate sensitivity are anchored near the 3±1.5°C range initially suggested by the ad hoc study group on carbon dioxide and climate (1979) and that these were not changed because of a lack of compelling reason to do so”.
Huybers (2010) went on to say:
“More recently reported values of climate sensitivity have not deviated substantially. The implication is that the reported values of climate sensitivity are, in a sense, tuned to maintain accepted convention.”
Translated into simple terms, the implication is that climate modelers have been heavily influenced by the early (1979) estimate that doubling of CO2 from pre-industrial levels would raise global temperatures 3±1.5°C. Modelers have chosen to compensate their widely varying estimates of climate sensitivity by adopting cloud feedback values countering the effect of climate sensitivity, thus keeping the final estimate of temperature rise due to doubling within limits preset in their minds.
There is a LOT of bad behavior out there by models. I know that to be true because I used to be a modeler myself. What laymen do not understand is that it is way too easy to tune and tweak and plug models to get a preconceived answer -- and the more complex the model, the easier this is to do in a non-transparent way. Here is one example, related again to climate sensitivity
When I looked at historic temperature and CO2 levels, it was impossible for me to see how they could be in any way consistent with the high climate sensitivities that were coming out of the IPCC models. Even if all past warming were attributed to CO2 (a heroic assertion in and of itself) the temperature increases we have seen in the past imply a climate sensitivity closer to 1 rather than 3 or 5 or even 10 (I show this analysis in more depth in this video).
My skepticism was increased when several skeptics pointed out a problem that should have been obvious. The ten or twelve IPCC climate models all had very different climate sensitivities — how, if they have different climate sensitivities, do they all nearly exactly model past temperatures? If each embodies a correct model of the climate, and each has a different climate sensitivity, only one (at most) should replicate observed data. But they all do. It is like someone saying she has ten clocks all showing a different time but asserting that all are correct (or worse, as the IPCC does, claiming that the average must be the right time).
The answer to this paradox came in a 2007 study by climate modeler Jeffrey Kiehl. To understand his findings, we need to understand a bit of background on aerosols. Aerosols are man-made pollutants, mainly combustion products, that are thought to have the effect of cooling the Earth’s climate.
What Kiehl demonstrated was that these aerosols are likely the answer to my old question about how models with high sensitivities are able to accurately model historic temperatures. When simulating history, scientists add aerosols to their high-sensitivity models in sufficient quantities to cool them to match historic temperatures. Then, since such aerosols are much easier to eliminate as combustion products than is CO2, they assume these aerosols go away in the future, allowing their models to produce enormous amounts of future warming.
Specifically, when he looked at the climate models used by the IPCC, Kiehl found they all used very different assumptions for aerosol cooling and, most significantly, he found that each of these varying assumptions were exactly what was required to combine with that model’s unique sensitivity assumptions to reproduce historical temperatures. In my terminology, aerosol cooling was the plug variable.
By the way, this aerosol issue is central to recent work that is pointing to a much lower climate sensitivity to CO2 than has been reported in past IPCC reports.
I know I hammer this home constantly, but it is often worth a reminder. The issue in the scientific debate over catastrophic man-made global warming theory is not whether CO2 is a greenhouse gas, or even the approximate magnitude of warming from CO2 directly, but around feedbacks. Patrick Moore, Greenpeace founder, said it very well:
What most people don't realize, partly because the media never explains it, is that there is no dispute over whether CO2 is a greenhouse gas, and all else being equal would result in a warming of the climate. The fundamental dispute is about water in the atmosphere, either in the form of water vapour (a gas) or clouds (water in liquid form). It is generally accepted that a warmer climate will result in more water evaporating from the land and sea and therefore resulting in a higher level of water in the atmosphere, partly because the warmer the air is the more water it can hold. All of the models used by the IPCC assume that this increase in water vapour will result in a positive feedback in the order of 3-4 times the increase in temperature that would be caused by the increase in CO2 alone.
Many scientists do not agree with this, or do not agree that we know enough about the impact of increased water to predict the outcome. Some scientists believe increased water will have a negative feedback instead, due to increased cloud cover. It all depends on how much, and a t what altitudes, latitudes and times of day that water is in the form of a gas (vapour) or a liquid (clouds). So if a certain increase in CO2 would theoretically cause a 1.0C increase in temperature, then if water caused a 3-4 times positive feedback the temperature would actually increase by 3-4C. This is why the warming predicted by the models is so large. Whereas if there was a negative feedback of 0.5 times then the temperature would only rise 0.5C.
My slightly lengthier discussions of this same issue are here and here.
My Forbes column is up this week. I really did not want to write about climate, but when Forbes conctributor Steve Zwick wrote this, I had to respond
We know who the active denialists are – not the people who buy the lies, mind you, but the people who create the lies. Let’s start keeping track of them now, and when the famines come, let’s make them pay. Let’s let their houses burn. Let’s swap their safe land for submerged islands. Let’s force them to bear the cost of rising food prices.
They broke the climate. Why should the rest of us have to pay for it?
The bizarre threats and ad hominem attacks have to stop. Real debate is necessary based on an assumption that our opponents may be wrong, but are still people of good will. And we need to debate what really freaking matters:
Instead of screwing around in the media trying to assign blame for the recent US heat wave to CO2 and threatening to burn down the houses of those who disagree with us, we should be arguing about what matters. And the main scientific issue that really matters is understanding climate feedback. I won't repeat all of the previous posts (see here and here), but this is worth repeating:
Direct warming from the greenhouse gas effect of CO2 does not create a catastrophe, and at most, according to the IPCC, might warm the Earth another degree over the next century. The catastrophe comes from the assumption that there are large net positive feedbacks in the climate system that multiply a small initial warming from CO2 many times. It is this assumption that positive feedbacks dominate over negative feedbacks that creates the catastrophe. It is telling that when prominent supporters of the catastrophic theory argue the science is settled, they always want to talk about the greenhouse gas effect (which most of us skeptics accept), NOT the positive feedback assumption. The assumption of net positive climate feedback is not at all settled -- in fact there is as much evidence the feedback is net negative as net positive -- which may be why catastrophic theory supporters seldom if ever mention this aspect of the science in the media.
I said I would offer a counter-proposal to Mr. Zwick's that skeptics bear the costs of climate change. I am ready to step up to the cost of any future man-made climate change if Mr. Zwick is ready to write a check for the lost economic activity and increased poverty caused by his proposals. We are at an exciting point in history where a billion people, or more, in Asia and Africa and Latin America are at the cusp of emerging from millenia of poverty. To do so, they need to burn every fossil fuel they can get their hands on, not be forced to use rich people's toys like wind and solar. I am happy to trade my home for an imaginary one that Zwick thinks will be under water. Not only is this a great way to upgrade to some oceanfront property, but I am fully confident the crazy Al Gore sea level rise predictions are a chimera, since sea levels have been rising at a fairly constant rate since the end of the little ice age.. In return, perhaps Mr. Zwick can trade his job for one in Asia that disappears when he closes the tap on fossil fuels?
I encourage you to read it all, including an appearance by the summer of the shark.
On the positive side for Facebook, it is the only platform we have tried, from static web pages to blogs to Google to whatever, where we really get a good real-time interaction going with our campground customers. Its an easy platform for them to ask questions, provide feedback, and upload useful content about the campground (from pictures to reviews to videos). Many of my older employees are flummoxed by even the simplest computer tasks (I have had folks it has taken days of effort to teach how to get into their corporate Gmail account) but it is relatively easy to learn how to add an update or answer a query on a Facebook page (and by "page" I mean the corporate or business pages like this one here: http://www.facebook.com/RockCreekCanyon, not one's individual page).
But here is the problem: The Facebook staff changes FB's layout and user interface faster than a sugar-overloaded ADD 7-year-old gets tired of a new toy. I swear they have no reason for some of the changes other than "we're kind of bored with the user interface staying the same more than 3 months and some junior guy coded this timeline thing so let's make him feel good and put it up".
The shifting user interface is a training nightmare for my non-computer savvy managers. What used to be tabs across the top are now text links on the left. The Page admin panel changes almost every time I log on. And don't even get me started on the simply stupid dueling column format of the new pages, or the fact that useless information like number of people who liked the site in a given month take up enormous amounts of the timeline's real estate now. Just look at the page I linked above. For the first 2-3 scrolls, the right hand column is different data than the left column, but then suddenly it becomes an alternating home for data that at the top only showed up on the left. I am told that I can now pin a status update to the top, which will be nice, but at the cost of losing the custom landing page we used to have.
And woe be to he who actually develops for the platform, because he may soon find out that it all became wasted effort at the next over-caffeinated random user interface change. I just did a tiny, minor bit of coding (less than a few hours) that takes my page administrators' status updates and posts them as a news feed on our web site (ie here for the FB page above). I could do more interesting things but I have absolutely no confidence that, for example, the FB page RSS feed I used will still be supported tomorrow.
One of the world’s most widely respected climatologists, James Hansen, director of NASA-GISS, which focuses on the study of earth’s climate for the space agency, testified to Congress in 2008 that the CEOs of fossil fuel companies (who, according to various professional reporting have been promoting this and other misleading messages about global warming in conjunction with ideological groups trying to prevent government regulation) “knew what they were doing” and, as stated in his written testimony to Congress in 2008, were guilty of “high crimes against humanity and nature.”
Hansen tells ABC News — in a phone call from the U.K. where he’s been traveling — that he used that highly charged phrase, crime against humanity, “not only for dramatic effect, but also because it is accurate, given the enormous scale of the consequences to humanity” if manmade global warming is not somehow stopped and reversed.
“It wasn’t only aimed at the fossil fuel CEOs,” Hansen added on the phone. “This also applies to politicians who pretend the global warming is not manmade.”....
“Crimes Against Humanity” is a category of culpability that found currency in the last century as a label for such atrocities as genocide, including the Nazi Holocaust.
This is a grave accusation, laden with great emotion, but it has not been made lightly — rather with extensive study and forethought.


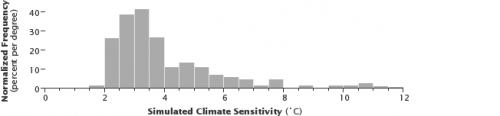
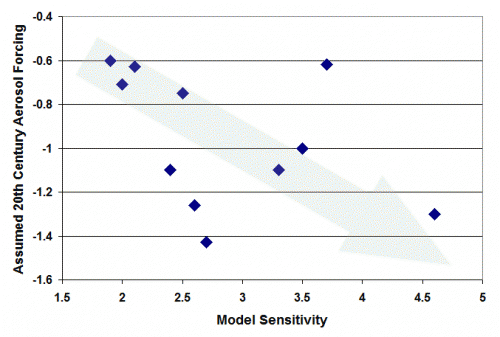
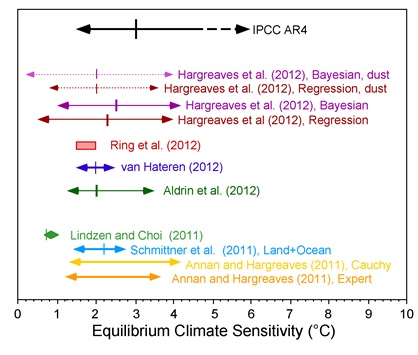