Archive for the ‘Climate’ Category.

Why Most Clean Energy R&D Investment is Stupid

We already have an economic, utility-scale electrical generation technology that does not produce CO2 -- nuclear power.  We do not have a second choice that is anywhere close to ready.  Wind is stupid, for reasons I have written about before.   Solar has its uses and I am all for the march of technology on solar panels.  But they are not going to keep the world's economy growing or, more importantly, prevent wholesale poverty and starvation and misery from energy shortages.

Most peoples' negative perceptions of nuclear come because the technology that is still in use is over 60 years old.  It is not one generation out of date but two or three behind the capabilities that currently exist to build safe, clean reactors. I have for years made the argument that government forcing of certain endeavors (nuclear power, space flight, transcontinental railroad) ahead of their natural development curve actually tends to set back the commercial development of them, and I think this was the case with nuclear.  To the extent that waste and safety problems persist with nuclear (and they really don't), R&D to solve them would be much more productive and less expensive than investments in Solyndra.

Of course we probably won't do this, because "knuckling under to the irrational fears of your Left-leaning political base" is the new definition of "following the science."

By the way, here is a way to think about the nuclear waste problem:  We all pay attention to nuclear waste because it and its negative effects are concentrated in small, heavily-impacted sites.  We don't pay attention to coal-burning waste, or didn't until recently, because it is distributed all around the world's atmosphere.  But I would argue the nuclear waste problem is much better, because it is much easier to mitigate harmful problems in a 100-acre site, rather than in the entire Earth's atmosphere.**


**Postscript -- pretty sure I first heard this expressed way back in the late 1970s, when US energy policy (under both Ford and Carter) was to promote coal, even to the extent of banning new power plants using cleaner fuels.  I wish I can remember who said it and give them credit because it really was prescient.

A Good Example of the CO2 Abatement "Stupid Stuff"

In my transpartisan climate plan the other day, I wrote this:

Point 3:  Eliminate all the stupid stuff

Oddly enough, this might be the hardest part politically because every subsidy, no matter how idiotic, has a hard core of beneficiaries who will defend it to the death -- this the the concentrated benefits, dispersed cost phenomena that makes it hard to change many government programs.  But never-the-less I propose that we eliminate all the current Federal subsidies, mandates, and prohibitions that have been justified by climate change. Ethanol rules and mandates, solar subsidies, wind subsidies, EV subsidies, targeted technology investments, coal plant bans, pipeline bans, drilling bans -- it all should go.  The carbon tax does the work.

So what do I mean by "stupid stuff."  Well a good place to start is solar roads, but I have already flogged that not-dead-enough-yet horse many times. So let's find a new example -- cash for clunkers.  The original cash-for-clunkers program that paid fixed government payments for old cars that would then be destroyed was billed as both a stimulus (sells cars!) and a CO2 reduction (newer cars mostly all more efficient than older cars).

In fact, it did neither.  It turned out that the stimulus was virtually non-existent, as it just pulled forward sales that were already going to happen.  And while there might have been a teenie bit of CO2 reduction, it occurred at ridiculously high cost-per-ton (meaning the same investment in any number of other approaches would have reduced a lot more CO2).

Incredibly, given all this, Kevin Drum wrote recently:

Cash for Clunkers! My favorite stimulus program of all time. Sure, I agree with the experts who say that it’s not all that great purely as stimulus, but as a way of making stimulus popular it couldn’t be beat. More like this, please.

This is the man who, on not one but two occasions, responded to a detailed critique of mine on something he wrote by saying he had "science" on his side.  Are these guys even trying any more?

Repost for the New Administration: Trans-partisan Plan #1: Addressing Man-Made Global Warming With A Plan That Could Be Supported By Both Democrats and Republicans

By the way, drafts of Biden's plans released so far has him doing almost the polar opposite of every step I suggest.  The cancellation of individual pipeline projects is just stupid political micro-managing to absolutely no benefit.  (First published September, 2018)

While I am not deeply worried about man-made climate change, I am appalled at all the absolutely stupid, counter-productive things the government has implemented in the name of climate change, all of which have costly distorting effects on the economy while doing extremely little to affect man-made greenhouse gas production.  For example:

Even when government programs do likely have an impact of CO2, they are seldom managed intelligently.  For example, the government subsidizes solar panel installations, presumably to reduce their cost to consumers, but then imposes duties on imported panels to raise their price (indicating that the program has become more of a crony subsidy for US solar panel makers, which is typical of these types of government interventions).  Obama's coal power plan, also known as his war on coal, will certainly reduce some CO2 from electricity generation but at a very high cost to consumers and industries.  Steps like this are taken without any idea of whether this is the lowest cost approach to reducing CO2 production -- likely it is not given the arbitrary aspects of the program.

These policy mess is also an opportunity -- it affords us the ability to substantially reduce CO2 production at almost no cost.

The Plan

Point 1: Impose a Federal carbon tax on fuel.

I am open to a range of actual tax amounts, as long as point #2 below is also part of the plan.  Something that prices CO2 between $25 and $45 a ton seems to match the mainstream estimates of the social costs of CO2.  I think methane's greenhouse effects are exaggerated, but one could make an adjustment to the natural gas tax numbers to take into account methane leakage in the production chain.   I am even open to making the tax=0 on biofuels given these fuels are recycling carbon from the atmosphere.

So what is the best way to reduce CO2 -- by substituting gas for coal?   By more conservation?  By solar, or wind?  With biofuels?  With a carbon tax, we don't have to figure it out or have politicians picking winners.  This is why a Pigovian tax on carbon in fuels is going to be the most efficient possible way to reduce CO2 production.   Different approaches will be tested in the marketplace.  Cap and trade could theoretically do the same thing, but while this worked well in some niche markets (like SO2 emissions), it has not worked at all in European markets for CO2.   There has just been too many opportunities for cronyism, too much weird accounting for things like offsets that is hard to do well, and too much temptation to pick winners and losers.

When I first crafted early drafts of this plan several years ago, I had assumed that Progressives championed a carbon tax for the reasons I listed above, ie that it is the most efficient means to allow markets to reduce emissions.  However, the referendum a couple of years ago in Washington State demonstrated that many Progressives may not understand this at all.  You can read a lot more about this debate here.  I fail the ideological Turing test on this one, because I don't know if the Progressives who were strongly for CO2 reduction but opposed the Washington State carbon tax did so because they did not understand economics or because they cared less about global warming than funding other Progressive causes.

Point 2:  Offset 100% of carbon tax proceeds against the payroll tax

Yes, there are likely many politicians, given their incentives, that would love a big new pool of money they could use to send largess, from more health care spending to more aircraft carriers, to their favored constituent groups.  But we simply are not going to get Conservatives (and libertarians) on board for a net tax increase, particularly one to address an issue folks on the Right may not agree is an issue at all.  So our plan will use carbon tax revenues to reduce other Federal taxes.

I think the best choice would be to reduce the payroll tax.  Why?  Because, the carbon tax will necessarily be regressive (as are most consumption taxes) and the most regressive other major Federal tax we have are payroll taxes.  Offsetting income taxes would likely be a non-starter on the Left, as no matter how one structures the tax reduction the rich would get most of it since they pay most of the income taxes.

There is another benefit of reducing the payroll tax -- it would mean that we are replacing a consumption tax on labor with a consumption tax on fuel. It is always dangerous to make gut-feel assessments of complex systems like the economy, but my sense is that this swap might even have net benefits for the economy -- so much so that we might want to do it even if there was no such thing as greenhouse gas warming.  In theory, labor and fuel are economically equivalent in that they are both production raw materials. But in practice, they are treated entirely differently by the public.   Few people care about the full productive employment of our underground fuel reserves, but nearly everybody cares about the full productive employment of our labor force.   After all, for most people, the primary single metric of economic health is the unemployment rate.  So replacing a disincentive to hire with a disincentive to use fuel could well be popular.

Point 3:  Eliminate all the stupid stuff

Oddly enough, this might be the hardest part politically because every subsidy, no matter how idiotic, has a hard core of beneficiaries who will defend it to the death -- this the the concentrated benefits, dispersed cost phenomena that makes it hard to change many government programs.  But never-the-less I propose that we eliminate all the current Federal subsidies, mandates, and prohibitions that have been justified by climate change. Ethanol rules and mandates, solar subsidies, wind subsidies, EV subsidies, targeted technology investments, coal plant bans, pipeline bans, drilling bans -- it all should go.  The carbon tax does the work.

States can continue to do whatever they want -- we don't need the Feds to step on states any more than they do already, and I continue to like the 50 state laboratory concept.  If California wants to continue to subsidize wind generators, let them do it.  That is between the state and its taxpayers (and for those who think the California legislature is crazy or that the Texas legislature is in thrall to oil companies, that is what U-Haul is for).

Point 4:  Revamp our nuclear regulatory regime

As much as alternative energy enthusiasts would like to deny it, the world needs reliable, 24-hour baseload power -- and wind and solar are not going to do it (without a change in storage technology of at least 2 orders of magnitude in cost).  The only carbon-free baseload power technology that is currently viable is nuclear.

I will observe that nuclear power suffers under some of the same problems as commercial space flight -- the government helped force the technology faster than it might have grown organically on its own, which paradoxically has slowed its long-term development.  Early nuclear power probably was not ready for prime time, and the hangover from problems and perceptions of this era have made it hard to proceed even when better technologies now exist.   We are at least 2 generations of technology past what is in most US nuclear plants.  Small air-cooled thorium reactors and other technologies exist that could provide reliable safe power for over 100 years.  I am not an expert on nuclear regulation, but it strikes me that a regime similar to aircraft safety, where a few designs are approved and used over and over makes sense.  France, which has the strongest nuclear base in the world, followed this strategy.  Using thorium could also have the advantage of making the technology more exportable, since its utility in weapons production would be limited.

Point 5: Help clean up Chinese, and Asian, coal production

One of the hard parts about fighting CO2 emissions, vs. all the other emissions we have tackled in the past (NOx, SOx, soot/particulates, unburned hydrocarbons, etc), is that we simply don't know how to combust fossil fuels without creating CO2 -- CO2 is inherent to the base chemical reaction of the combustion.  But we do know how to burn coal without tons of particulates and smog and acid rain -- and we know how to do it economically enough to support a growing, prosperous modern economy.

In my mind it is utterly pointless to ask China to limit their CO2 growth.  China has seen the miracle over the last 30 years of having almost a billion people exit poverty.  This is an event unprecedented in human history, and they have achieved it in part by burning every molecule of fossil fuels they can get their hands on, and they are unlikely to accept limitations on fossil fuel consumption that will derail this economic progress.  But I think it is reasonable to help China stop making their air unbreathable, a goal that is entirely compatible with continued economic growth.  In 20 years, when we have figured out and started to build some modern nuclear designs, I am sure the Chinese will be happy to copy these and start working on their CO2 output, but for now their Maslov hierarchy of needs should point more towards breathable air.

As a bonus, this would pay one immediate climate change benefit that likely would dwarf the near-term effect of CO2 reduction.  Right now, much of this soot from Asian coal plants lands on the ice in the Arctic and Greenland.  This black carbon changes the albedo of the ice, causing it to reflect less sunlight and absorb more heat.  The net effect is more melting ice and higher Arctic temperatures.  A lot of folks, including myself, think that the recent melting of Arctic sea ice and rising Arctic temperatures is more attributable to Asian black carbon pollution than to CO2 and greenhouse gas warming (particularly since similar warming and sea ice melting is not seen in the Antarctic, where there is not a problem with soot pollution).

Final Thoughts

At its core, this is a very low cost, even negative cost, climate insurance policy.  I am convinced this policy, taken as a whole, would still make sense even if CO2 turns out to be as harmless as nitrogen.  The carbon tax combined with a market economy does the work of identifying the most efficient ways to reduce CO2 production.   The economy benefits from the removal of a myriad of distortions and crony give-aways, while also potentially benefiting from the replacement of a consumption tax on labor with a consumption tax on fuel.  The near-term effect on CO2 is small (since the US is only a small part of the global emissions picture), but actually larger than the near-term effect of all the haphazard current programs, and almost certainly cheaper to obtain.  As an added benefit, if you can help China with its soot problem, we could see immediate improvements in probably the most visible front of man-made climate change:  in the Arctic.

Postscript

Perhaps the hardest thing to overcome in reaching a compromise here is the tribalism of modern politics.  I believe this is  a perfectly sensible plan that even those folks who believe man-made global warming is  a total myth ( a group to which I do not belong) could sign up for.  The barrier, though, is tribal.  I consider myself to be pretty free of team politics but my first reaction when thinking about this kind of plan was, "What? We can't let those guys win.  They are totally full of sh*t.  In the past they have even threatened to throw me in jail for my opinions."  Since I first published this plan I have had very prominent skeptics contact me to criticize me for "giving in to the warmists."
 

Substantial CA Forest Management Changes Needed ESPECIALLY If You Think The Fires Are Caused by Climate Change

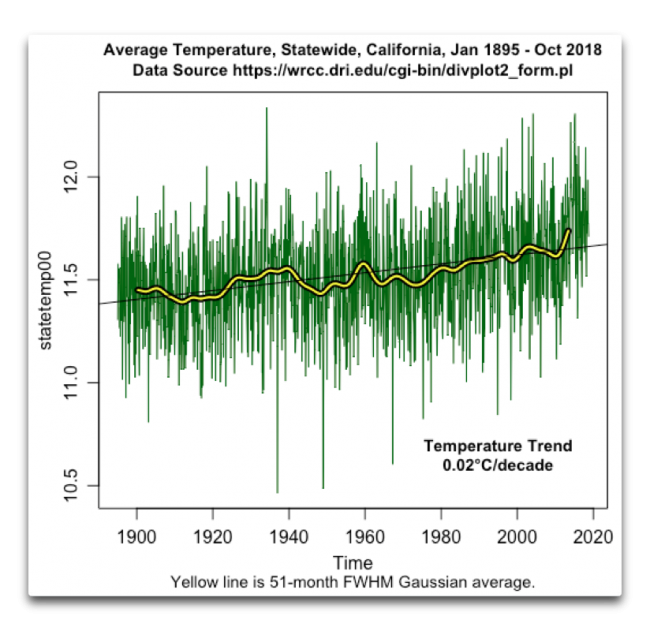
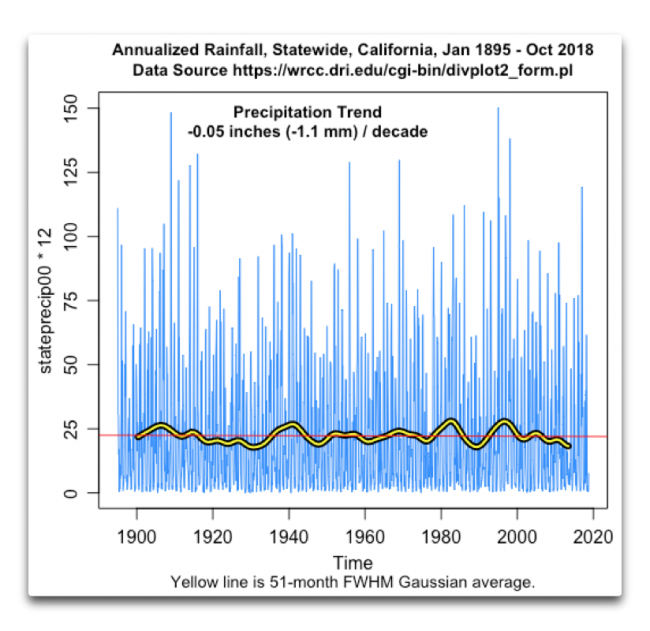
There is a debate raging between the usual suspects as to whether the larger fires in California are the inevitable result of manmade climate change or whether they are the result of poor forest management practices.  For this post I actually am not going to weigh in right on this , except to say that long-time readers will know I am skeptical of most claims that tie tail-of-the-distribution events to manmade CO2 and I find it hard to correlate large fire loss years with actual temperature / drought data for the same year.

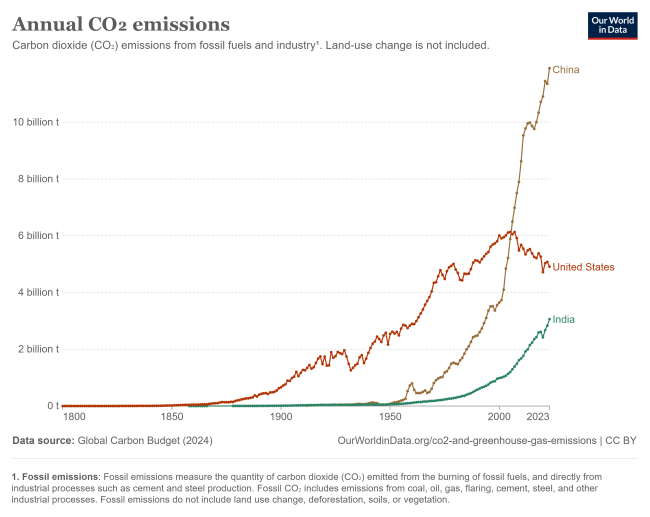
For a moment, let's accept that the fires this year are due to the climate change effects from rising manmade CO2.    As of today, CO2 makes up 412.55 ppm of the atmosphere (0.0412%).  To the extent that this number is driven upwards mainly by manmade CO2 (it was about 370 or 0.037% at the turn of the century), this is the lowest this number is going to be in your lifetime.   Even fast, drastic action in the US is only going to lower our CO2 emissions somewhat (as long as we stop short of sending the economy back to the stone age).  And even if we do go full paleo on the economy, India and China will continue emitting away.  This number will keep rising for decades, and even if we get to the point of reversing the rise, that would take decades more to get back to where it is today.  Note how far we have dialed back the world economy in 2020, and you can't even see a difference in the slope of the CO2 concentration curve.

I personally don't believe that manmade CO2 is the primary control knob on the climate, but for those of you who do, the temperature and drought conditions in California (by your assumptions) are the best this year that they will ever be again in your lifetime, even with dramatic climate action.

So do your thing on CO2 -- I have proposed a carbon tax plan that works here -- but using the need for climate action as an excuse for avoiding the forest management issues is absolutely irresponsible.  As I have shown above, if this is caused by CO2 then the need for mitigation and defensive actions to make forests more robust to fire is more rather than less crucial because CO2 is only going to go up in the coming years.

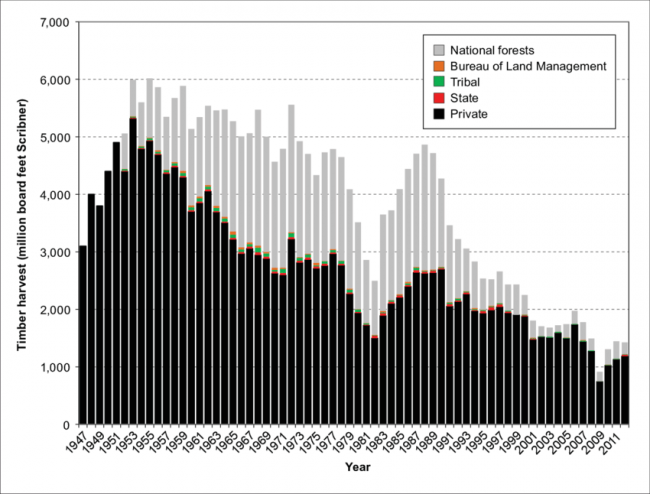
My company operates over a hundred Forest Service campgrounds in California, and over a hundred more in Oregon and Washington.  My employees live right in the middle of these forests you see burning down on the news -- the Sierra, the Sequoia, the Mt Hood, etc.  We see the condition of these forests up close, and it is terrible.  There is fuel laying everywhere, in part due to massive bark beetle tree kills and in part due to the natural aging of forests.   These forests are like houses with matches and oily rags lying all over the floor.  They need to be cleaned up.

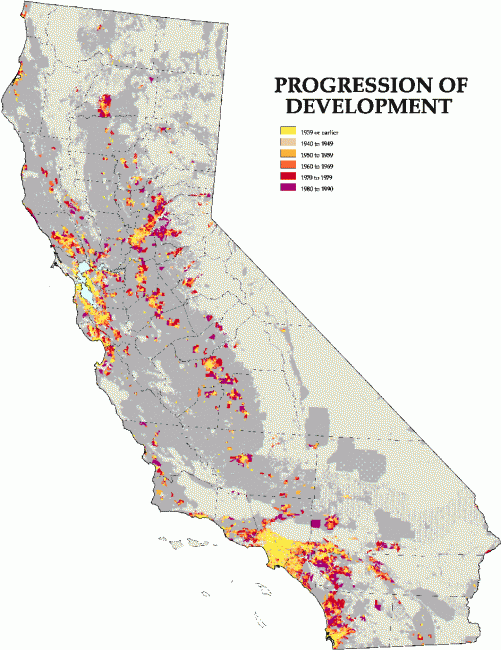
I know environmentalists have a beautiful vision of our forests returning to their primeval state, free of active human intervention.  But that is never going to happen, at least in California.  There are simply too many people living in and around the forests.  In fact, we have increasingly found ourselves in a position that is worse than either total non-intervention or active management.  We intervene to put out small fires that burn up fuel when the fuel loads are low, thus letting fuel build up until we get catastrophic fires.

Another Climate-COVID Computer Modelling Similarity

In this post, I wrote about parallels between climate and COVID alarm and related issues of computer modelling.  I realized I left out at least one parallel.

In the world of climate, computer model results are often used as the counterfactual case.  Let me give you an example.  The world has warmed over the last 100 years at the same time atmospheric CO2 concentration has increased.  Obviously, to truly judge the effect of CO2 on temperatures, we would like to know what the temperatures would have been over the last 100 years without rising CO2 concentrations.  But we don't have thermometers that read "with" and "without" CO2.

I remember I got caught up in this years ago when I published an analysis that showed that estimates of temperature sensitivity to CO2 concentrations used in projections going forward greatly over-predicted the amount of warming we have seen already.  In other words, there had not been enough warming historically to justify such high sensitivity numbers.  In response, I was told that alarmists considered the base case without CO2 increases to be a cooling world, because that is what some models showed.  Compared to this cooling counterfactual, they argued that the warming from CO2 historically had been much higher.

By the way, this argument always gets to be very circular.  When you really dig into the assumptions of the counter-factual models, they are based on assumptions that temperature sensitivity to CO2 is high.  Thus models predicated on high sensitivity are used to justify the assumption of high sensitivity.

I thought of all this today when I saw this post on COVID models and interventions from Kevin Drum.  I read Drum because, though I don't love his politics, he is more likely than most team-politics writers from either the Coke or Pepsi party to do a reasonable job of data analysis and interpretation.  But I have to fault him for this post, which I think is just terrible.  You can click through to see the chart but here is the text:

At the end of March, the highest estimate for [NY State] hospitalizations was 136,000+. Today the peak is estimated at about 30,000. That’s a difference of 5x. Did the modelers screw up?

Not really. Remember the Imperial College projections for the United States? They estimated about 2 million deaths if nothing was done; 1 million deaths if some countermeasures were taken; and 200,000 deaths if stringent countermeasures were taken. That’s a range of 10x. If you figure that we’ve taken fairly stringent countermeasures but not the maximum possible, then a reduction of 5x is about what you’d expect. Alternatively, if you ignore the Columbia University projection as an outlier, the IHME estimate has only gone down by about 2x. That’s what you’d expect if we took countermeasures that were just a little more stringent than their model assumed.

At the end of March it was still not clear how stringent and how effective the coronavirus countermeasures would be. In the event, it looks like they worked pretty well, cutting cases by at least 2x and possibly more. This is why the model estimates have gone down: because we followed expert advice and locked ourselves down. Just as we hoped.

Treating the early model estimates as if they are accurate representations of the "no intervention" counter-factual is just absurd.   It is particularly absurd in this case as he actually quotes a model -- the early Imperial College model -- that is demonstrably grossly flawed.  He is positing that we are in the Imperial College  middle intervention case, which estimated a million deaths in the US and is likely to be off by more than an order of magnitude.  Given this clear model/estimate miss, why in the world does he treat early Columbia and McKinsey models as accurate representations of the counter-factual?  Isn't it at least as likely that these models were just as flawed as the Imperial College models (and for many of the same reasons)?

The way he uses the IHME model results is also  flawed.  He acts like the reductions in the IHME estimates are due to countermeasures, but IHME has always assumed full counter-measures so it is impossible to use the numbers the way he wants to use them.

Parallels Between COVID-19 Alarm and Global Warming Alarm

So I finally had a day or two of downtime from trying to keep my business afloat (it's weird reading all the internet memes of people at home bored when I have never been busier).  I wondered why I was initially, and remain, skeptical of apocalyptic COVID-19 projections.

I have been skeptical about extreme global warming and climate change forecasts, but those were informed by my knowledge of physics and dynamic systems (e.g. feedback mechanics).  I have been immensely skeptical of Elon Musk, but again that skepticism has been informed by domain knowledge (e.g. engineering in the case of the hyperloop and business strategy in the case of SolarCity and Tesla).  But I have no domain knowledge that is at all relevant to disease transfer and pathology.  So why was I immediately skeptical when, for example, the governor of Texas was told by "experts" that a million persons would die in Texas if a lock-down order was not issued?

I think the reason for my skepticism was pattern recognition -- I saw a lot of elements in COVID-19 modelling and responses that appeared really similar to what I thought were the most questionable aspects of climate science.  For example:

  • We seem to have a sorting process of "experts" that selects for only the most extreme.  We start any such question, such as forecasting disease death rates or global temperature increases, with a wide range of opinion among people with domain knowledge.  When presented with a range of possible outcomes, the media's incentives generally push it to present the most extreme.  So if five folks say 100,000 might die and one person says a million, the media will feature the latter person as their "expert" and tell the public "up to a million expected to die."  After this new "expert" is repetitively featured in the media, that person becomes the go-to expert for politicians, as politicians want to be seen by the public to be using "experts" the public recognizes as "experts."
  • Computer models are converted from tools to project out the implications of a certain set of starting hypotheses and assumptions into "facts" in and of themselves.   They are treated as having a reality, and a certainty, that actually exceeds that of their inputs (a scientific absurdity but a media reality I have observed so many times I gave it the name "data-washing").  Never are the key assumptions that drive the model's behavior ever disclosed along with the model results.  Rather than go on forever on this topic, I will refer you to my earlier article.
  • Defenders of alarmist projections cloak themselves in a mantle of being pro-science.  Their discussions of the topic tend to by science-y without being scientific.  They tend to understand one aspect of the science -- exponential growth in viruses or tipping points in systems dominated by positive feedback.  But they don't really understand it -- for example, what is interesting about exponential growth is not the math of its growth, but what stops the growth from being infinite.  Why doesn't a bacteria culture grow to the mass of the Earth, or nuclear fission continue until all the fuel is used up?  We are going to have a lot of problem with this after COVID-19.  People will want to attribute the end of the exponential growth to lock-downs and distancing, but it's hard to really make this analysis without understanding at what point -- and there is a point -- the virus's growth would have turned down anyway.
  • Alarmists who claim to be anti-science have a tendency to insist on "solutions" that have absolutely no basis in science, or even ones that science has proven to be utterly bankrupt.  Ethanol and wind power likely do little to reduce CO2 emissions and may make them worse, yet we spend billions on them as taxpayers.  And don't get me started on plastic bag and straw bans.   I am willing to cut COVID-19 responses a little more slack because we don't have the time to do elaborate studies.  But just don't tell me lockdown orders are science -- they are guesses as to the correct response.  I live in Phoenix where it was sunny and 80F this weekend.  We are on lockdown in our houses.  I could argue that ordering everyone out into the natural disinfectant of heat and sunlight for 2 hours a day is as effective a response as forcing families into their houses (initial data, though it is sketchy, of limited transfer of the virus in summertime Australia is interesting -- only a small portion of cases are from community transferBy comparison less than a half percent of US cases from travel).
  • In both cases, advocates of the precautionary principle seem to rule the day.  I would argue that in practice, the precautionary principle means that any steps that might conceivably limit something bad should be pursued irregardless of cost.  You see a form of this all over social media, which folks arguing that it is wrong to balance deaths against money, and any life spared is worth the cost.  But this is absurd two at least two reasons
    • First, unemployment and economic recession have real, proven effects on mortality.  Shut down the economy to reduce CO2 or virus spread, and people will die
    • Second, if we really followed this principle for everything we would be back in the stone age.  Take the flu.  15,000-20,000 people will die of the flu every year in the US -- my healthy 25-year-old nephew died of the flu.  Are we going to shut down the economy next year in flu season?  It would reduce flu deaths.  Or take the 37,000 people killed each year in the US in motor vehicle accidents.  With the lockdowns, that figure is certainly reduced right now.  Should we just shut down the economy forever, it sure would reduce car fatalities?
  • And of course there is the political polarization of what should be scientific opinion.  The Nevada and Michigan governors initially banned chloroquine treatment strategies for no good reason other than the fact that Trump publicly highlighted them as promising.

Update:  Prediction from climate applied to COVID-19:  No one will go back and call out widely-used models for failing to accurately model the disease or attempt to learn from their mistakes.  If it is ever mentioned that these models grossly over-estimated deaths, it will be forgiven as being exaggeration in a good cause.  (Somewhat related, Bryan Caplan on Social Desirability Bias)

Great Moments in Climate Prediction: 2020 Disaster Predicted in 2004

I am working on a bit of a climate update in a post called something like "Dear Greta, the climate is not about to kill you."  But until then, just so you can calibrate the current hype, here was the hype from 2004.  Specifically, an article in Guardian February 21, 2004:

A secret report, suppressed by US defence chiefs and obtained by The Observer, warns that major European cities will be sunk beneath rising seas as Britain is plunged into a 'Siberian' climate by 2020. Nuclear conflict, mega-droughts, famine and widespread rioting will erupt across the world.

The document predicts that abrupt climate change could bring the planet to the edge of anarchy as countries develop a nuclear threat to defend and secure dwindling food, water and energy supplies. The threat to global stability vastly eclipses that of terrorism, say the few experts privy to its contents.

'Disruption and conflict will be endemic features of life,' concludes the Pentagon analysis. 'Once again, warfare would define human life.'...

Already, according to Randall and Schwartz, the planet is carrying a higher population than it can sustain. By 2020 'catastrophic' shortages of water and energy supply will become increasingly harder to overcome, plunging the planet into war. They warn that 8,200 years ago climatic conditions brought widespread crop failure, famine, disease and mass migration of populations that could soon be repeated.

Randall told The Observer that the potential ramifications of rapid climate change would create global chaos. 'This is depressing stuff,' he said. 'It is a national security threat that is unique because there is no enemy to point your guns at and we have no control over the threat.'

Randall added that it was already possibly too late to prevent a disaster happening. 'We don't know exactly where we are in the process. It could start tomorrow and we would not know for another five years,' he said.

Of course being wrong then does not mean the same folks are wrong now, though it is amazing that being wrong over and over does not seem to dent these folks' credibility one bit in the media.  You would think there might be one journalist who would ask, "you keep predicting climate disaster, and it always remains 10 years away.  What's up with that?"

As always, my advice to you on climate is to be a good consumer of information.  Specifically, when the media claims a trend, look for the trend data.  And if they claim a long-term trend, check to see if the trend data is long-term.  You will be amazed how often the media will claim a trend from a single data point.   I will soon do an update on four of the most hyped climate "trends" -- hurricanes, droughts, crop failures, and sea level rise -- and show that the first three have no trend (or an improving trend) and the fourth, sea level rise, has a trend but that trend has been existent since before 1850, long before most manmade Co2 was put in the air.

Illustrating the Corruption in Climate Science

Long-time readers know that while I believe the evidence for warming over the last 100 years is strong, the evidence of negative knock-on effects from this warming (hurricanes, tornadoes, sea level, etc) is really weak, often the weakest part of an climate report.  Here is one example.

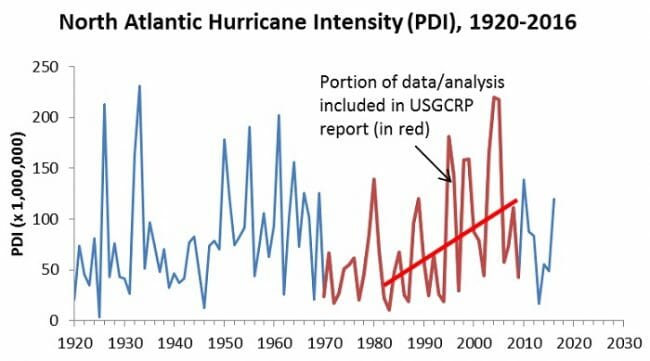
In the most recent National Climate Assessment written by our betters in the US Government, this chart was used to illustrate increasing hurricane intensity.

I will begin with the positive:  The use of a metric for total hurricane energy rather than something like hurricane counts or landfalls is a huge improvement over past reports and a much better metric to test changes over time in hurricane frequency and intensity.  Now here is the bad news -- the North Atlantic hurricane date is based on a cherry-picked time interval that creates a trend where none exists, and the authors HAD to know it.   The odds that this is just sloppiness or incompetence rather than outright obfuscation are low.

Pat Michaels had Ryan Maue (the scientist who creates most of the hurricane intensity databases) calculate this same metric back to 1920.  This is what the chart looks like, with the cherry-picked dates in the Assessment chart shown in red

That red trend line is just as dishonest as can be.  It is super hard to see any sort of long term trend here, just a multi-decadal cycality that hurricane scientists used to acknowledge before they started extrapolating individual sine waves into long-term upward trends.  This is particularly true since the advent of many new hurricane observation tools, such as aircraft and space photography, mean that numbers before 1960 may well be underestimated.

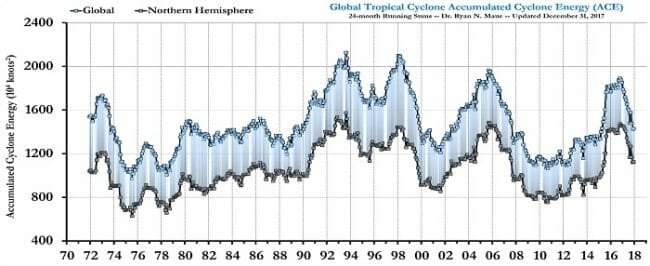
In fact, when you look beyond just the North Atlantic and look at all the world's oceans, there is not even a trend in hurricane intensity over the period since 1970  (accumulated cyclonic energy is a slightly different but related way to measure the time integral of hurricane intensity).

Amazon Fires, Summer of the Shark, and the Unintended Consequences of Stupid Climate Policy (ie Ethanol Mandates)

I know I have told the story of the "Summer of the Shark" before, but I need to repeat it again because it is so relevant to the Amazon fire story

let's take a step back to 2001 and the "Summer of the Shark." The media hysteria began in early July, when a young boy was bitten by a shark on a beach in Florida. Subsequent attacks received breathless media coverage, up to and including near-nightly footage from TV helicopters of swimming sharks. Until the 9/11 attacks, sharks were the third biggest story of the year as measured by the time dedicated to it on the three major broadcast networks' news shows.

Through this coverage, Americans were left with a strong impression that something unusual was happening -- that an unprecedented number of shark attacks were occurring in that year, and the media dedicated endless coverage to speculation by various "experts" as to the cause of this sharp increase in attacks.

Except there was one problem -- there was no sharp increase in attacks.  In the year 2001, five people died in 76 shark attacks.  However, just a year earlier, 12 people had died in 85 attacks.  The data showed that 2001 actually was  a down year for shark attacks.

The Amazon fire story is like the Summer of the Shark stories back in 2001, except on steroids due to the influence of social media.  Just like with Summer of the Shark, everyone is convinced that this is the worst summer ever for Amazon fires.  And just like back in 2001, the media is bending over backwards to claim a trend without actually giving any trend data.

The Washington Post deftly avoided actually showing any trend data by having a couple of "experts" claim that this summer is the worst ever in their memory

“I cannot remember any other big fire episode like this one,” said Vitor Gomes, an environmental scientist at the Federal University of Para.

Ricardo Mello, head of the World Wide Fund for Nature’s Amazon program, struggled to find the words to describe his pessimism on Thursday.

“It’s historically — this is highest number [of fires] I’ve ever seen,” he said.

It turns out that trend data is actually pretty easy to come by.   NASA for example captioned a recent satellite photo of the Amazon fires by writing

 “As of August 16, 2019, satellite observations indicated that total fire activity in the Amazon basin was slightly below average in comparison to the past 15 years. Though activity has been above average in Amazonas and to a lesser extent in Rondônia, it has been below average in Mato Grosso and Pará, according to the Global Fire Emissions Database”

Wait, there is actually a global fire emissions database?  Wow, that seems like something that could be more useful to an article about trends than the anecdotal memory of two people.  It turns out the picture is complicated.  It is close to a 20-year high in the Amazonas region but much closer to average in the 9 other measured Amazon regions.   And with the exception of the Amazonas region, the basic picture is of the last 10 years having generally fewer fires than in the first decade of the century.  The level of fire is worrisome but far short of an unprecedented catastrophe.   As the Times wrote:

The number of fires identified by the agency in the Amazon region so far this year, 40,341, is about 35 percent higher than the average for the first eight months of each year since 2010.

The decade before that included several years in which the number of fires identified during the first eight months was far higher.

But the most interesting part is to consider the effect of short-sighted US climate policy.  It would be hard to imagine any climate policy stupider than ethanol mandates and subsidies.

One of the interesting things about the Amazon fires is that most folks agree the fires are largely limited to cleared farmland within the Amazon basin.  For example, here is the NY Times:

Natural fires in the Amazon are rare, and the majority of these fires were set by farmers preparing Amazon-adjacent farmland for next year’s crops and pasture.

Much of the land that is burning was not old-growth rain forest, but land that had already been cleared of trees and set for agricultural use....

Brazil was actually doing pretty well slowing the clearing of the Amazon

The new Brazilian President rightly deserves blame for increasing rainforest clearning

While campaigning for president last year, Mr. Bolsonaro declared that Brazil’s vast protected lands were an obstacle to economic growth and promised to open them up to commercial exploitation.

Less than a year into his term, that is already happening.

Brazil’s part of the Amazon lost more than 1,330 square miles of forest cover in the first half of 2019, a 39 percent increase over the same period last year, according to the government agency that tracks deforestation.

But one of the forces that has been at work for years has been US ethanol policy, essentially the government mandates and subsidies to divert a large amount of food and cropland to fuel production.  An article in Grist and Foreign Policy in 2010 discusses this issue in depth

In the FP piece, author Nikolas Kozloff jumps right to the point in his lead:

While sugar cane ethanol is certainly less ecologically destructive than some other biofuels, the industry’s boosters have overlooked one key fact: You’ve got to plant sugar cane somewhere. One couldn’t pick a worse place to harvest cane than Brazil’s Atlantic rainforest. There, sugar cane crops have led to deforestation and, paradoxically, more carbon emissions.

Both articles go on to discuss the shift in sugarcane from the Atlantic to the Amazon rain forests.  I would argue that by raising world food prices, corn ethanol in the US also has an effect, by creating the economic incentive to clear more farmland in the Amazon to plant crops essentially subsidized by US ethanol mandates.

Why I (Mostly) Don't Blog About Climate Anymore

Recently the journal Nature published a "study" arguing that climate contrarians got too much media attention and that, essentially, the media needs to stop quoting them.  A part of the study included a list of climate skeptics and their media influence scores.

It was a little off-putting to be left off this black list, though I feel certain that 10 years ago in my active period I could have easily made the cut.  Nevertheless, it is clear that I have fallen by the wayside.

And that is by choice.  I simply do not have the ability in this blogging hobby to play decades-long games of wack-a-mole with the same arguments over and over.  In a different sphere, I see folks like Mark Perry and Don Boudreaux take on the same anti-trade arguments for years.  I respect them for it and appreciate the effort, but I don't know how they do it.

From my observation, the world of climate remains the same old sh*t.  No one has come up with a better approach for estimating the all-important value of the temperature sensitivity to CO2 concentration.  Alarmists are still assuming massive amounts of positive feedback in the climate system but have done nothing new to prove this is really true.  Trends are still extrapolated from individual weather events, and trends are often claimed in the media without actually showing any trend data.

And the whole thing has become tribal as hell.  The other day I tried to engage Kevin Drum on twitter about a chart he used that I thought was bad.  I was trying to make the point that there is no scientific reason to believe that worldwide increases in atmospheric CO2 concentration would have 3x their average effect in a 25 mile radius around Phoenix (as the chart seems to show) and that the more logical explanation is that the chart is based on at least somewhat corrupted data.  I said nothing like "and thus global warming is all a scam."  In fact, the only conclusion I drew was a very modest one everyone interested in global warming should be able to agree with, that it has been a mistake not to have invested in a better surface temperature network given how important the issue is to us.

But even that was too much -- you could tell Drum was automatically treating me as a denier and anti-science.  Take this exchange for example


Kevin Drum is one of my favorite people to read because he is one of the few folks in Left or Right who will occasionally question his own tribe.  This is not Kevin Drum thinking, this is Kevin Drum giving the tribal answer because anyone poking even modestly at the edges of climate orthodoxy has put his fur up.

So I move on to other things.  To be honest, this may just be a personality trait of mine related to ADD/limited focus.  I find myself bored with the whole Tesla critic community as well, seeing the SOS ever day.

Postscript:  For those who do not follow me much, here is my current position on global warming

  • Man-made global warming is real but likely exaggerated, in particular from unrealistic assumptions about massive amounts of positive feedback in the otherwise long-term-stable climate system.  The chance of large (>2C) warming is remote but non-zero
  • Most of the claimed relationship of extreme weather events to manmade CO2 are a crock.  Time and again the media and activists claim trends (e.g. in hurricanes, droughts, and tornadoes) that simply are not there when you actually look at trend data.  Where we do see trends, such in sea level rise, those trends have often been going on since the mid 1800's, making it difficult to attribute them entirely to man-made CO2 produced mostly after 1950.
  • It is possible to create a low cost climate insurance plan that might actually be a net economic improvement over the current regulatory environment, even before considering environmental benefits.  That plan is here.  Speaking of tribalism, it does not run one way.  This plan essentially got me shunned in much of the skeptic community.

Postscript #2:  The skeptic list from Nature has some odd names.  Don Boudreaux and Ron Bailey stuck out to me.   Boudreaux to my knowledge is not engaged in the climate debate at all and I know Bailey is an AGW believer.  Both, however, are anti-authoritarian and pro-market, and in the era of the Green Great Leap Forward, or whatever it is called, I suppose that is enough to put one athwart the climate change alarmists.

This Isn't A Map of Global Warming, It's A Map of Corrupted Temperature Stations

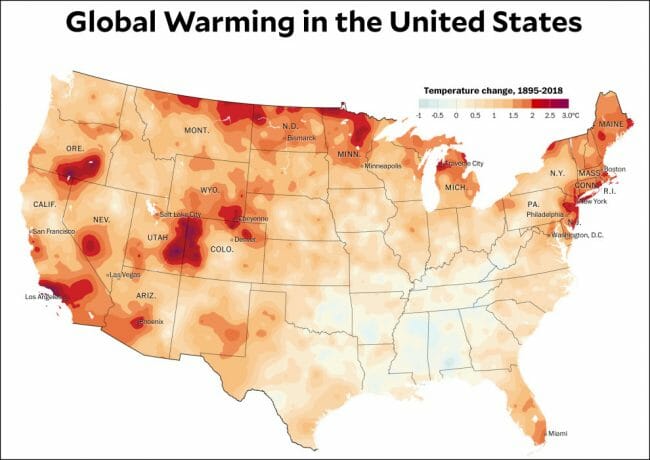
Kevin Drum published this map on his blog, which he says was originally from the Washington Post.  He does not include a link so I can't give any more background on the chart.  For example, I have no idea which surface temperature data set it is based on.

The fact that smart guy like Kevin Drum can publish this uncritically just demonstrates how little even vociferous global warming advocates actually understand about the issue.  Because all this chart does is reinforce a skeptic argument that the global surface temperature data set is corrupted and can exaggerate warming trend data.

Let's start with this:  I have read much of the IPCC reports and have skimmed the rest, and I can say with certainty that these reports contain no theory about how increasing the concentration of atmospheric CO2 from 0.03% to 0.04% causes warming of 2C or more focused in hotspots as small as a 50 mile radius.  There is absolutely no theory, and I would argue no way, that a general global warming trend of 1-1.5C per century is causing warming 2-3 times that rate narrowly over San Jose, California or Phoenix, AZ.

The fact that many of these hotspots are focused over urban areas is a good indicator that this temperature data set is corrupted with urban heat island biases.  This is a different kind of man-made effect but one which is local and is not the result of a global warming trend, and thus should not be in a database aimed at measuring this global warming trend.

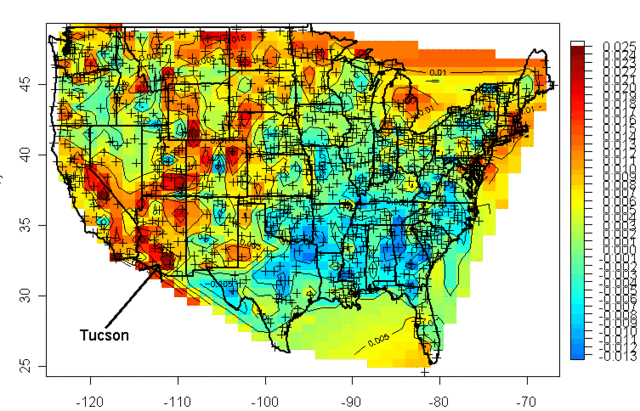
Something like 10 years ago I saw a similar chart online based on USHCN measurement stations.  At that time, the chart showed a hotspot over Tucson

At the time, Anthony Watt was running his Surface Stations project to document the conditions of all the USHCN temperature stations (the crosses on the map) that formed the basis of the US global warming / temperature trend numbers.  So I drove down to Tucson to see the temperature station in the middle of that hotspot.  What I found was that the temperature station that 100 years ago was in a rural open field was now measuring the temperature of an asphalt parking lot in the middle of a large city:

As an aside, this was a fun project as I still see this picture reproduced in random places from time to time.  After this picture got some publicity, the government shut this station down and moved it to a better location.

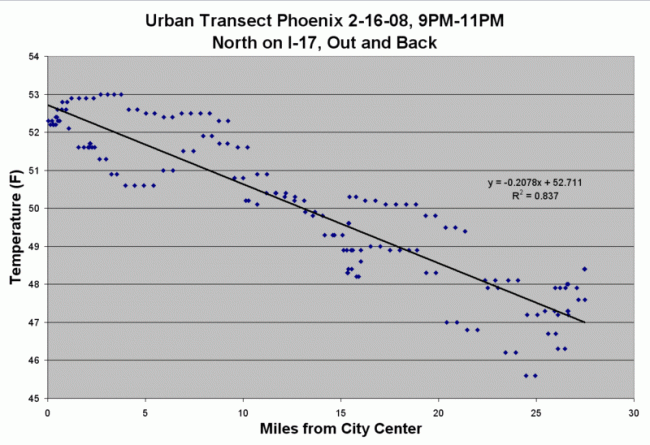
But the point is that the hotspot on the temperature change map was both real and fake.  Real in the sense that Tucson was definitely hotter due to the change in land use, as are most all cities (just watch the weather in a city and they will often say that it will be a low of 45 in the city, and 40 in the outlying areas).  My son and I measured the urban heat island in Phoenix for a high school science project.  We found it to be as high as a 6-8F difference between city and the surrounding countryside at certain times of day.

But the hotspot was fake because this had nothing to do with global warming from CO2, and thus including this hotspot in the temperature data was exaggerating the global warming trend.  This is especially true since there are only a few data points, so this reading for Phoenix was averaged into the reading all over the Southwest and tended to raise the official temperatures for much of Arizona, not just in Tucson.  Where temperature stations are sparse, such as in northeast Montana, a single bad surface temperature station can corrupt the data for a large area.  This effect is even further exaggerated in places like Africa, where temperature stations can be hundreds of kilometers apart.

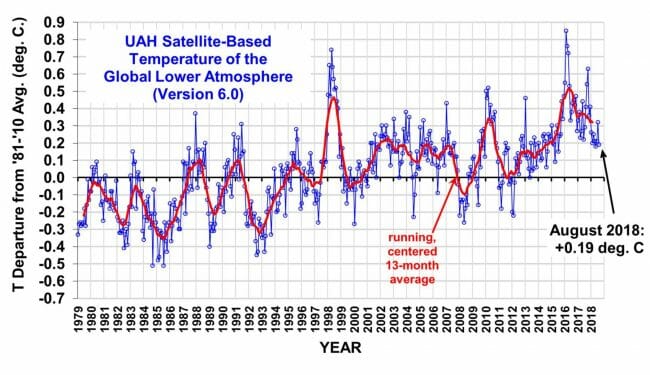
This is one reason satellite temperature measurement makes so much sense, as it is not subject to these sorts of biases (though it has other issues, including sensor drift and the fact that satellites can shift orbits and eventually die).  Whenever you see high temperature records today, they are usually set in the city at the airport, a big paved facility in the center of an urban area that 50 years ago was probably an open field.  There is a good chance the record has more to do with urbanization around the temperature measurement station than with global warming.

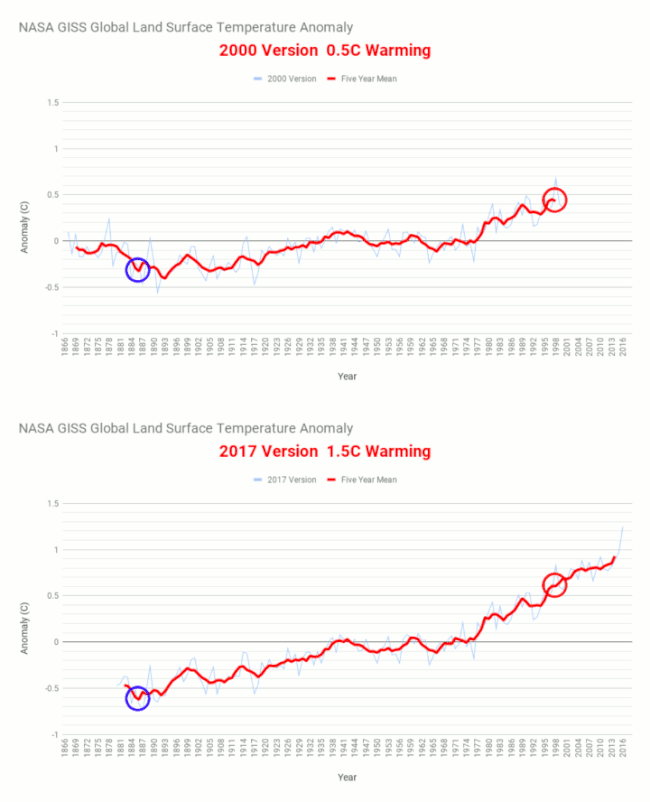
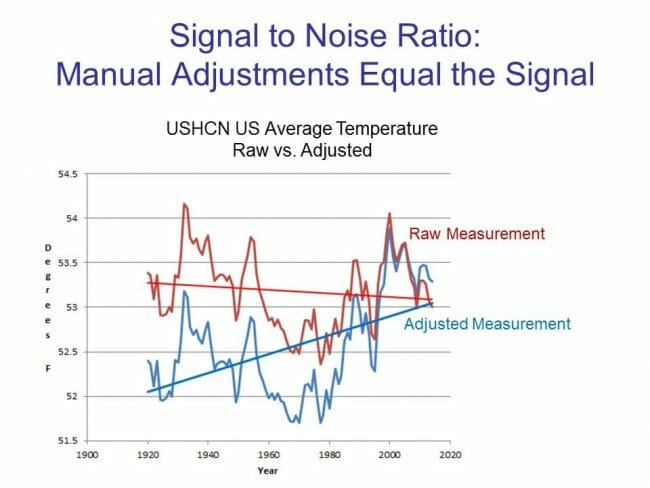
I believe the scientific community at NOAA and GISS have been almost criminally negligent with the surface temperature network over the last 30 years.  In the late 80's, when we became concerned with global warming, experts knew all too well about vast problems in how we measure surface temperatures.  We have invested tens of billions of dollars to fight global warming, but practically zero to measure it better.  We should have invested in a better, more reliable, less biased (in the scientific not political sense of that word) measurement system.  The amount of money we wasted in Solyndra would have paid for the upgrades, but we still have done nothing.  As a result, much of the warming signal is actually manual corrections to the raw data, undermining the signal to noise ratio of this critical metric and calling into question the bias (in the political not scientific sense) of these manual corrections (eg here and here).  For example, it turns out the past continues to cool.

Postscript Bonus:

The Danish Meteorological Institute, which has a key role in monitoring Greenland’s climate, last week reported a shocking August temperature of between 2.7C and 4.7C at the Summit weather station, which is located 3,202m above sea level at the the centre of the Greenland ice sheet, generating a spate of global headlines.

But on Wednesday it posted a tweet saying that a closer look had shown that monitoring equipment had been giving erroneous results.

“Was there record-level warmth on the inland ice on Friday?” it said. “No! A quality check has confirmed out suspicion that the measurement was too high.”


Climate "Disruption" and Publication Bias

Quite a while ago I wrote an article about climate publication bias called Summer of the Shark.

let's take a step back to 2001 and the "Summer of the Shark." The media hysteria began in early July, when a young boy was bitten by a shark on a beach in Florida. Subsequent attacks received breathless media coverage, up to and including near-nightly footage from TV helicopters of swimming sharks. Until the 9/11 attacks, sharks were the third biggest story of the year as measured by the time dedicated to it on the three major broadcast networks' news shows.

Through this coverage, Americans were left with a strong impression that something unusual was happening -- that an unprecedented number of shark attacks were occurring in that year, and the media dedicated endless coverage to speculation by various "experts" as to the cause of this sharp increase in attacks.

Except there was one problem -- there was no sharp increase in attacks.  In the year 2001, five people died in 76 shark attacks.  However, just a year earlier, 12 people had died in 85 attacks.  The data showed that 2001 actually was  a down year for shark attacks.

The point is that it is easy for people to mistake the frequency of publication about a certain phenomenon for the frequency of occurrence of the phenomenon itself.  Here is a good example I saw the other day:

An emaciated polar bear was spotted in a Russian industrial city this week, just the latest account of polar bears wandering far from their hunting grounds to look for food.

Officials in the Russian city of Norilsk warned residents about the bear Tuesday.  They added that it was the first spotted in the area in over 40 years.

I am willing to bet my entire bourbon collection that a) hungry polar bears occasionally invaded Siberian towns in previous decades and b) news of such polar bear activity from towns like Norilsk did NOT make the American news.  But readers (even the author of the article) are left to believe there is a trend here because they remember seeing similar stories recently but don't remember seeing such stories earlier in their life.

Yes, Urbanization Does Put an Upward Bias on the Surface Temperature Record

This is one of those issues that really should surprise no one, but encroaching urbanization on surface temperature measurement stations can impose an upward bias to recorded temperatures, creating a false trend.  The increase in measured temperatures due to urbanization is easy to demonstrate -- my son and I did it as a junior high science project.

The NOAA has a paper out that confirms the effect on surface temperature measurement. By the way the UofA temperature station photo illustrating the photo was actually taken by yours truly, becoming the most circulated photo I have ever taken.  Here is the story.

In short, what happens is this.  Urban environments are hotter than the surrounding countryside, so temperatures in the city will be biased upwards from those in the country around it (you will often see this on the local weather when they contrast the city vs outlying areas).  This in and of itself does not necessarily corrupt the temperature trend.  However, if the city is growing -- say in the case of the UofA photo in the article which 100 years ago was in an huge open field -- then encroaching urbanization can bias the trend.

Even with these biases removed, it is important to note that there is still an upward trend in the surface temperature record, at least over the last 30 years (as there is in satellite temperature measurement which is not subject to this bias).  However, the total US surface trend may be overstated by a third to a half.  Climate scientists of the alarmist sort have one of two reactions to this:  1) There are urban heat island deniers, who deny it is an issue or has any effect on the temperature record; and 2) There are those who accept that it exists but claim it is accounted for by various statistical methods that look at multiple sites in one area.  The problem with this latter is that rather than actually remove the bias, it tends to smooth the bias like peanut butter across multiple stations.

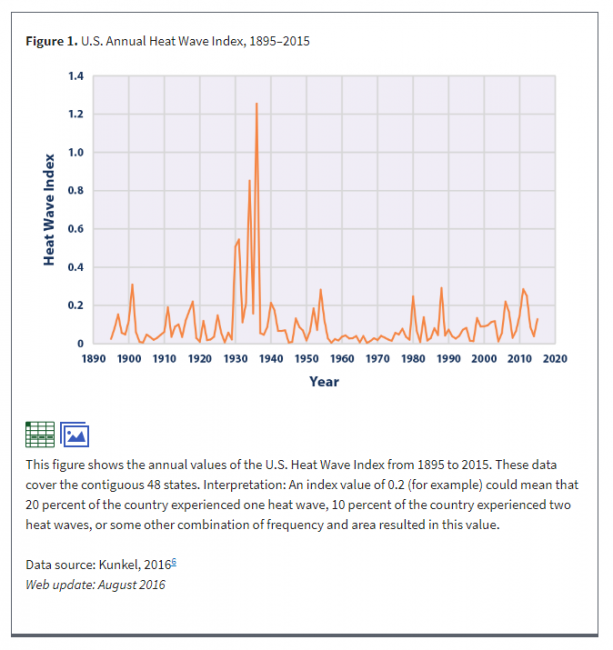
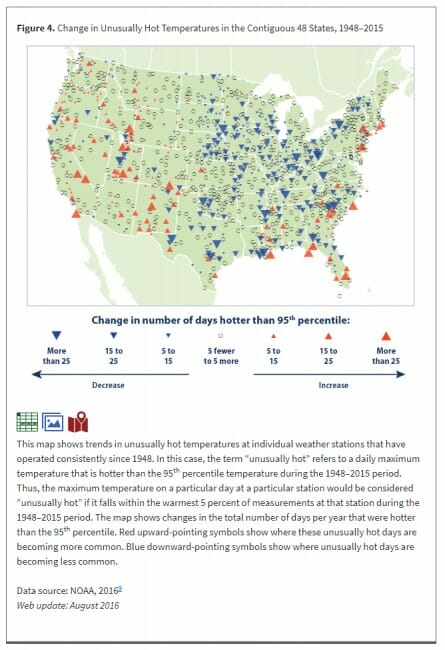
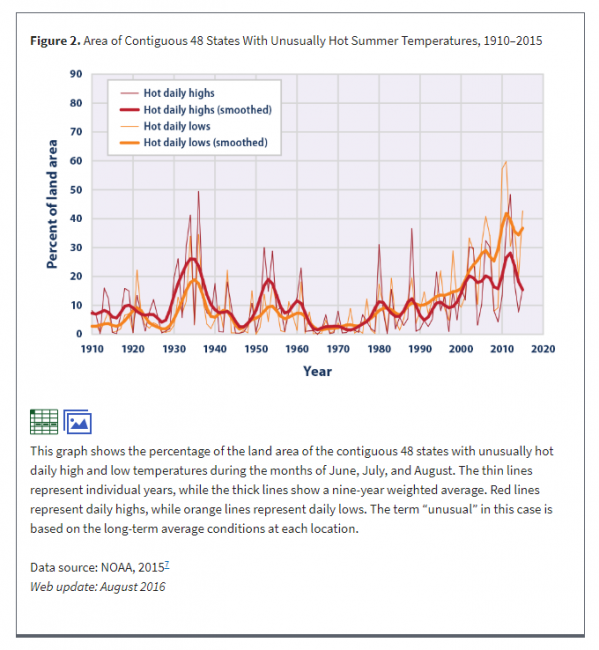
Why Global Warming Does Not Necessarily Translate to Daily High Temperature Records

Most folks assume that global warming results in record high daily temperatures, but this is not necessarily the case.  When your local news station blames a high temperature record on global warming, they may be wrong for two reasons.

  1.  Most of the temperature stations used by your local news channels for weather are full of urban heat island biases.  This is particularly true of the airport temperature that many local news stations use as their official reading (though to be fair UHI has much more effect on evening temperatures than temperatures at the daily high).
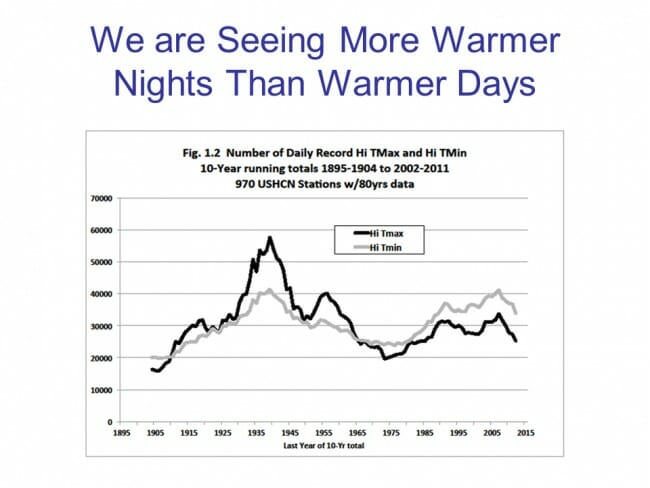
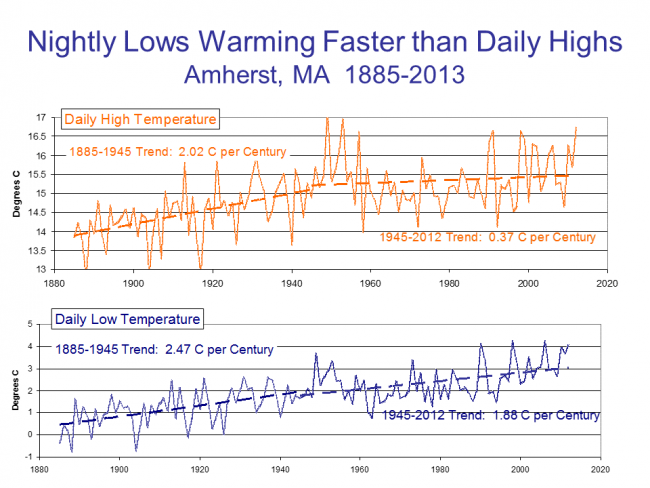
  2.  Most global warming, at least in the US where we have some of the best records, does not occur during the day -- it occurs at night

The latter point is surprising to most folks, but as a result we are not seeing an unusual number of daily high temperature records set (many were set in the 1930s and still stand).  What we are seeing instead is a large number of record high low temperature readings.  This is confusing, but basically it means that the lowest temperature that is reached at nighttime is higher than it has been in the past.  The chart below is a bit dated but still holds:

When I give presentations I try to use examples from local data.  Here is the comparison of night time warming vs. day time warming in Amherst, MA.

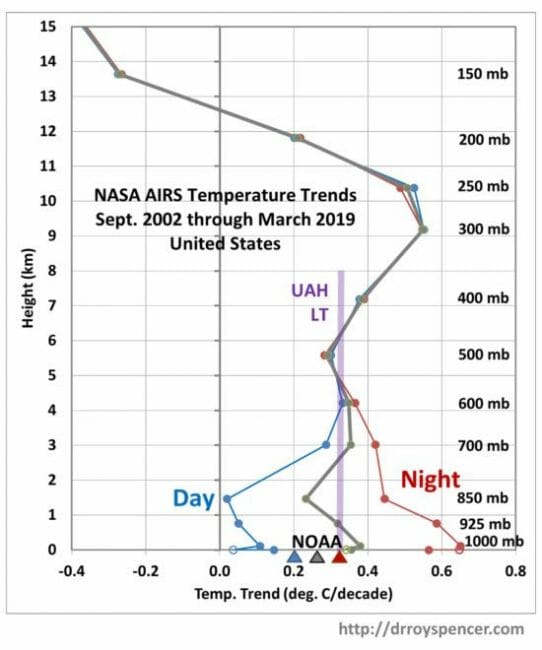
I bring this all up again because Dr. Roy Spencer has done a similar analysis for the US from the relatively new AIRS database (a satellite-based data set that avoids some of the problems of land thermometer data sets like urban heat island biases and geographic coverage gaps).  He shows this same finding, that over 80% of the warming we have seen recently in the US is at night.

This is a bit over-complicated because it is looking at temperatures through different heights of the atmosphere when most of you only care about the surface.  But you can just look at the 0 height line to see the surface warming trend.  Note that in general the data is pretty consistent with the UAH lower-troposphere temperature (satellite) and the NOAA metric (ground thermometers).

No particular point except to highlight something that is poorly understood by most folks because the media never talks about it.


Knowledge and Certainty "Laundering" Via Computer Models

Today I want to come back to a topic I have not covered for a while, which is what I call knowledge or certainty "laundering" via computer models.  I will explain this term more in a moment, but I use it to describe the use of computer models (by scientists and economists but with strong media/government/activist collusion) to magically convert an imperfect understanding of a complex process into apparently certain results and predictions to two-decimal place precision.

The initial impetus to revisit this topic was reading "Chameleons: The Misuse of Theoretical Models in Finance and Economics" by Paul Pfleiderer of Stanford University (which I found referenced in a paper by Anat R. Admati on dangers in the banking system).  I will except this paper in a moment, and though he is talking more generically about theoretical models (whether embodied in code or not), I think a lot of his paper is relevant to this topic.

Before we dig into it, let's look at the other impetus for this post, which was my seeing this chart in the "Southwest" section of the recent Fourth National Climate Assessment.

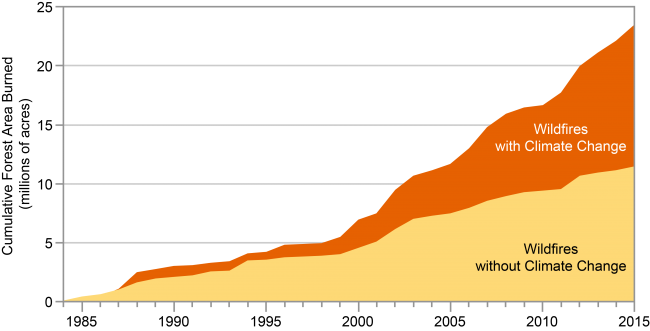
The labelling of the chart actually understates the heroic feat the authors achieved as their conclusion actually models wildfire with and without anthropogenic climate change.  This means that first they had to model the counterfactual of what the climate could have been like without the 30ppm (0.003% of the atmosphere) CO2 added in the period.  Then, they had to model the counterfactual of what the wildfire burn acreage would have been under the counter-factual climate vs. what actually occurred.   All while teasing out the effects of climate change from other variables like forest management and fuel reduction policy (which --oddly enough -- despite substantial changes in this period apparently goes entirely unmentioned in the underlying study and does not seem to be a variable in their model).  And they do all this for every year back to the mid-1980's.

Don't get me wrong -- this is a perfectly reasonable analysis to attempt, even if I believe they did it poorly and am skeptical you can get good results in any case (and even given the obvious fact that the conclusions are absolutely not testable in any way).  But any critique I might have is a normal part of the scientific process.  I critique, then if folks think it is valid they redo the analysis fixing the critique, and the findings might hold or be changed.  The problem comes further down the food chain:

  1. When the media, and in this case the US government, uses this analysis completely uncritically and without any error bars to pretend at certainty -- in this case that half of the recent wildfire damage is due to climate change -- that simply does not exist
  2. And when anything that supports the general theory that man-made climate change is catastrophic immediately becomes -- without challenge or further analysis -- part of the "consensus" and therefore immune from criticism.

I like to compare climate models to economic models, because economics is the one other major field of study where I think the underlying system is as nearly complex as the climate.  Readers know I accept that man is causing some warming via CO2 -- I am a lukewarmer who has proposed a carbon tax.  However, as an engineer whose undergraduate work focused on the dynamics of complex systems, I go nuts with anti-scientific statements like "Co2 is the control knob for the Earth's climate."  It is simply absurd to say that an entire complex system like climate is controlled by a single variable, particularly one that is 0.04% of the atmosphere.  If a sugar farmer looking for a higher tariff told you that sugar production was the single control knob for the US climate, you would call BS on them in a second (sugar being just 0.015% by dollars of a tremendously complex economy).

But in fact, economists play at these same sorts of counterfactuals.  I wrote about economic analysis of the effects of the stimulus way back in 2010.  It is very similar to the wildfire analysis above in that it posits a counter-factual and then asserts the difference between the modeled counterfactual and reality is due to one variable.

Last week the Council of Economic Advisors (CEA) released its congressionally commissioned study on the effects of the 2009 stimulus. The panel concluded that the stimulus had created as many as 3.6 million jobs, an odd result given the economy as a whole actually lost something like 1.5 million jobs in the same period. To reach its conclusions, the panel ran a series of complex macroeconomic models to estimate economic growth assuming the stimulus had not been passed. Their results showed employment falling by over 5 million jobs in this hypothetical scenario, an eyebrow-raising result that is impossible to verify with actual observations.

Most of us are familiar with using computer models to predict the future, but this use of complex models to write history is relatively new. Researchers have begun to use computer models for this sort of retrospective analysis because they struggle to isolate the effect of a single variable (like stimulus spending) in their observational data. Unless we are willing to, say, give stimulus to South Dakota but not North Dakota, controlled experiments are difficult in the macro-economic realm.

But the efficacy of conducting experiments within computer models, rather than with real-world observation, is open to debate. After all, anyone can mine data and tweak coefficients to create a model that accurately depicts history. One is reminded of algorithms based on skirt lengths that correlated with stock market performance, or on Washington Redskins victories that predicted past presidential election results.

But the real test of such models is to accurately predict future events, and the same complex economic models that are being used to demonstrate the supposed potency of the stimulus program perform miserably on this critical test. We only have to remember that the Obama administration originally used these same models barely a year ago to predict that unemployment would remain under 8% with the stimulus, when in reality it peaked over 10%. As it turns out, the experts' hugely imperfect understanding of our complex economy is not improved merely by coding it into a computer model. Garbage in, garbage out.

Thus we get to my concept I call knowledge laundering or certainty laundering.  I described what I mean by this back in the blogging dinosaur days (note this is from 2007 so my thoughts on climate have likely evolved since then).

Remember what I said earlier: The models produce the result that there will be a lot of anthropogenic global warming in the future because they are programmed to reach this result. In the media, the models are used as a sort of scientific money laundering scheme. In money laundering, cash from illegal origins (such as smuggling narcotics) is fed into a business that then repays the money back to the criminal as a salary or consulting fee or some other type of seemingly legitimate transaction. The money he gets
back is exactly the same money, but instead of just appearing out of nowhere, it now has a paper-trail and appears more legitimate. The money has been laundered.

In the same way, assumptions of dubious quality or certainty that presuppose AGW beyond the bounds of anything we have see historically are plugged into the models, and, shazam, the models say that there will be a lot of anthropogenic global warming. These dubious assumptions, which are pulled out of thin air, are laundered by being passed through these complex black boxes we call climate models and suddenly the results are somehow scientific proof of AGW. The quality hasn't changed, but the paper trail looks better, at least in the press. The assumptions begin as guesses of dubious quality and come out laundered at "settled science."

Back in 2011, I highlighted a climate study that virtually admitted to this laundering via model by saying:

These question cannot be answered using observations alone, as the available time series are too short and the data not accurate enough. We therefore used climate model output generated in the ESSENCE project, a collaboration of KNMI and Utrecht University that generated 17 simulations of the climate with the ECHAM5/MPI-OM model to sample the natural variability of the climate system. When compared to the available observations, the model describes the ocean temperature rise and variability well.”

I wrote in response:

[Note the first and last sentences of this paragraph]  First, that there is not sufficiently extensive and accurate observational data to test a hypothesis. BUT, then we will create a model, and this model is validated against this same observational data. Then the model is used to draw all kinds of conclusions about the problem being studied.

This is the clearest, simplest example of certainty laundering I have ever seen. If there is not sufficient data to draw conclusions about how a system operates, then how can there be enough data to validate a computer model which, in code, just embodies a series of hypotheses about how a system operates?

A model is no different than a hypothesis embodied in code. If I have a hypothesis that the average width of neckties in this year’s Armani collection drives stock market prices, creating a computer program that predicts stock market prices falling as ties get thinner does nothing to increase my certainty of this hypothesis (though it may be enough to get me media attention). The model is merely a software implementation of my original hypothesis. In fact, the model likely has to embody even more unproven assumptions than my hypothesis, because in addition to assuming a causal relationship, it also has to be programmed with specific values for this correlation.

This brings me to the paper by Paul Pfleiderer of Stanford University.  I don't want to overstate the congruence between his paper and my thoughts on this, but it is the first work I have seen to discuss this kind of certainty laundering (there may be a ton of literature on this but if so I am not familiar with it).  His abstract begins:

In this essay I discuss how theoretical models in finance and economics are used in ways that make them “chameleons” and how chameleons devalue the intellectual currency and muddy policy debates. A model becomes a chameleon when it is built on assumptions with dubious connections to the real world but nevertheless has conclusions that are uncritically (or not critically enough) applied to understanding our economy.

The paper is long and nuanced but let me try to summarize his thinking:

In this essay I discuss how theoretical models in finance and economics are used in ways that make them “chameleons” and how chameleons devalue the intellectual currency and muddy policy debates. A model becomes a chameleon when it is built on assumptions with dubious connections to the real world but nevertheless has conclusions that are uncritically (or not critically enough) applied to understanding our economy....

My reason for introducing the notion of theoretical cherry picking is to emphasize that since a given result can almost always be supported by a theoretical model, the existence of a theoretical model that leads to a given result in and of itself tells us nothing definitive about the real world. Though this is obvious when stated baldly like this, in practice various claims are often given credence — certainly more than they deserve — simply because there are theoretical models in the literature that “back up” these claims. In other words, the results of theoretical models are given an ontological status they do not deserve. In my view this occurs because models and specifically their assumptions are not always subjected to the critical evaluation necessary to see whether and how they apply to the real world...

As discussed above one can develop theoretical models supporting all kinds of results, but many of these models will be based on dubious assumptions. This means that when we take a bookshelf model off of the bookshelf and consider applying it to the real world, we need to pass it through a filter, asking straightforward questions about the reasonableness of the assumptions and whether the model ignores or fails to capture forces that we know or have good reason to believe are important.

I know we see a lot of this in climate:

A chameleon model asserts that it has implications for policy, but when challenged about the reasonableness of its assumptions and its connection with the real world, it changes its color and retreats to being a simply a theoretical (bookshelf) model that has diplomatic immunity when it comes to questioning its assumptions....

Chameleons arise and are often nurtured by the following dynamic. First a bookshelf model is constructed that involves terms and elements that seem to have some relation to the real world and assumptions that are not so unrealistic that they would be dismissed out of hand. The intention of the author, let’s call him or her “Q,” in developing the model may be to say something about the real world or the goal may simply be to explore the implications of making a certain set of assumptions. Once Q’s model and results become known, references are made to it, with statements such as “Q shows that X.” This should be taken as short-hand way of saying “Q shows that under a certain set of assumptions it follows (deductively) that X,” but some people start taking X as a plausible statement about the real world. If someone skeptical about X challenges the assumptions made by Q, some will say that a model shouldn’t be judged by the realism of its assumptions, since all models have assumptions that are unrealistic. Another rejoinder made by those supporting X as something plausibly applying to the real world might be that the truth or falsity of X is an empirical matter and until the appropriate empirical tests or analyses have been conducted and have rejected X, X must be taken seriously. In other words, X is innocent until proven guilty. Now these statements may not be made in quite the stark manner that I have made them here, but the underlying notion still prevails that because there is a model for X, because questioning the assumptions behind X is not appropriate, and because the testable implications of the model supporting X have not been empirically rejected, we must take X seriously. Q’s model (with X as a result) becomes a chameleon that avoids the real world filters.

Check it out if you are interested.  I seldom trust a computer model I did not build and I NEVER trust a model I did build (because I know the flaws and assumptions and plug variables all too well).

By the way, the mention of plug variables reminds me of one of the most interesting studies I have seen on climate modeling, by Kiel in 2007.  It was so damning that I haven't seen anyone do it since (at least get published doing it).  I wrote about it in 2011 at Forbes:

My skepticism was increased when several skeptics pointed out a problem that should have been obvious. The ten or twelve IPCC climate models all had very different climate sensitivities -- how, if they have different climate sensitivities, do they all nearly exactly model past temperatures? If each embodies a correct model of the climate, and each has a different climate sensitivity, only one (at most) should replicate observed data. But they all do. It is like someone saying she has ten clocks all showing a different time but asserting that all are correct (or worse, as the IPCC does, claiming that the average must be the right time).

The answer to this paradox came in a 2007 study by climate modeler Jeffrey Kiehl. To understand his findings, we need to understand a bit of background on aerosols. Aerosols are man-made pollutants, mainly combustion products, that are thought to have the effect of cooling the Earth's climate.

What Kiehl demonstrated was that these aerosols are likely the answer to my old question about how models with high sensitivities are able to accurately model historic temperatures. When simulating history, scientists add aerosols to their high-sensitivity models in sufficient quantities to cool them to match historic temperatures. Then, since such aerosols are much easier to eliminate as combustion products than is CO2, they assume these aerosols go away in the future, allowing their models to produce enormous amounts of future warming.

Specifically, when he looked at the climate models used by the IPCC, Kiehl found they all used very different assumptions for aerosol cooling and, most significantly, he found that each of these varying assumptions were exactly what was required to combine with that model's unique sensitivity assumptions to reproduce historical temperatures. In my terminology, aerosol cooling was the plug variable.

When I was active doing computer models for markets and economics, we used the term "plug variable."  Now, I think "goal-seeking" is the hip word, but it is all the same phenomenon.

Postscript, An example with the partisans reversed:  It strikes me that in our tribalized political culture my having criticised models by a) climate alarmists and b) the Obama Administration might cause the point to be lost on the more defensive members of the Left side of the political spectrum.  So let's discuss a hypothetical with the parties reversed.  Let's say that a group of economists working for the Trump Administration came out and said that half of the 4% economic growth we were experiencing (or whatever the exact number was) was due to actions taken by the Trump Administration and the Republican Congress.  I can assure you they would have a sophisticated computer model that would spit out this result -- there would be a counterfactual model of "with Hillary" that had 2% growth compared to the actual 4% actual under Trump.

Would you believe this?  After all, its science.  There is a model.  Made by experts ("top men" as they say in Raiders of the Lost Ark).  Do would you buy it?  NO!  I sure would not.  No way.  For the same reasons that we shouldn't uncritically buy into any of the other model results discussed -- they are building counterfactuals of a complex process we do not fully understand and which cannot be tested or verified in any way.  Just because someone has embodied their imperfect understanding, or worse their pre-existing pet answer, into code does not make it science.  But I guarantee you have nodded your head or even quoted the results from models that likely were not a bit better than the imaginary Trump model above.

Looking At Causes of Recent Wildfires and Resultant Property Damage, It's Hard To Point The Finger Solely or Even Mostly at CO2

Today I want to talk a bit about trends in wildfires in the US.  And as regular readers know, I have a real pet peeve about declaring a trend without actual, you know, trend data.  The media may be willing to jump from "most devastating fire in California history" to a trend just based on this one data point, but I am not going to play.

It turns out, though, that we don't have to play the one data point extrapolation game because there actually does seem to be a trend in wildfire.  Here is the national chart:

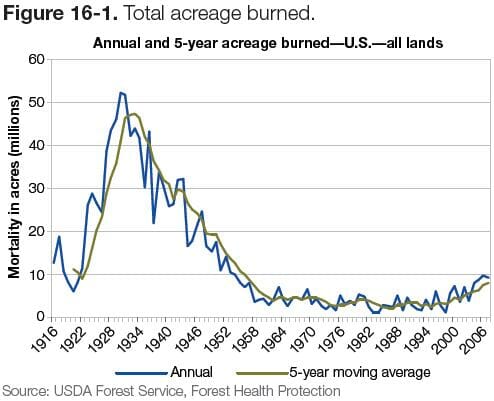
You might be saying:  Hey Coyote, you are cherry picking -- I have seen this same data but with a huge hump in the early part of the century.  Here is the chart you saw:

(source for both)  The problem with this chart is a huge definitional change in the data between the first and second half of the century.  In short, the early half of the century included controlled burns and other purposeful manmade actions (mostly in the southeast) and the latter half does not.  I described this here -- skeptics who use this chart are in serious danger of committing the same sloppy data errors we accuse warmists of (confession:  I made this mistake for a number of years).

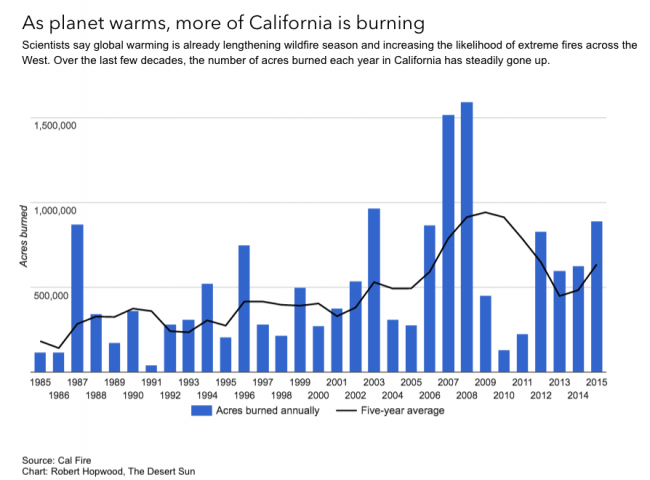
To complete our proof there is indeed a trend in wildfire and not just in wildfire news stories, here is the chart for California, though I cannot vet the source.  I will say its not a slam dunk trend but I will take it on faith, at least for now, that the recent years would be high and make the trend more obvious

OK, so there seems to be a wildfire trend in the West.  I will focus on California because that has been the area in the news.  Let's consider 4 possible causes:

  1. Temperature.  The state of California has seen a 0.02C per decade, or 0.2C per century increase in temperatures.  This is a very tiny increase and well below the increase thought to have occurred in other parts of the world.  The rise has been faster over the last 10 years or so but it is unclear if this is a long-term trend or a near-term weather effect (e.g. tied to the PDO)
  2. Precipitation.   Total precipitation has decreased by ever so slightly over the last 100 years.  A half inch per century is about a 2% reduction
  3. Forest management.  The amount of wood harvested, and thus fuel removed, from forests has dropped by 80% since the 1950s
  4. Urbanization.  This does not necessarily increase fire acreage but it does substantially increase the probability a given fire will impinge on man-made structures.  Also, given the enormous almost exponential increase in total CA real estate value, the likely cost of fires of the same size and intensity has risen dramatically.  Much of the developed area affected by fires the last several years have been in the red and purple parts of the map that were developed most recently.  Fifty years ago they would have just burned trees (source).  More CA urbanization trends here.

So, what is causing the large fires?  Well, probably a lot of things.  I am a big believer that changes in outputs from complex systems can have complex causes (which is why I think the whole meme that "CO2 is the Earth's thermostat" is an embarrassing joke).  But given that over the last 50 years temperatures have risen by a fraction of a degree, precipitation has dropped by a fraction of an inch, but fuel removal has dropped by 80% and urbanization has skyrocketed, it is really hard for me to pin all or even most of the blame on manmade CO2.

Postscript:  One other point -- California is less than 0.1% of the total land area of the Earth.  I have a hard time extrapolating global climate trends from a few big events in 1/1000th of the world.

Postscript #2:  I missed this, that hotbed of climate denial called Mother Jones had an article a year ago blaming California fires on forest management policy, specifically preventing lots of little fires leading to one big fire.

Warmists and Skeptics Should Agree That This is The Real Scandal in Climate Science

Imagine that for some reason you desperately needed to be under a certain weight.  I am old enough to think of the relatively obscure movie Vision Quest where a high school wrestler is trying to drop two weight classes.  If you were in that situation, what is the first investment you would make?  Exercise equipment?  Nutrition guides?  A personal trainer?  No!  You would invest in a good, accurate scale.  Because without being able to measure the variable (in this case weight) you care about, everything else is worthless.

As trivial an observation as this may seem, the fact is that the world's governments have spent tens, perhaps hundreds of billions of dollars on global warming research and mitigation and have done almost zero to build out and improve a reliable temperature measurement system and historical temperature database.   We have absolutely failed over the last 30 years to substantially improve our actual measurement of the warming we are so concerned about.

There are at least two problems with our temperature data, the first of which I have written about many times before -- our surface temperature measurement infrastructure is full of bad installations whose design and location bear no resemblance to best-practice standards.  The most common problem is that temperature measurement stations are located in places that are subject to a lot of local biases, particularly urban development and heat islands.  I wrote about a classic example I discovered right here in Arizona.  And while the US has taken a few steps to eliminate the most egregious locations, many bad ones still exist.  And problems with the US infrastructure are nothing compared to issues with the infrastructure in other countries.  There still are only a handful of measurement locations in huge continents such as Africa and Antarctica, with quality problems equal to or greater than those in the US.

Parallel to the land surface data, we have a second temperature data set taken from satellites that has nearly as many issues.  Satellite data eliminates some of the problems of the surface data set:  it does not have large gaps in coverage and it is not subject to local biases, such as urban heat islands.  It does have the problem of not actually measuring the surface temperature, but rather the lower troposphere, but this is exactly where computer models predict the largest global warming signal to occur, so it is still useful.  But there have been many under-investment problems here, too.  The history of temperature versions of the UAH satellite temperature data base has many ups and downs that must be corrected -- this satellite fell out of the sky and then this one has sensor drift and then this other one went off course.  Despite the large and vocal role of the Goddard Institute for Space Studies (GISS) in climate research, the database they maintain is a surface temperature database and they seem to do little to support space measurement, leaving it to a few small groups to learn something from the satellites.   It's as big mess, made worse by the political factor of the space temperature database getting lower warming rates and being maintained by a skeptic while the surface temperature databases show more warming and are maintained by folks more pessimistic about warming rates.

To this picture we can add substantial problems with the historical temperature record.  The Hadley CRUT database is generally considered the gold standard in surface temperature records and is used by most researchers.  There are some problems with the database that are hard to fix -- for example, for 1850 there is apparently only 1 temperature station in the database for the entire southern hemisphere, which means half the world's temperature is being extrapolated from one site in Indonesia.  We can't get in a time machine and sprinkle the world in 1850 with more thermometers.  But we can try to take some sort of estimate of the potential error induced by such spotty measurement, something I have never seen done in the CRUT database.  The data in 1850 is always presented as just as solid as that in 1950 (see my last global temperature update).

Apparently, a PHD student in Australia recently audited the CRUT database as his thesis project. Before you get into his results, here is one thing to consider: Literally trillion-dollar decisions are being made based on this database and based on research which uses this database, and no one has bothered to do this previously until some random grad student in Australia gives it a shot?  By the way, it should be noted that once he completed what should have been warmly welcomed by the climate community with a "Dang, can't believe we didn't do that already," he has instead gotten nothing but grief and criticism.

The thesis is paywalled, (just $8, I have bought a copy and am slogging through it now) but Anthony Watt summarizes:

HadCRUT4 is the primary global temperature dataset used by the Intergovernmental Panel on Climate Change (IPCC) to make its dramatic claims about “man-made global warming”.  It’s also the dataset at the center of “ClimateGate” from 2009, managed by the Climate Research Unit (CRU) at East Anglia University.

The audit finds more than 70 areas of concern about data quality and accuracy.

But according to an analysis by Australian researcher John McLean it’s far too sloppy to be taken seriously even by climate scientists, let alone a body as influential as the IPCC or by the governments of the world.

Main points:

  • The Hadley data is one of the most cited, most important databases for climate modeling, and thus for policies involving billions of dollars.
  • McLean found freakishly improbable data, and systematic adjustment errors , large gaps where there is no data, location errors, Fahrenheit temperatures reported as Celsius, and spelling errors.
  • Almost no quality control checks have been done: outliers that are obvious mistakes have not been corrected – one town in Columbia spent three months in 1978 at an average daily temperature of over 80 degrees C.  One town in Romania stepped out from summer in 1953 straight into a month of Spring at minus 46°C. These are supposedly “average” temperatures for a full month at a time. St Kitts, a Caribbean island, was recorded at 0°C for a whole month, and twice!
  • Temperatures for the entire Southern Hemisphere in 1850 and for the next three years are calculated from just one site in Indonesia and some random ships.
  • Sea surface temperatures represent 70% of the Earth’s surface, but some measurements come from ships which are logged at locations 100km inland. Others are in harbors which are hardly representative of the open ocean.
  • When a thermometer is relocated to a new site, the adjustment assumes that the old site was always built up and “heated” by concrete and buildings. In reality, the artificial warming probably crept in slowly. By correcting for buildings that likely didn’t exist in 1880, old records are artificially cooled. Adjustments for a few site changes can create a whole century of artificial warming trends.

Details of the worst outliers

  • For April, June and July of 1978 Apto Uto (Colombia, ID:800890)  had an average monthly temperature of  81.5°C, 83.4°C and 83.4°C respectively.
  • The monthly mean temperature in September 1953 at Paltinis, Romania is reported as -46.4 °C (in other years the September average was about 11.5°C).
  • At Golden Rock Airport, on the island of St Kitts in the Caribbean, mean monthly temperatures for December in 1981 and 1984 are reported as 0.0°C. But from 1971 to 1990 the average in all the other years was 26.0°C.

The last point about past thermometer adjustments is one I have run into before when I was looking at urban heat islands and their effect on temperature measurement (by the way this is a really great science fair project if you are looking for one).  Past urban heat adjustments seem to imply (by cooling the past more than the present) that urban heat biases on measured temperatures have gone down over time, which defies all logic and experience.

There is a lot more of interest at the link, but it strikes me as shear madness, bordering on fraud, that there seems to have been so little effort put into data integrity of perhaps the single most important non-economic dataset in the world.  I would presume that warmists, who constantly accuse skeptics of being "anti-science" would be the first to line up in favor of investing whatever is necessary in better, cleaner data.  So far, there has only been criticism of the effort.

Postscript:  The temperature adjustment issue is an important one.  In short, as seen below, the magnitude of the temperature adjustments in the US temperature database equal the magnitude of the warming.  In other words, the warming signal comes entirely from the adjustments.  This does not mean the signal is being read incorrectly, but it does mean that getting the adjustments (and their error bars, which no one ever includes) correct is perhaps the single most important issue to a good historical database.

A Request To Send Me Graphs of Negative Climate Trends

For years I have been mocking attempts to "prove" negative climate trends from a single data point. Too often a single event (e.g. strong hurricane landfall) is treated as "proof" of a trend, though how anyone who styles themself as "scientific" can claim a trend from a single data point is beyond me.  Every time someone claims a trend in, say, hurricane strength or drought or crop yields, I never can see any trend in the actual archived data for those phenomena.

So I am soliciting real medium and long-term trend data that points to some sort of negative climate trend.  To save folks time, I know of and have the data for several already:

  • Increasing worldwide average temperatures, as measured both on the ground and in the lower troposphere by satellites
  • Increasing number of record high nighttime low temperatures (yes, I know, this is always confusing)
  • Arctic (but not Antarctic) sea ice extent, at least over the last 50 years
  • US heavy rainfall events
  • Sea level rise

Note that at this point I do not care if the trend is natural or manmade or if you can really specify a difference (which I would argue you likely cannot).  For example the sea level rise trend of 2-3mm a year goes all the way back to before 1850, and thus is hard to ascribe totally to man-made CO2 which has mostly been produced in the latter half of the 20th century.

Here are some rules:

  • Must have a link to original data source or at least the original chart source (some groups are terrible about archiving the actual data), which can be a study or a group that actively measures the phenomenon.
  • It can't just be for a limited geography.  North Carolina is too small.  The Antarctic Peninsula is too small.  The US is really too small but I will accept it because the US temperature data is some of the most complete in the world.  But don't send me a limited geography when the same data is available for a larger geography (ie only hurricanes in the Indian Ocean when we have hurricane data for the whole globe).
  • It needs to be for as long of a time period as possible, and if you cut off early or late data there has to be a reason.  large changes in measurement approach can be a valid reason for leaving out data -- for example, small tornadoes before the advent of doppler radar and moder tornado tracking are likely undercounted.  Ditto hurricanes.
  • It can't be based on a model.  It has to be actual readings, not model estimates.  Have a care on this -- many pieces of historical data that are presented as actual measurements are actually model results.
  • It needs to be a weather or climate metric.  If you want, you can send me potentially derivative variables and I might present these in another section, but they tend to be suspect because the causality extends beyond climate.  An example of this is forest fire acreage burned, which can relate to climate but also can relate to forest management, forest health and insect threats, and firefighting philosophy as well.  Other similar metrics include crop yields, disease rates, refugees, wars, and a zillion other things that get attributed in some study to climate change.

Anything that passes these rules will get posted, though I reserve the right to comment.

Update:  Comments section is OK, but email is better.  Click the contact link up at the top.

Media Selection Bias is One Reason Many People Have a False Impression of Increasing Extreme Weather

The media will breathlessly promote stories about any weather event in tail of the distribution curve.  I have written many times that this creates a false impression that these events are becoming more common.  Another element of this selection bias is what gets left out.  Does anyone doubt that if we were having a record-heavy tornado season, this would be leading every newscast?  If but if a record-heavy year is newsworthy, shouldn't a record-light year be newsworthy as well?  Apparently not:

source

Which reminds me of this chart Kevin Drum had the other day as "proof" of man-made climate change

I am not going to bother to go to their data source and pick it apart, though my guess is that I could.  But without even looking at the data sources I know this is garbage.  Think about places where there are large natural disasters in the US -- two places that come to mind are California fires and coastal hurricanes.  Do you really think that the total property value in California or on the US coastline has grown only at inflation?  You not only have real estate price increases, but you have the value of new construction.  The combination of these two is WAY over the 2-3% inflation rate.  This effect is magnified by the nature of the metric, which is not total losses but losses over some threshold.  This sort of threshold metric is easy to game, and says nothing for the total losses which would be a better measurement.

By the way, I am wondering how he automatically blames all of these natural disasters on manmade climate change.  Take the most recent, disastrous fires that hit the Redding, California area this year.  That fire started on BLM (federal) land.  When it was small, California State Fire (CalFire) personnel showed up to put it out.  The BLM told them to go away.  The chance to put the fire out when it was small was lost.  How do you blame a fire that was really due to moronic intergovernmental rivalry and bad forest management policy on climate change?

I won't repeat the charts but this post has charts on many extreme weather events and shows that, with the exception of large rainfall events, there is no trend in any of them.

The Failure of Technocratic Government Economic and Energy Policy

The news came out the other day that Porsche will stop making diesel-engine cars.  This is the beginning of the end of significant diesel car production in Europe, and is the ultimate proof that the diesel engine is a dead-end technology choice for Europeans concerned with the environment.

The story is a long one and I will leave you with some links in a moment, but the basic story flow is:

  • European governments are concerned about CO2 production, want to "do something"
  • European car-makers have a lead over the rest of the world in diesel technology, urge governments to choose diesel as the technology of the future, since at the time it was more efficient than gasoline engines.
  • European governments, hot to "do something" and also keen to do it in a way that seems to advantage domestic producers in the high profile automobile trade, promote diesel in a number of ways (including lowering taxes on diesel fuel and diesel car purchases).
  • As Europeans adopt diesel, problems emerge as air quality degrades -- diesels may be more efficient, but have a number of harmful emissions that are far worse than with gasoline engines.  There are tests and standards for these emissions but it is discovered that most manufacturers are cheating on emissions tests.
  • Too late, it is realized that other technologies (electric hybrids, all electric) are pushing well past diesel in terms of efficiency.  Diesel is a dead-end in terms of CO2 reduction, and increases harmful emissions.
  • Emissions tests are tightened, but it is clear manufacturers cheated because they do not have the technology to produce cars people will buy that meet the standards.  Companies like Porsche start to exit the business.

One of the best articles I have found about this history is actually at Vox, that bastion of free market economics and government non-interventionism.

The failure here is entirely predictable and is subsumed in the general criticism of "government picking winners."  As with many such failures, they boil down to information and incentives.  In terms of information, folks in government have no idea of the range of technology choices now and in the future, and how these technology choices might or might not make sense in a broad range of applications.  In terms of incentives, government officials usually have very different true incentives from their publicly stated ones (in this case CO2 reduction).  In the US, the Feds continue to support insanely stupid ethanol subsidies and mandates in part because the first Presidential primary is in corn state Iowa.  In Europe, it may well have been that officials were more ready to support diesel, which Europeans were good at, over hybrids, which Asian companies were good at, no matter what the relative merits were.

If you think that is cynical, even the folks at Vox noticed:

At the time, there were lots of different paths Europe's automakers could have taken to green itself. They could've pursued direct injection technology for gasoline vehicles, making those engines more fuel-efficient. They could've ramped up development of hybrid-electric cars, as Toyota was doing in Japan. But European companies like Peugeot and Volkswagen and BMW had already been making big investments in diesel, and they wanted a climate policy that would help those bets to pay off.

Europe's policymakers obliged. The EU agreed to a voluntary CO2 target for vehicles that was largely in line with what diesel technology could meet. As researcher Sarah Keay-Bright later noted, these standards were crafted so as not to force Europe's automakers to develop hybrids, electric vehicles, or other advanced powertrains.

The result?

Although overall pollution in Europe has gone down over time, diesel vehicle emissions remain stubbornly high. Today, Paris sometimes has smoggy days comparable to those in Beijing. London is struggling with unhealthy levels of nitrogen dioxide. Germany, Austria, and Ireland have NOx pollution well above the legal limits, with vehicles accounting for roughly 40 percent of that output.

The health toll is likely considerable. One recent study estimated that diesel pollution from cars, buses, and trucks in Britain caused 9,400 premature deaths in 2010 alone. It's difficult to pinpoint what fraction of those deaths might have been avoided if emission rules on cars had been strictly enforced all along, but that gives a sense of the stakes.

Even Vox is willing to call for some technocratic humility:

Which brings us to the third takeaway. The future is hard to predict. Diesel cars seemed like a reasonable idea in the 1990s and a disaster today. That suggests that policymakers should have a lot more humility when crafting energy policy. Maybe battery-electric cars will win out, or maybe it'll be hydrogen, or maybe it'll be something else entirely. (Heck, perhaps diesel cars that are genuinely clean could play a role in reducing CO2 emissions.) No one knows for sure.

So one approach here might be to pursue technology-neutral policies focused on preferred outcomes — say, tightly enforced standards that require lower emissions — rather than favoring specific industries and technologies just because they happen to seem promising at that moment in time.

This conundrum is likely to come up again and again. For years, governments have been laying down big bets on emerging clean energy technologies. France did it with nuclear power in the 1970s and '80s. Germany did it with wind and solar power in the 2000s, through feed-in tariffs. The United States has done it with corn ethanol in the past decade.

Done right, this sort of government support can be valuable, helping useful new energy options break into the mainstream against entrenched competition. But there's also a huge risk that governments will end up gambling on badly flawed technologies that then becomethe entrenched competition — and prove impossible to get rid of. The US arguably made that mistake with ethanol, which has had unintended ripple effects on the food supply and deforestation that are proving politically difficult to untangle. The drive for diesel looks like it belongs in that category, too. It's not a story we'd like to keep repeating.

Thus we get to my plan, which eliminates all these political interventions in favor of a revenue-neutral carbon tax.

Libertarians Are Terrible At Persuasion in the Social Justice Language of Power and Privilege, and We Should Be Better At It. There is Definitely Common Ground to Be Explored

Why use the language of Power and Privilege at all?

One of my favorite political books is Arnold Kling's Three Languages of Politics (free download here).  It is a great reference for understanding why so much of politics devolves into talking past one another, and is a great guide for those who want to be persuasive outside of one's own tribe.

As background, I am a life-in-the-real-world (LIRW) libertarian who is most comfortable arguing on the freedom-coercion axis and based on economic efficiency.  LIRW libertarian means that I don't answer every policy question with a knee-jerk anarcho-capitalist get-the-government-out-of-the-way policy prescription.  I accept that government coercion is not going away and I can accept some state coercion in support of certain policy goals.   However, in doing so I assign something I call the Cost of Coercion to policy proposals in balancing out the costs and benefits and the coercion cost I assign will be high.  As such, then, I tend to discuss policy in terms of meeting goals with maximum economic efficiency and minimum levels of coercion.

In this article I want to talk about my (and other libertarians') attempts to engage (or failures to engage) Progressives on their preferred Oppressor-Oppressed axis.  While I think everyone benefits from learning to engage with folks who speak different political languages, doing so is particularly important for libertarians in the United States because we are the odd man out in the current two-party system.  Half our issues (e.g. free markets, limited government) require common cause with Conservatives while the other half (e.g., open immigration, drug legalization, gay marriage) require making common cause with Progressives.  In this article I want to talk about my (and other libertarians') attempts to engage Progressives on the Oppressor-Oppressed axis.

To start, I feel like I am pretty good at understanding the Progressive point of view on many issues (e.g. my intellectual Turing test here on Progressive arguments for the minimum wage).

However, on the airplane yesterday I was looking back at my proposed trans-partisan plan on climate action and found I did little in it to excite Progressives.  I still think that this is a very fair plan that could appeal to both Progressives and Conservatives, but I realize in retrospect that it does almost nothing to sell the plan to Progressives.  The article is mostly economic efficiency arguments that can sway Conservatives (at times) but seldom have a lot of power with Progressives.  Sure, the plan gives Progressives what they are asking for (a carbon tax) but I acknowledge in the article that there is evidence from the Washington State carbon tax vote that Progressives don't actually understand the benefits of a carbon tax very well.  Here, for example, is how I discussed the shift from a myriad of scattershot government interventions to the carbon tax:

Point 1: Impose a Federal carbon tax on fuel....So what is the best way to reduce CO2 -- by substituting gas for coal?   By more conservation?  By solar, or wind?  With biofuels?  With a carbon tax, we don't have to figure it out or have politicians picking winners.  This is why a Pigovian tax on carbon in fuels is going to be the most efficient possible way to reduce CO2 production.   Different approaches will be tested in the marketplace....

Point 3:  Eliminate all the stupid stuff...[in turn] I propose that we eliminate all the current Federal subsidies, mandates, and prohibitions that have been justified by climate change. Ethanol rules and mandates, solar subsidies, wind subsidies, EV subsidies, targeted technology investments, coal plant bans, pipeline bans, drilling bans -- it all should go.  The carbon tax does the work.

Picture the social justice warriors at some college today -- are they going to be excited by this?  I doubt it.  But what if I said this instead:

We should shift climate efforts from all the disparate, scattershot efforts today to a neutral carbon tax that is impossible for the powerful and privileged to game to their advantage. Current climate programs are all more likely to benefit Wall Street bankers and crony political interests than they are to help the climate.  For example, the Koch brothers have publicly admitted that their company is one of the largest beneficiaries of the current ethanol program, which was meant to benefit the climate but instead just pumps profits into a few well-connected multi-billion dollar corporations, while taking food from the poor and feeding it into people's gas tanks.

This second version, while it needs some polish, is clearly more compelling to a Progressive, and all of it is something I believe -- It's just not the first way I naturally defend the plan.  I need to get better on this.

Power and Privilege are a Useful Framework (among others) for Analyzing History and Public Policy

I have studied a lot of history in my life, mostly as a hobby.  When I first started studying history in secondary school in the 1980's, it was almost all presented as "great man" history -- i.e. history can be described as driven primarily by the actions of prominent individuals.  Julius Caesar did this and Henry the VIII did this other thing, etc.   Really, this approach to history was being overtaken even 100 years earlier than this, but I didn't really get exposed to other approaches until college.  There, I began to learn that Marxist historians in the 20th century brought a different view, that most of history was driven by big social and economic and demographic changes rather than individuals -- think Hari Seldon if you know that reference.

But the Marxists had a familiar problem (other than the obvious one where they explain every event in history as a class struggle and proto-Marxist revolution): They brought a great new tool to the analysis of history but then declared that it was the ONLY correct tool.  But there are plenty of historical turns where individuals mattered.  The revolution in Rome from the Republic to the Empire was probably inevitable from the large forces at work, but was the end of the civil wars in favor of decades of peace inevitable without the acumen of Augustus?

Other groups have contributed yet more lenses for looking at history.  I remember when it became de rigueur that history courses include lectures on life of the common person, the experience of women, and on other groups that don't have a big presence in the traditional historic record.  I initially rolled my eyes thinking that this all was a politically correct placeholder, but I eventually found it fascinating -- to the extent that I have since taken whole courses solely on the experience of common people in the Middle Ages and the Roman Empire.

To this same end, power and privilege is yet another useful framework for analyzing history.  The problem in my mind comes in the fact that so many students go through college, even graduate from college in history, looking at the world ONLY through this one lens.  To me this is madness.  It is like trying to play golf with just a 2-iron or to do math with just cosines.

Libertarians and the Power & Privilege Language

As demonstrated in my climate example earlier, there is no reason libertarians cannot engage progressives on the power and privilege or oppressor/oppressed axis.  Libertarians care a lot about the ability of the individual to be able to make decisions and live their life without coercion.  Many of the same things that upset progressives -- racism, sexism, various sorts of sexual prohibition, narcotics prohibition, fraud, migration restrictions, military interventionism -- also upset libertarians.  Libertarians and progressives both talk a lot about power and abuse of power, though granted they fear different sorts of power: libertarians tend to have more fear of government power, while progressives tend to fear any sort of economic power.  But even getting that far is at least a basis for meaningful discussion.  If you want to have an interesting discussion with a progressive, do what I did with one of my progressive in-laws and watch Michael Moore's Capitalism: A Love Story together.  The progressive will gladly watch it with you because they will think you are about to get schooled.  But watch as the movie unfolds -- failure after failure that Moore wants to describe to capitalism are in fact mostly due to crony government interventions to which libertarians are strongly opposed.  There is a surprising amount of common libertarian-progressive ground in the movie if you look past Moore's interpretation of these failures and pay attention to their actual causes.

This is what I had in mind when I wrote my recent article in Regulation Magazine, "How Labor Regulation Harms Unskilled Workers", to try to write something about labor regulation that was pitched more to progressives than to libertarians and conservatives.  Too often articles on the minimum wage focus solely on economic efficiency, or worse, on how labor market interventions negatively impact businesses.  When progressives see that something negatively impacts businesses, their first reaction is "awesome, let's do more of it!"  Not a great sales approach.   In my article, I was never going to convince progressives to give up on regulation of the terms and conditions of labor altogether -- it is simply too deeply ingrained in their philosophy that workers are powerless in the face of employers and need external protection.  But it might be possible to show progressives why something like the minimum wage can be a bad anti-poverty program that it actually tends to hurt the poorest and most vulnerable and least skilled.

The absolute best example I can think of how libertarian attempts to engage progressives have been terrible is the book by Nancy MacLean called Democracy in Chains.   The book makes the weird and not very well substantiated claim that James Buchanan, who won a Nobel Prize for his work in public choice theory, was heavily influenced by southern slavery supporters like John Calhoun, and thus, uh, public choice is racist or evil or something.  The book tends to get lauded by people who mostly like its thesis but did not read it and torn apart by academics who are hugely skeptical about its logic and factual basis.  The most amazing thing about the book is just how incurious Ms. MacLean is about public choice theory itself -- the head of the national organization of public choice economists is a professor on her own campus, with an office just a short walk away, yet she never consulted anyone in the field.

Here is why I highlight it, and not to beat up on a progressive who in turn beat up on a libertarian icon.  Public choice theory -- as I and most people who have studied it understand it -- should be tremendously interesting to progressives, so much so I think it could be a core text they study.  Not because I want to make them not-progressives (I will send them to Hayek for that) but because public choice theory says so much about how power and privilege are created and sustained.  Want to understand why Wall Street makes so much money and is so seemingly immune to accountability, check out public choice theory.  Want to know why you and I spend billions to subsidize profitable corporations like Boeing or Koch Industries, check out public choice theory.  Want to understand why public interventions often fail so you can make better interventions in the future, check out public choice theory.

The reason progressives don't look at public choice theory this way is in large part because libertarians have adopted public choice theory as their own and use it most often to push back on nearly every government intervention.  In particular, the Koch Brothers and Cato love public choice theory and use it to argue for small government, so in the tribal politics of the day, this means that progressives have to hate it.  I would argue that the best description of Nancy MacLean's approach to James Buchanan and public choice theory in her book (and her  more-than-apparent lack of desire to learn anything about it) is the fact that public choice theory is associated with the Koch Brothers and thus she wanted to bring it down to help bring down the Koch siblings who have become a progressive bete noire (despite their actually supporting a lot of progressive causes like gay marriage).  Ironically, from my limited reading, James Buchanan appears to have treated public choice more as a guide to good government than a trump card to be played against any government intervention.

This is why the book I would most like to write, if I had the academic chops and time to write it, would be "Public Choice for Progressives:  What James Buchanan can teach good government and equalizing power and privilege."  There are a lot of things libertarians and progressives are never going to agree on, but there are enough that we can agree on to make it worthwhile to learn their language.

Media Extrapolating a Trend From A Single Data Point: 2018 Heat Wave Edition

This article in something called Inside Climate News seems to be typical of many I have seen this year:  Because we have had much attention in the media on heat waves this year, there must be an upward trend in heat waves and that is a warning signal that man-made global warming is destroying the planet.  Typical of these articles are a couple of features

  1. Declaration of a trend without any actual trend data, but just a single data point of events this year
  2. Unstated implication that there must be a trend because the author can't remember another year when heat wave stories were so prevalent in the media
  3. Unproven link to man-made global warming, because I guess both involve warmth.

I have no idea if well-publicized heat waves this year are a harbinger of an accelerating global warming trend.  But since we are discussing "trends" it struck me as useful to actually liven up the discussion with some actual trend data, ie data for more than one summer.  There is a real danger to extrapolating trends from volume of media coverage, as I discussed here.  If you don't want to click through, I have a funny story in the postscript.

First, our most reliable temperature trend data does not really show a spike in temperatures this summer.  Remember, a heat wave that covered the entire US would only affect 6% of the world's landmass and <2% of the world's total area (source).  You can easily see the trend upwards several tenths of a degree over the last 40 years, but it is impossible to see much unique about the last 3 months of summer.

Second, there really is no substantial upward trend in US heat wave index (from right off the EPA's web site, as are all of the following charts.  Look at the source for yourself to make sure I am not playing games).  Note that all of the following charts are through 2016 and do NOT include the recent summer but are pretty meaningful none-the-less.

Third, in most of the country, there is actually a downward trend rather than upward trend in extreme heat days.

Pretty much everyone agrees, skeptics included, that the world and the US has warmed.  So why are extreme heat days down in many locations, and certain down from the 1930's?  This defies our intuition.  The explanation is in part due to a feature of global warming that is seldom explained well by the media, that much of the warming we see and as predicted in climate models is in the night.  We are seeing some increase in hot daytime highs, but really not at an unprecedented level over the last century.  BUT, we see MUCH more of a trend in hot daily lows, which basically means warming evenings.

I spoke at Amherst College a while back and here was their temperature trends, broken up between daily highs and nighttime lows.  All of Amherst's temperature trend since 1950 has not been in increased daytime highs but higher nighttime lows.  This is a pattern you see repeated over and over at nearly every temperature station.

This is why I consider media reports of heat waves, at least of the scope we have seen to date, absolutely irrelevant to "proving" the world is warming.

Postscript:  Here is the story everyone should keep in mind when extrapolating from media coverage volume to underlying trends:

let's take a step back to 2001 and the "Summer of the Shark." The media hysteria began in early July, when a young boy was bitten by a shark on a beach in Florida. Subsequent attacks received breathless media coverage, up to and including near-nightly footage from TV helicopters of swimming sharks. Until the 9/11 attacks, sharks were the third biggest story of the year as measured by the time dedicated to it on the three major broadcast networks' news shows.

Through this coverage, Americans were left with a strong impression that something unusual was happening -- that an unprecedented number of shark attacks were occurring in that year, and the media dedicated endless coverage to speculation by various "experts" as to the cause of this sharp increase in attacks.

Except there was one problem -- there was no sharp increase in attacks. In the year 2001, five people died in 76 shark attacks. However, just a year earlier, 12 people had died in 85 attacks. The data showed that 2001 actually was a down year for shark attacks.

Update:  I am not really an active participant in the climate scene any more, particularly when positions hardened and it was impossible to really have an interesting discussion any more.  The implicit plea in this post goes beyond climate -- if you are claiming a trend, show me the trend data.  I can be convinced.  There is clear trend data that temperatures are increasing so I believe there is an upward trend in temperatures.  Show me the same for droughts or heat waves or hurricanes and I will believe the trend about those as well, but so often the actual data never matches the arm-waving in these media sources.

YouTube Does Not Actually Understand The Skeptic Position: It Put A Warning On My Climate Video Saying Exactly What I Said

I have made this point in the past, but very few folks on the warming-panic side of the climate debate actually are familiar with even the most basic outlines of what skeptics argue.  The climate debate is one of the worst examples I can think of where partisans gain their only knowledge of what the other side is saying from slanted and ill-informed descriptions of the opponents by their own side.  This is roughly like my informing myself of Hillary Clinton's political positions solely from listening to Rush Limbaugh.

YouTube has adopted a policy of putting information / warning labels on videos by climate skeptics.  Here is a screen shot, the YouTube addition is in the beige box:

This is the only example I know of YouTube doing this -- for example, you can't find information labels on, say, 9/11 Truther videos reading "steel doesn't have to melt to fail" or on Bernie Sanders socialist videos saying "adopting Marxism led to the deaths of tens of millions of people in the 20th century."  So I guess we climate skeptics are considered by Google to be the worst of the worst on the truth scale.

But the truly hilarious part is that I don't disagree with this statement one bit**.  Neither does any other prominent skeptic I know of.  In fact, I have queued up the video to the 19:30 mark and you can watch me say exactly this.


Clearly, Google does not actually know what climate skeptics say.  In fact, much of the video (which despite being 2 years old is still my current position on the topic and a good introduction to the climate debate) is about this very topic -- how what skeptics actually say and what warmists say what we way are so different, and how that SNAFU's the climate debate.  One of my most popular articles in Forbes was on the same topic.

Postscript:  I am not a conspiracy theorist, and try not to assign arcane outcomes in chaotic systems to subterfuge.  But I do find it odd that when I Google myself, in the fourth position is random critique of one of my climate articles.  There have been much more intelligent critiques of me historically than this one, and this particular critique garnered far fewer reads and inbound links than the original article, which shows up nowhere in the search.  I am not persuaded that Google is putting its thumb on the scale in favor of critiques of skeptics, but I could be.

**Though I might quibble with equating climate change and global warming.  They are obviously related but certainly not equivalents.

Is Sever Weather Really Getting Worse?

Expert Consensus

Do you disagree with any of these propositions?

  • increases in minimum wages almost always causes job losses among the poor and unskilled
  • GMO's and genetically modified foods have zero proven negative effects on the body or the environment
  • homeopathy is completely useless and has zero medical benefits beyond any potential placebo effects

All of these are super-majority consensus statements in their respective fields.  It's fine if you are skeptical of any of them (and even better if you can justify this skepticism with a reasonably intelligent scientific argument).  But don't tell me that I am somehow inherently wrong to challenge the climate orthodoxy.