More Thoughts on Historic Temperature Adjustments
A few posts back, I showed how nearly 85% of the reported warming in the US over the last century is actually due to adjustments and added fudge-factors by scientists rather than actual measured higher temperatures. I want to discuss some further analysis Steve McIntyre has done on these adjustments, but first I want to offer a brief analogy.
Let's say you had two compasses to help you find north, but the compasses are reading incorrectly. After some investigation, you find that one of the compasses is located next to a strong magnet, which you have good reason to believe is strongly biasing that compass's readings. In response, would you
- Average the results of the two compasses and use this mean to guide you, or
- Ignore the output of the poorly sited compass and rely solely on the other unbiased compass?
Most of us would quite rationally choose #2. However, Steve McIntyre shows us a situation involving two temperature stations in the USHCN network in which government researchers apparently have gone with solution #1. Here is the situation:
He compares the USHCN station at the Grand Canyon (which appears to be a good rural setting) with the Tucson USHCN station I documented here, located in a parking lot in the center of a rapidly growing million person city. Unsurprisingly, the Tucson data shows lots of warming and the Grand Canyon data shows none. So how might you correct Tucson and the Grand Canyon data, assuming they should be seeing about the same amount of warming? Would you
average them, effectively adjusting the two temperature readings
towards each other, or would you assume the Grand Canyon data is cleaner
with fewer biases and adjust Tucson only? Is there anyone who would not choose the second option, as with the compasses?
The GISS data set, created by the Goddard Center of NASA, takes the USHCN data set and somehow uses nearby stations to correct for anomalous stations. I say somehow, because, incredibly, these government scientists, whose research is funded by taxpayers and is being used to make major policy decisions, refuse to release their algorithms or methodology details publicly. They keep it all secret! Their adjustments are a big black box that none of us are allowed to look into (and remember, these adjustments account for the vast majority of reported warming in the last century).
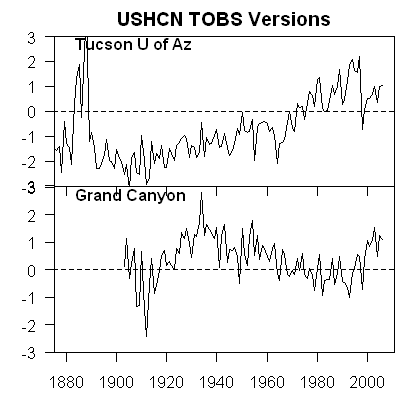
We can, however, reverse engineer some of these adjustments, and McIntyre does. What he finds is that the GISS appears to be averaging the good and bad compass, rather than throwing out or adjusting only the biased reading. You can see this below. First, here are the USHCN data for these two stations with only the Time of Observation adjustment made (more on what these adjustments are in this article).
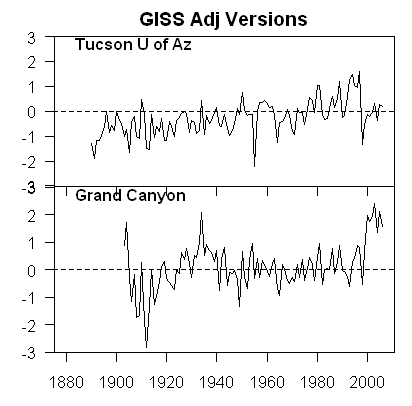
As I said above, no real surprise - little warming out in undeveloped nature, lots of warming in a large and rapidly growing modern city. Now, here is the same data after the GISS has adjusted it:
You can see that Tucson has been adjusted down a degree or two, but Grand Canyon has been adjusted up a degree or two (with the earlier mid-century spike adjusted down). OK, so it makes sense that Tucson has been adjusted down, though there is a very good argument to be made that it should be been adjusted down more, say by at least 3 degrees**. But why does the Grand Canyon need to be adjusted up by about a degree and a half? What is biasing it colder by 1.5 degrees, which is a lot? The answer: Nothing. The explanation: Obviously, the GISS is doing some sort of averaging, which is bringing the Grand Canyon and Tucson from each end closer to a mean.
This is clearly wrong, like averaging the two compasses. You don't average a measurement known to be of good quality with one known to be biased. The Grand Canyon should be held about the same, and Tucson adjusted down even more toward it, or else thrown out. Lets look at two cases. In one, we will use the GISS approach to combine these two stations-- this adds 1.5 degrees to GC and subtracts 1.5 degrees from Tucson. In the second, we will take an approach that applies all the adjustment to just the biases (Tucson station) -- this would add 0 degrees to GC and subtract 3 degrees from Tucson. The first approach, used by the GISS, results in a mean warming in these two stations that is 1.5 degrees higher than the more logical second approach. No wonder the GISS produces the highest historical global warming estimates of any source! Steve McIntyre has much more.
** I got to three degrees by applying all of the adjustments for GC and Tucson to Tucson. Here is another way to get to about this amount. We know from studies that urban heat islands can add 8-10 degrees to nighttime urban temperatures over surrounding undeveloped land. Assuming no daytime effect, which is conservative, we might conclude that 8-10 degrees at night adds about 3 degrees to the entire 24-hour average.
Postscript: Steve McIntyre comments (bold added):
These adjustments are supposed to adjust for station moves - the
procedure is described in Karl and Williams 1988 [check], but, like so
many climate recipes, is a complicated statistical procedure that is
not based on statistical procedures known off the island. (That's not
to say that the procedures are necessarily wrong, just that the
properties of the procedure are not known to statistical civilization.)
When I see this particular outcome of the Karl methodology, my
impression is that, net of the pea moving under the thimble, the Grand
Canyon values are being blended up and the Tucson values are being
blended down. So that while the methodology purports to adjust for
station moves, I'm not convinced that the methodology can successfully
estimate ex post the impact of numerous station moves and my guess is
that it ends up constructing a kind of blended average.
LOL. McIntyre, by the way, is the same gentleman who helped call foul on the Mann hockey stick for bad statistical procedure.

It seems to me that taking on the climate scientists is perfect opportunity for crowd sourcing. You documented the station in Tucson. What if we use a wiki like system to document all such stations, and even try to document when parking lots where built and so forth. I can well imagine the reason for the averaging across all stations is that if you only look at the temperature data it only makes sense if you average over a large area. The same way that if all stations were historically documented with coded data such averaging would clearly not make sense. No?
There is plenty of slop in the climate statistics. Plenty to be improved and revealed.
However, one should also be wary of those (many in the skeptic comnunity) who want to argue for impossible (especially for historical) levels of instrument precision. They use this as an excuse for doing nothing. For analyzing nothing.
Think of the thermometers and tree rings and the like as imperfect market research surveys. There are still valuable insights from them that can be and should be extracted.