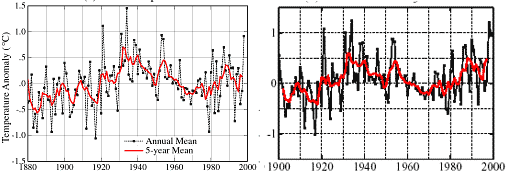
A Temperature Adjustment Example
I won't go back into all the details, but I have posted before about just how large the manual adjustments to temperature numbers are (the "noise") as compared to the magnitude of measured warming (the "signal"). This issue of manual temperature corrections is the real reason the NASA temperature restatements are important (not the absolute value of the restatement).
Here is a quick visual example. Both charts below are from James Hansen and the GISS and are for the US only. Both use basically the same temperature measurement network (the USHCN). The one on the left was Hansen's version of US temperatures in 1999. The one on the right he published in 2001.
The picture at the right is substantially different than the one on the left. Just look at 1932 and 1998. Between the first and second chart, none of the underlying temperature measurements changed. What changed were the adjustments to the underlying measurements applied by the NOAA and by the GISS. For some reason, temperatures after 1980 have been raised and temperatures in the middle of the century were lowered.
For scientists to apply a negative temperature adjustment to measurements, as they did for the early 1930's, it means they think there was some warming bias in 1932 that does not exist today. When scientists raise current temperatures, they are saying there is some kind of cooling bias that exists today that did not exist in the 1930's. Both of these adjustments are basically implying the same thing: That temperature measurement was more biased upwards, say by asphalt and urbanization and poor sitings, in 1932 than they are today. Does this make any freaking sense at all?
Of course, there may be some other bias at work here that I don't know about. But I and everyone else in the world are forced to guess because the NOAA and the GISS insist on keeping their adjustment software and details a secret, and continue to resist outside review.
Concerns about the direction and magnitude of adjustment are reasonable. However, Hansen has at least posited reasons for the adjustments in 2001 article. It is not quite so nessessary to speculate on causes of adjustment or quite as mysterious as the lack of the algorithm would indicate. Note, I think the full algorithm should come forwzard. Also that there may be much that is wrong or not even adequately revealed within the 2001 paper. However, a more meaningful discussion would use that as the basis of discussion (at least). As it is, from your post, one gets the impression that you have not really read that paper (even to the extent of making a good criticism of it).
I wanted to thank you for your posts on global warming -- they have been very informative. I also wanted to get your thoughts on the related subject of ozone depletion. I have seen some arguments that the ozone depletion theory has not matched up with subsequent observations concerning the annually generated Antarctic ozone hole. My questions in this regard are as follows:
1. Is it true that we didn't start gathering accurate measurements of the Antarctic ozone hole until 1978 when the Total Ozone Mapping Spectrometer (TOMS) was launched into space?
2. If this is true, how do scientists know that the annual ozone hole is not a natural phenomenon?
3. Is it true that CFCs in the atmosphere reached their peak in 2000?
4. If this is true, how do scientists explain the fact that we have continued to have large ozone holes above the Antarctic since 2000, with the ozones holes in 2003, 2005 and 2006 being considered record-sized holes?
5. I have read that the ozone hole in 2006 (which apparently was the largest ever recorded ozone hole) does not contradict the ozone depletion theory because the atmosphere above the Antarctic during that year was exceedingly cold. The premise for this argument being that a cold atmosphere leads to less ozone. But I have also read the exact opposite -- namely that a cold atmosphere is a consequence of ozone-depletion. Either way, how does the record ozone hole in 2006 impact on the ozone depletion theory?
6. If cold weather leads to less ozone, is it possible that the ozone holes we have been seeing since the 1970s are cold-related events rather than being man-made CFC-related events?
7. On the other hand, if cold weather is a product of less ozone, how come we keep seeing record-sized ozone holes well after atmospheric CFCs peaked in 2000?