Supply and Demand, But Not In Water
Thanks to a reader comes this article from the NY Times that yet again discusses a water shortage and possible government action without once mentioning the word "price." If water prices floated like gas prices, we wouldn't have to discuss things like these:
Within two weeks, Carol Couch, director of the Georgia Environmental
Protection Division, is expected to send Gov. Sonny Perdue
recommendations on tightening water restrictions, which may include
mandatory cutbacks on commercial and industrial users.If that
happens, experts at the National Drought Mitigation Center said, it
would be the first time a major metropolitan area in the United States
had been forced to take such drastic action to save its water supply.
But of course politicians love being responsible for resource allocation through command-and-control government, because it creates winners and losers and both will then donate to the next election cycle. Atlanta already has fairly expensive water, but a quick 50% rate hike about 3 months ago would have likely obviated this shortage while also providing the municipality with additional funds to develop new sources.
I wrote a lot more about water scarcity and the price mechanism, including the observation that Phoenix ridiculously has some of the lowest water prices in the country, here.
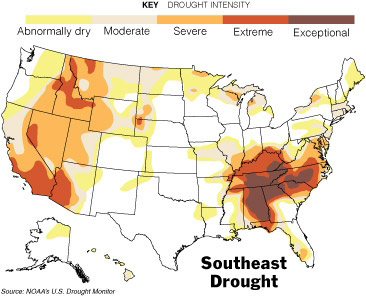
postscript: One of the media tricks to make things look worse and panicky is to present asymmetric charts. For example, the NY Times presents this drought map:
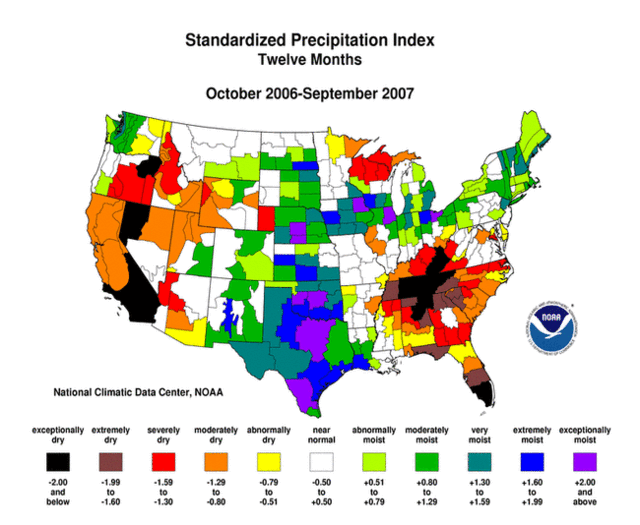
All you see is what one presumes to be normal in white and then a lot of drought. But in fact, this chart is truncated. It omits all the data for areas that are wetter than usual. Here is the chart for September form the NOAA with both over and under precipitation over the past 12 months:
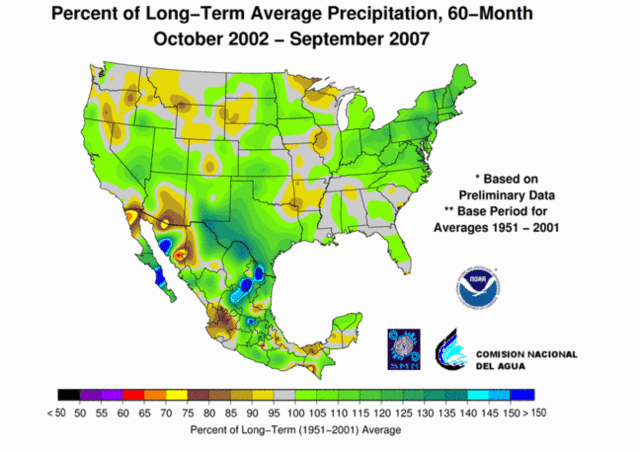
Whoa, that shows a different picture, huh? Basically, about as much stuff is wetter than normal as drier than normal. Which is exactly what one might expect in any period. And by the way, if you look at the last five years, the US is pretty freaking wet:


That second map is very oddly organized. The north Oregon coast got a crap-ton of rain in the last year, but it's lumped with the south Oregon coast, so all white.
Oh, and I bet the dark patches in the southeast wouldn't be quite so dark if Global Warming had actually bothered producing any of those hurricanes everyone predicted for the last two seasons...
Văn phòng Q.1 HCM từ 50 USD/tháng !

* Chỉ cần từ 50 - 120 USD/tháng, Công ty của bạn đã có thể sở hữu 1 văn phòng là m việc chuyên nghiệp tại Building 19 tầng ngay trung tâm quáºn 1 Tp.HCM.
* Thủ tục đăng ký Ä‘Æ¡n giản, háºu mãi chu đáo; có chiết khấu cho ngÆ°á»i giá»›i thiệu (Hấp dẫn!).
* Vui lòng xem chi tiết tại: Van phong cho thue gia re Q.1 HCM - Virtual office Vietnam
http://www.goffice.com.vn - http://www.goffice.vn
hoặc gá»i: 08.2200911
I live in North Carolina, and while it is dryer than normal, normal here is four times what I am used to from California. So it is still pretty wet.
I live in Georgia. This recent development in new Government-restrictions is absolutely outrageous! Though our state is filled with social Conservatives who want to use the power of Government to legislate morality, those same Conservatives also have some Libertarian leanings when it comes to the size and scope of our Government. There are a lot of people here who are outraged that the Government, the entity that can't do much of anything better than the private sector, can impose new restrictive laws instead of moving toward a free-market solution.
I live in Georgia. This recent development in new Government-restrictions is absolutely outrageous! Though our state is filled with social Conservatives who want to use the power of Government to legislate morality, those same Conservatives also have some Libertarian leanings when it comes to the size and scope of our Government. There are a lot of people here who are outraged that the Government, the entity that can't do much of anything better than the private sector, can impose new restrictive laws instead of moving toward a free-market solution.
The New York Times map is more than sufficient to illustrate the problem which is the lack of rain in the watershed. That it has rained elsewhere matters not to Atlanta.
You might also be interested to know that the Army Corps of Engineers is intentionally draining our much-needed water out of Lake Lanier. They are expected to drain 37,400 gallons of water from the lake. "Why" you ask? Well, this water is being diverted to Florida to save a group of fresh-water mussels. Apparently, these mussels are "endangered" and the Endangered Species Act requires us to go to any and all lengths to save them, even if it means that Humans suffer as a result.
Nice, huh?
I address the map choice at Gristmill here.
After a little research here: http://nadss.unl.edu/PDSIReport/pdsi/index.html, it seems that the methodology used is subject to considerable interpretation, and depends on parameters derived from extremely limited data sets. Sound familiar?
Also, even in the NOAA maps, there seems to be anomolies in the way the measured values gradiate into each other. It seems unusual that areas of severe drought should be immediatley adjacent to areas that are listed as abnormally wet (see Southern Oregon, Northwestern Wisconsin, and a huge discontiuity across the Ohio River). This is indicative to me that at least part of the differences in regions is likely due to differences in how the value is calculated, rather than actual differences in surface conditions. The other possibility is that the resolution of the measurements in insufficient to demonstrate the phenomenon they are trying to observe.
One thing that the map does not mean, although it appears to show, is that it has been as dry in eastern Tennesee as it has been in Southern California. The values are calibrated on a rough percentage departure form normal basis, meaning that an area with a relatively constant rainfall will show a much greater effect from an area with widely variable rainfall.
@ bahser20,
Indeed.
Here in North Alabama, the average rainfall is between 50 and 55 inches per year, and the average is 60 to 65 inches on the Gulf Coast. Average rainfall here is about 5 inches per month from November tthrough May, about 4 inches from June through September, and about 3.5 inches in October. For the last several years, the normal rainy season has seen roughly half the average amount (that is, 15 inches vs the usual 30 or so). The drier than average summer here contributed to the hot August here (July is typically the hottest month). I believe that the YTD temperatures here are below the 30 year "normal" that get quoted in the drive-by media.
Atlanta, which has grown from under 1 million people to over 5 million people in the SMSA in my lifetime, sucks so much water out of the Coosa/Tallapoosa systems now that Alabama is getting shorted. I need to see if Lake Lanier is a part of the Coosa/Tallapoosa/Alabama river system or the Chattahoochie system.
Hey, the mussels were there before you were, and they're probably just as evolved , too (and/or intelligently created), give 'em a break. And regarding 'free market solutions': there's no such thing. It was the 'free market' carpet baggers who over-developed Atlanta in the first place. The free market will take its course with Atlanta: first the boom, now the bust.