I am not going to say I told you so on Iran (in the first days of the conflict here and here} because there is not much reason anyone would trust me on foreign policy. Nobody should necessarily listen to me but everyone should listen to history. History is a laboratory where we can test our social-political theories and plans and see if they make sense. And the judgement of the last 100 years is pretty unequivocal:
Countries don't surrender under the onslaught of air power alone. Ever. If anything relentless bombing tends to heal fractures in the population as people band together against the common threat. As I wrote here
All this of course is to reiterate my skepticism that bombing the sh*t out of Iran is going to lead to any sort of surrender or favorable regime change. I see of late that Trump supporters have adopted the defense that their purpose in Iran is to degrade Iran's military ability and ability to support terrorism and conflicts in the region. But that sure as hell was not the Administration's public line at the beginning of the war. My recollection was that Trump's reasoning was we were going to decapitate the leadership and the people would rise up in revolution
The US has a terrible record of regime change through leadership decapitation and we almost always end up with something worse, at least without the application of a lot of ground troops. Iraq is perhaps better off post-Hussein and Panama is almost certainly better off post-Noriega, but those changes involved a lot of boots on the ground. Venezuela may turn out to be an exception as well but way too early to tell.
Certainly Iran's military has been degraded (though so has ours) but I wonder if the loss of $100 million fighter planes isn't the equivalent of losing the battleships at Pearl Harbor, ie the loss of a very-soon-to-be obsolete military equipment. In the world of drones on what increasingly looks like the nature of the modern battlefield, the loss of the old stuff may just accelerate their switch to the new war technologies (a switch I am not at all sure our military in the US is on top of).
Seeing little hope of victory, I have been hoping that Trump would declare victory and Iran and go home, which he has sort of done. Kudos at least for this, if only the US had done the same in Vietnam in 1965. However, the peace agreement (MOU? Docusign?) appears incredibly cynical. As I understand it, there is an armistice of sorts that lasts until 2 days after the US elections in November. It is clear that whatever JD Vance is spinning, the US got about zero (and maybe less than zero) from this agreement EXCEPT for the Administration's ability to maybe get the war and gas prices out of the paper until after the election.
I am not going to get into some of these more recent twists and turns, but I do want to shatter the mythos that the word "non-profit" is somehow equivalent to "charitable" or "well-intentioned". I know of many non-profits that do good work and for whom we should be grateful, but many many more do very little that is positive and are able to draft off the reputations of the ones who do. I want to describe what I call the original non-profit abuse, one that goes back to the very beginnings of the income tax system. I went to a private school in the 70's and an Ivy League University in the 80's and have seen what I am about to describe many times with my own eyes.
Let's say mom and dad have a business that they are going to be able to sell for $100 million. They have three classic failure to launch kids with expensive degrees in things like art history and anthropology that are not very marketable. All three from time to time have been employed in various roles (some real, some made up) in the family business. Over the years mom and dad have created a non-profit and donated half the equity of the family business. Once the business sells there is now a non-profit they control with $50 million in cash.
OK, so they rename the non-profit the "Smith Family Foundation for Art and Architecture Preservation". That sounds laudable, right? They get a lot of prestige from friends and the press for donating $50 million to "charity."
Making some perhaps over-optimistic assumptions about investment returns, let's assume that this new Foundation invests its $50 million (which they now call their endowment) and gets $4 million a year in income. Here is how this money might get spent:
We need managers of the Foundation -- hey, let's hire the kids. We will pay them each an executive salary of $750,000 a year
We probably need someone who can do actual work, so we will hire an office manager for $60,000 a year
We need an office, something whose prestige matches that of our new Foundation. We rent 5,000 square feet at $30 per square foot for $150,000 a year.
We will need supplies, utilities, etc. Throw in $50,000 a year
We need at least two board meeting a year with mom and dad and the executive team. No reason that this can't be at a nice resort with a spa. Call it $150,000 a year.
The executives need to visit sites with art or architecture preservation needs. Where is that? It could be anywhere, from Florence to Siam Reap. Eight trips per year at perhaps $50,000 each is $400,000 a year.
We will need a PR agency to make sure the world knows the good works we are doing, call it $100,000 a year
We will need to do various tax and legal filings, perhaps $40,000
That leaves $800,000 we can actually donate to other agencies or projects that support our mission. Good for us! Make sure the PR agent gets all the details, because after all this is a charity.
I will assure you that, though the IRS scrutinizes some of this stuff more, this is an entirely representative example. I went to school with kids who have exactly these sort of lives as executives of the family foundation.
Since its origin, this model was expanded and the primary seed of these new non-profits is not generational wealth but money from the government. When I worked more closely with the government running recreation areas, I was frequently frustrated that government employees almost fetishized non-profits, preferring if possible to allocate all outside contracts and partnerships to them if it was at all possible. I am not an expert on the history of this mythology, but I can assure you it exists -- whether Federal, state or local, government agencies almost always believe that non-profits are the best partners as they are safe from the taint of profit motive and thus pure in their intentions.
Sometimes that was true. I remember the government awarding a few campground management contracts to non-profits staffed with volunteers. The problem was -- and I think anyone who has been part of a non-profit can attest to this -- that as the initial passion fades, it is really hard for such volunteer organizations to provide services 24-7-365. Most all of these failed.
But then a more clever actor entered the picture in my little business niche. These were folks who wanted an edge winning contracts, so they built what would in every other respect just have been a business like mine but organized it as a non-profit. They then won contracts from agencies that were far more comfortable working with a "non-profit" than with a for-profit like my company. I remember objecting to the agency and saying that the president of that non-profit paid himself more than I made a year in profit, but I got nowhere. The perceived superiority of non-profits was an idee fixe in the government's mind that I could not overcome.
All of this came back to me as the DOGE effort dug out questionable non-profits on the government take and even more so as frauds in many states like MN and CA have demonstrated that the halo effect around non-profits still exists in government, and can be powerful enough to hide fraud and political money laundering.
Note: I am still much weaker than I expected following a post-operative infection, subsequent surgery to clean it out, and weeks of having my body host microbiological warfare on a grand scale. So I am trying to catch up on a few easy subjects I have intended to write about for a while.
While I am not deeply worried about man-made climate change, I am appalled at all the absolutely stupid, counter-productive things the government has implemented in the name of climate change, all of which have costly distorting effects on the economy while doing extremely little to affect man-made greenhouse gas production. For example:
Corn ethanol mandates and subsidies, which study after study have shown to have zero net effect on CO2 emissions, and which likely still exist only because the first Presidential primary is in Iowa. Even Koch Industries, who is one of the largest beneficiaries of this corporate welfare, has called for their abolition
Bad government technology bets like the massive public subsidies of failed Solyndra
Even when government programs do likely have an impact of CO2, they are seldom managed intelligently. For example, the government subsidizes solar panel installations, presumably to reduce their cost to consumers, but then imposes duties on imported panels to raise their price (indicating that the program has become more of a crony subsidy for US solar panel makers, which is typical of these types of government interventions). Obama's coal power plan, also known as his war on coal, will certainly reduce some CO2 from electricity generation but at a very high cost to consumers and industries. Steps like this are taken without any idea of whether this is the lowest cost approach to reducing CO2 production -- likely it is not given the arbitrary aspects of the program.
These policy mess is also an opportunity -- it affords us the ability to substantially reduce CO2 production at almost no cost.
The Plan
Point 1: Impose a Federal carbon tax on fuel.
I am open to a range of actual tax amounts, as long as point #2 below is also part of the plan. Something that prices CO2 between $25 and $45 a ton seems to match the mainstream estimates of the social costs of CO2. I think methane's greenhouse effects are exaggerated, but one could make an adjustment to the natural gas tax numbers to take into account methane leakage in the production chain. I am even open to making the tax=0 on biofuels given these fuels are recycling carbon from the atmosphere.
So what is the best way to reduce CO2 -- by substituting gas for coal? By more conservation? By solar, or wind? With biofuels? With a carbon tax, we don't have to figure it out or have politicians picking winners. This is why a Pigovian tax on carbon in fuels is going to be the most efficient possible way to reduce CO2 production. Different approaches will be tested in the marketplace. Cap and trade could theoretically do the same thing, but while this worked well in some niche markets (like SO2 emissions), it has not worked at all in European markets for CO2. There has just been too many opportunities for cronyism, too much weird accounting for things like offsets that is hard to do well, and too much temptation to pick winners and losers.
When I first crafted early drafts of this plan several years ago, I had assumed that Progressives championed a carbon tax for the reasons I listed above, ie that it is the most efficient means to allow markets to reduce emissions. However, the referendum a couple of years ago in Washington State demonstrated that many Progressives may not understand this at all. You can read a lot more about this debate here. I fail the ideological Turing test on this one, because I don't know if the Progressives who were strongly for CO2 reduction but opposed the Washington State carbon tax did so because they did not understand economics or because they cared less about global warming than funding other Progressive causes.
Point 2: Offset 100% of carbon tax proceeds against the payroll tax
Yes, there are likely many politicians, given their incentives, that would love a big new pool of money they could use to send largess, from more health care spending to more aircraft carriers, to their favored constituent groups. But we simply are not going to get Conservatives (and libertarians) on board for a net tax increase, particularly one to address an issue folks on the Right may not agree is an issue at all. So our plan will use carbon tax revenues to reduce other Federal taxes.
I think the best choice would be to reduce the payroll tax. Why? Because, the carbon tax will necessarily be regressive (as are most consumption taxes) and the most regressive other major Federal tax we have are payroll taxes. Offsetting income taxes would likely be a non-starter on the Left, as no matter how one structures the tax reduction the rich would get most of it since they pay most of the income taxes.
There is another benefit of reducing the payroll tax -- it would mean that we are replacing a consumption tax on labor with a consumption tax on fuel. It is always dangerous to make gut-feel assessments of complex systems like the economy, but my sense is that this swap might even have net benefits for the economy -- so much so that we might want to do it even if there was no such thing as greenhouse gas warming. In theory, labor and fuel are economically equivalent in that they are both production raw materials. But in practice, they are treated entirely differently by the public. Few people care about the full productive employment of our underground fuel reserves, but nearly everybody cares about the full productive employment of our labor force. After all, for most people, the primary single metric of economic health is the unemployment rate. So replacing a disincentive to hire with a disincentive to use fuel could well be popular.
Point 3: Eliminate all the stupid stuff
Oddly enough, this might be the hardest part politically because every subsidy, no matter how idiotic, has a hard core of beneficiaries who will defend it to the death -- this the the concentrated benefits, dispersed cost phenomena that makes it hard to change many government programs. But never-the-less I propose that we eliminate all the current Federal subsidies, mandates, and prohibitions that have been justified by climate change. Ethanol rules and mandates, solar subsidies, wind subsidies, EV subsidies, targeted technology investments, coal plant bans, pipeline bans, drilling bans -- it all should go. The carbon tax does the work.
States can continue to do whatever they want -- we don't need the Feds to step on states any more than they do already, and I continue to like the 50 state laboratory concept. If California wants to continue to subsidize wind generators, let them do it. That is between the state and its taxpayers (and for those who think the California legislature is crazy or that the Texas legislature is in thrall to oil companies, that is what U-Haul is for).
Point 4: Revamp our nuclear regulatory regime
As much as alternative energy enthusiasts would like to deny it, the world needs reliable, 24-hour baseload power -- and wind and solar are not going to do it (without a change in storage technology of at least 2 orders of magnitude in cost). The only carbon-free baseload power technology that is currently viable is nuclear.
I will observe that nuclear power suffers under some of the same problems as commercial space flight -- the government helped force the technology faster than it might have grown organically on its own, which paradoxically has slowed its long-term development. Early nuclear power probably was not ready for prime time, and the hangover from problems and perceptions of this era have made it hard to proceed even when better technologies now exist. We are at least 2 generations of technology past what is in most US nuclear plants. Small air-cooled thorium reactors and other technologies exist that could provide reliable safe power for over 100 years. I am not an expert on nuclear regulation, but it strikes me that a regime similar to aircraft safety, where a few designs are approved and used over and over makes sense. France, which has the strongest nuclear base in the world, followed this strategy. Using thorium could also have the advantage of making the technology more exportable, since its utility in weapons production would be limited.
Point 5: Help clean up Chinese, and Asian, coal production
One of the hard parts about fighting CO2 emissions, vs. all the other emissions we have tackled in the past (NOx, SOx, soot/particulates, unburned hydrocarbons, etc), is that we simply don't know how to combust fossil fuels without creating CO2 -- CO2 is inherent to the base chemical reaction of the combustion. But we do know how to burn coal without tons of particulates and smog and acid rain -- and we know how to do it economically enough to support a growing, prosperous modern economy.
In my mind it is utterly pointless to ask China to limit their CO2 growth. China has seen the miracle over the last 30 years of having almost a billion people exit poverty. This is an event unprecedented in human history, and they have achieved it in part by burning every molecule of fossil fuels they can get their hands on, and they are unlikely to accept limitations on fossil fuel consumption that will derail this economic progress. But I think it is reasonable to help China stop making their air unbreathable, a goal that is entirely compatible with continued economic growth. In 20 years, when we have figured out and started to build some modern nuclear designs, I am sure the Chinese will be happy to copy these and start working on their CO2 output, but for now their Maslov hierarchy of needs should point more towards breathable air.
As a bonus, this would pay one immediate climate change benefit that likely would dwarf the near-term effect of CO2 reduction. Right now, much of this soot from Asian coal plants lands on the ice in the Arctic and Greenland. This black carbon changes the albedo of the ice, causing it to reflect less sunlight and absorb more heat. The net effect is more melting ice and higher Arctic temperatures. A lot of folks, including myself, think that the recent melting of Arctic sea ice and rising Arctic temperatures is more attributable to Asian black carbon pollution than to CO2 and greenhouse gas warming (particularly since similar warming and sea ice melting is not seen in the Antarctic, where there is not a problem with soot pollution).
Final Thoughts
At its core, this is a very low cost, even negative cost, climate insurance policy. I am convinced this policy, taken as a whole, would still make sense even if CO2 turns out to be as harmless as nitrogen. The carbon tax combined with a market economy does the work of identifying the most efficient ways to reduce CO2 production. The economy benefits from the removal of a myriad of distortions and crony give-aways, while also potentially benefiting from the replacement of a consumption tax on labor with a consumption tax on fuel. The near-term effect on CO2 is small (since the US is only a small part of the global emissions picture), but actually larger than the near-term effect of all the haphazard current programs, and almost certainly cheaper to obtain. As an added benefit, if you can help China with its soot problem, we could see immediate improvements in probably the most visible front of man-made climate change: in the Arctic.
Postscript
Perhaps the hardest thing to overcome in reaching a compromise here is the tribalism of modern politics. I believe this is a perfectly sensible plan that even those folks who believe man-made global warming is a total myth ( a group to which I do not belong) could sign up for. The barrier, though, is tribal. I consider myself to be pretty free of team politics but my first reaction when thinking about this kind of plan was, "What? We can't let those guys win. They are totally full of sh*t. In the past they have even threatened to throw me in jail for my opinions." Since I first published this plan I have had very prominent skeptics contact me to criticize me for "giving in to the warmists."
Most folks even slightly acquainted with the climate debate have seen Dr. Mann's hockey stick. It is a historical temperature reconstruction using proxies such as the width of tree rings.
There were a zillion problems with this analysis, which I and many covered years ago and, frankly, I am past my tolerance in reiterating once again. Just to name three:
The inflection of the hockey stick occurs right where two completely different data sets - proxies and actual thermometer readings -- have been grafted together, leading one to wonder if the inflection is a real natural phenomenon or instead related to differences in how the data was gathered
The blue line, of the proxy data, ends in 1950. The reason for that is that the proxy data actually shows temperatures falling since 1950. This does not mean that temperatures actually fell - we are sure they have risen -- it means that the proxies are not very good proxies. If they are not following temperatures well in the last 50 years, why do we think they mirrored temperatures well in the 1000 years before that?
As Steve McIntyre showed, while Mann used many proxies, his statistical method basically over-weighted a single data set from bristlecone pines in California and used techniques that were shown later to generate hockey sticks even from random noise.
Anyway, you can search Google and spend most of the day reading critiques and defenses of Mann.
But I think a lot of laymen missed the point of the analysis. Folks want to say that the hockey stick proves we have a big current spike in temperatures -- ie they focus on the blade of the hockey stick. But we already knew from surface temperature records that world temperatures have risen perhaps 0.8C over the last century. And besides, as mentioned above, Mann's proxy data does not even confirm or support the current working.
No, the "insight" of the hockey stick analysis was the handle -- the fact that until 1900, Mann was essentially claiming that temperatures had been 1) dead flat with limited variation and 2) consistently well below current temperatures. Prior to Mann's analysis, most scientists had a picture of past climate that had a warm period from 1000-1300 that was perhaps as warm as it is today followed by a cold period (called the medieval warm period and the little ice age). Most of this was based on historical analysis. Go to your local university and find a medieval historian. Going forward, universities will probably not teach any European history any more, but you probably can find a few old folks still hanging on via tenure. I took an audio course from Philip Daileader of William and Mary and he started his course on the high middle ages (1000-1300) by saying the most important fact of that period was the demographic expansion allowed in part by a warm and favorable climate. The warm climate allowed more food production as new areas, particularly in the north, could be brought into production. In turn, after 1300, Europe was met with a cooler and wetter climate that created a horrible famine in the 1320's, which in turn likely weakened the population and made the black death a few decades later all the worse. Later on, we have records of canals and rivers freezing across Europe that almost never freeze today. This colder period lasted until the early 19th century (I use 1812 as a break as I think of the freezing Russian winter of that year that sent Napoleon home without most of his army). Temperatures and sea levels began rising after that, long before man was burning fossil fuels in earnest.
This historical picture, shared by pretty much everyone until 20 years ago, was overturned by Mann. Look at his chart - no warm period in the middle ages, and no substantially colder period just afterwards. How did he refute the historical evidence, which is robust? He waved this evidence off as limited to Western Europe. Which was sort of funny, because most of his proxy data came from an even smaller area, the mountains east of Bishop, CA**.
So all this is a leadup to a new study out of China looking at temperature proxies for China. And it turns out China, which is on the other side of the world from the west (I know that because when Bugs Bunny digs straight down he always comes out in China), has pretty much the same temperature history everyone before Michael Mann thought we had in Europe.
**postscript: If you have a sports car, and want to drive a curving mountain road that does not have a lot of big cliffs and has pretty much zero other cars to get in the way, you might try Highway 168 from near Bishop up towards the ancient bristlecone pine forest.
For many of you, this will be a blinding glimpse of the obvious, but I see so many dumb approaches to cooling cocktails being pushed that I had to try to clear a few things up.
First, a bit of physics. Ice cubes cool your drink in two ways. First and perhaps most obviously, the ice is colder than your drink. Put any object that is 32 degrees in a liquid that is 72 degrees and the warmer liquid will transfer heat to the cooler object. The object you dropped in will warm and the liquid will cool and their temperatures will tend to equilibrate. The exact amount that the liquid will cool depends on their relative masses, the heat carrying capacity of each material, and the difference in their temperatures.
However, for all but the most unusual substances, this cooling effect will be minor in comparison with the second effect, the phase change of the ice. Phase changes in water consume and liberate a lot of heat. I probably could look up the exact amounts, but the heat absorbed by water going from 32 degree ice to 33 degree water is way more than the heat absorbed going from that now 33 degree water to room temperature.
Your drink needs to be constantly chilled, even if it starts cold, because most glasses are not very good insulators. Pick up the glass -- is the glass cold from the drink? If so, this means the glass is a bad insulator. If it were a good insulator, the glass would be room temperature on the outside even if the drink were cold. The glass will absorb some heat from the air, but air is not really a great conductor of heat unless it is moving. But when you hold the glass in your hand, you are making a really good contact between your drink and an organic body that is essentially circulating near-100 degree fluid around it. Your body is pumping heat into your cocktail.
Given this, let's analyze two common approaches to supposedly cooling cocktails without excessive dilution:
Cold rocks. You put these things in the freezer and put them in your drink to keep it cold. Well, this certainly will not dilute the drink, but it also will not keep it very cold for long. Remember, the equilibration of temperatures between the drink and the object in it is not the main source of heat absorption, it is the phase change and the rocks are not going to change phase in your drink. Perhaps if you cooled the rocks in liquid nitrogen? I don't know.
Large round ice balls. There is nothing that is more attractive in my cocktail than a perfect round ice ball. A restaurant here in town called the Gladly has a way of making these beautiful round flaw-free ice balls that look like they are Steuben glass. The theory is that with a smaller surface to volume ratio, the ice ball will melt slower. Which is probably true, but all this means is that the heat transfer is slower and the cooling is less. But again, the physics should be roughly the same -- it is going to cool mostly in proportion to how much it melts. If it melts less, it cools less. I have a sneaking suspicion that bars have bought into this ice ball thing to mask tiny cocktails -- I have been to several bars which have come up with ice balls or cylinders that are maybe 1 mm smaller in diameter than the glass so that a large glass holds about an ounce of cocktail.
I will not claim to be an expert but I like my bourbon drinks cold and have adopted this strategy -- perhaps you have others.
Keep the bottles chilled. I keep Vodka in the freezer and bourbon and a few key mixers in the refrigerator. It is much easier to keep something cool than to cool it the first time, and this is a good dilution-free approach to the initial cooling. I don't know if this sort of storage is problematic for the liquor -- I have never found any issues.
Keep your drinking glass in the freezer. Again, it will warm in your hand but an initially warm glass is going to pump heat into whatever you pour into it.
Use a special glass. I have gone through two generations on this. My first generation was to use a double wall glass with an air gap. This works well and you can find many choices on Amazon. Then my wife found some small glasses at Tuesday Morning that were double wall but have water in the gap. You put them in the freezer and not only does the glass get cold but the water in the middle freezes. Now I can get some phase change cooling in my cocktail without dilution. You have to get used to holding a really cold glass but in Phoenix we have no complaints about such things.
Things I don't know but might work: I can imagine you could design encapsulated ice cubes, such as water in a glass sphere. Don't know if anyone makes these. There are similar products with gel in them that freezes, and double wall glasses with gel. I do not know if the phase change in the gel is better or worse for heat absorption than phase change of water. I have never found those cold packs made of gel as satisfactory as an ice pack, but that may be just a function of size. Anyone know?
Update: I believe this is what I have, though since we bought them at Tuesday Morning their provenance is hard to trace. They are small, but if you are sipping straight bourbon or scotch this is way more than enough.
Postscript: I was drinking old Fashions for a while but switched to a straight mix of Bourbon and Cointreau. Apparently there is no name for this cocktail that I can find, though its a bit like a Bourbon Sidecar without the lemon juice. For all your cocktails, I would seriously consider getting a jar of these, they are amazing. The Luxardo cherries are nothing like the crappy bright red maraschino cherries you see sold in grocery stores.
You are likely aware that the US, and many other countries, are spending billions and billions of dollars on climate research. After drug development, it probably has become the single most lucrative academic sector.
Let me ask a question. If you were concerned (as you should be) about lead in soil and drinking water and how it might or might not be getting into the bloodstream of children, what would you spend money on? Sure, better treatments and new technologies for filtering and cleaning up lead. But wouldn't the number one investment be in more and better measurement of environmental and human lead concentrations, and how they might be changing over time?
So I suppose if one were worried about the global rise in temperatures, one would look at better and more complete measurement of these temperatures. Hah! You would be wrong.
There are three main global temperature histories: the combined CRU-Hadley record (HADCRU), the NASA-GISS (GISTEMP) record, and the NOAA record. All three global averages depend on the same underlying land data archive, the Global Historical Climatology Network (GHCN). Because of this reliance on GHCN, its quality deficiencies will constrain the quality of all derived products.
The number of weather stations providing data to GHCN plunged in 1990 and again in 2005. The sample size has fallen by over 75% from its peak in the early 1970s, and is now smaller than at any time since 1919.
Well, perhaps they have focused on culling a large poor quality network into fewer, higher quality locations? If they have been doing this, there is little or no record of that being the case. To outsiders, it looks like stations just keep turning off. And in fact, by certain metrics, the quality of the network is falling:
The collapse in sample size has increased the relative fraction of data coming from airports to about 50 percent (up from about 30 percent in the 1970s). It has also reduced the average latitude of source data and removed relatively more high-altitude monitoring sites.
Airports, located in the middle of urban centers by and large, are terrible temperature measurement points, subject to a variety of biases such as the urban heat island effect. My son and I measured over 10 degrees Fahrenheit different between the Phoenix airport and the outlying countryside in an old school project. Folks who compile the measurements claim that they have corrected for these biases, but many of us have reasons to doubt that (consider this example, where an obviously biased station was still showing in the corrected data as the #1 warming site in the country). I understand why we have spent 30 years correcting screwed up biased stations because we need some stations with long histories and these are what we have (though many long lived stations have been allowed to expire), but why haven't we been building a new, better-sited network?
Ironically, there has been one major investment effort to improve temperature measurement, and that is through satellite measurements. We now use satellites for official measures of cloud cover, sea ice extent, and sea level, but the global warming establishment has largely ignored satellite measurement of temperatures. For example, James Hansen (Al Gore's mentor and often called the father of global warming) strongly defended 100+ year old surface temperature measurement technology over satellites. Ironically, Hansen was head, for years, of NASA's Goddard Institute of Space Studies (GISS), so one wonders why he resisted space technology in this one particular area. Cynics among us would argue that it is because satellites give the "wrong" answer, showing a slower warming rate than the heavily manually adjusted surface records.
There's no point trying to fight climate change - we'll all be dead in the next decade and there's nothing we can do to stop it, a visiting scientist claims.
Guy McPherson, a biology professor at the University of Arizona, says the human destruction of our own habitat is leading towards the world's sixth mass extinction.
Instead of fighting, he says we should just embrace it and live life while we can.
"It's locked down, it's been locked in for a long time - we're in the midst of our sixth mass extinction," he told Paul Henry on Thursday.
....
"I can't imagine there will be a human on the planet in 10 years," he says.
"We don't have 10 years. The problem is when I give a number like that, people think it's going to be business as usual until nine years [and] 364 days."
He says part of the reason he's given up while other scientists fight on is because they're looking at individual parts, such as methane emissions and the melting ice in the Arctic, instead of the entire picture.
"We're heading for a temperature within that span that is at or near the highest temperature experienced on Earth in the last 2 billion years."
Instead of trying to fix the climate, Prof McPherson says we should focus on living while we can.
"I think hope is a horrible idea. Hope is wishful thinking. Hope is a bad idea - let's abandon that and get on with reality instead. Let's get on with living instead of wishing for the future that never comes.
While I have shown over the previous chapters that there is good reason to be skeptical of a future man-made climate catastrophe (at least from CO2), I am appalled at all the absolutely stupid, counter-productive things the government has implemented in the name of climate change, all of which have costly distorting effects on the economy while doing extremely little to affect man-made greenhouse gas production. For example:
Corn ethanol mandates and subsidies, which study after study have shown to have zero net effect on CO2 emissions, and which likely still exist only because the first Presidential primary is in Iowa. Even Koch Industries, who is one of the largest beneficiaries of this corporate welfare, has called for their abolition
Bad government technology bets like the massive public subsidies of failed Solyndra
Even when government programs do likely have an impact of CO2, they are seldom managed intelligently. For example, the government subsidizes solar panel installations, presumably to reduce their cost to consumers, but then imposes duties on imported panels to raise their price (indicating that the program has become more of a crony subsidy for US solar panel makers, which is typical of the life-cycle of these types of government interventions). Obama's coal power plan, also known as his war on coal, will certainly reduce some CO2 from electricity generation but at a very high cost to consumers and industries. Steps like this are taken without any idea of whether this is the lowest cost approach to reducing CO2 production -- likely it is not given the arbitrary aspects of the program.
For years I have opposed steps like a Federal carbon tax or cap and trade system because I believe (and still believe) them to be unnecessary given the modest amount of man-made warming I expect over the next century. I would expect to see about one degree C of man-made warming between now and 2100, and believe most of the cries that "we are already seeing catastrophic climate changes" are in fact panics driven by normal natural variation (most supposed trends, say in hurricanes or tornadoes or heat waves, can't actually be found when one looks at the official data).
But I am exhausted with all the stupid, costly, crony legislation that passes in the name of climate change action. I am convinced there is a better approach that will have more impact on man-made CO2 and simultaneously will benefit the economy vs. our current starting point. So here goes:
The Plan
Point 1: Impose a Federal carbon tax on fuel.
I am open to a range of actual tax amounts, as long as point 2 below is also part of the plan. Something that prices CO2 between $25 and $45 a ton seems to match the mainstream estimates out there of the social costs of CO2. I think methane is a rounding error, but one could make an adjustment to the natural gas tax numbers to take into account methane leakage in the production chain. I am even open to make the tax=0 on biofuels given these fuels are recycling carbon from the atmosphere.
A Pigovian tax on carbon in fuels is going to be the most efficient possible way to reduce CO2 production. What is the best way to reduce CO2 -- by substituting gas for coal? by more conservation? by solar, or wind? with biofuels? With a carbon tax, we don't have to figure it out. Different approaches will be tested in the marketplace. Cap and trade could theoretically do the same thing, but while this worked well in some niche markets (like SO2 emissions), it has not worked at all in European markets for CO2. There has just been too many opportunities for cronyism, too much weird accounting for things like offsets that is hard to do well, and too much temptation to pick winners and losers.
Point 2: Offset 100% of carbon tax proceeds against the payroll tax
Yes, there are likely many politicians, given their incentives, that would love a big new pool of money they could use to send largess, from more health care spending to more aircraft carriers, to their favored constituent groups. But we simply are not going to get Conservatives (and libertarians) on board for a net tax increase, particularly one to address an issue they may not agree is an issue at all. So our plan will use carbon tax revenues to reduce other Federal taxes.
I think the best choice would be to reduce the payroll tax. Why? First, the carbon tax will necessarily be regressive (as are most consumption taxes) and the most regressive other major Federal tax we have are payroll taxes. Offsetting income taxes would likely be a non-starter on the Left, as no matter how one structures the tax reduction the rich would get most of it since they pay most of the income taxes.
There is another benefit of reducing the payroll tax -- it would mean that we are replacing a consumption tax on labor with a consumption tax on fuel. It is always dangerous to make gut-feel assessments of complex systems like the economy, but my sense is that this swap might even have net benefits for the economy -- ie we might want to do it even if there was no such thing as greenhouse gas warming. In theory, labor and fuel are economically equivalent in that they are both production raw materials. But in practice, they are treated entirely differently by the public. Few people care about the full productive employment of our underground fuel reserves, but nearly everybody cares about the full productive employment of our labor force. After all, for most people, the primary single metric of economic health is the unemployment rate. So replacing a disincentive to hire with a disincentive to use fuel could well be popular.
Point 3: Eliminate all the stupid stuff
Oddly enough, this might be the hardest part politically because every subsidy, no matter how idiotic, has a hard core of beneficiaries who will defend it to the death -- this the the concentrated benefits, dispersed cost phenomena that makes it hard to change many government programs. But never-the-less I propose that we eliminate all the current Federal subsidies, mandates, and prohibitions that have been justified by climate change. Ethanol rules and mandates, solar subsidies, wind subsidies, EV subsidies, targeted technology investments, coal plant bans, pipeline bans, drilling bans -- it all should go. The carbon tax does the work.
States can continue to do whatever they want -- we don't need the Feds to step on states any more than they do already, and I continue to like the 50 state laboratory concept. If California wants to continue to subsidize wind generators, let them do it. That is between the state and its taxpayers (and for those who think the California legislature is crazy, that is what U-Haul is for).
Point 4: Revamp our nuclear regulatory regime
As much as alternative energy enthusiasts would like to deny it, the world needs reliable, 24-hour baseload power -- and wind and solar are not going to do it (without a change in storage technology of at least 2 orders of magnitude in cost). The only carbon-free baseload power technology that is currently viable is nuclear.
I will observe that nuclear power suffers under some of the same problems as commercial space flight -- the government helped force the technology faster than it might have grown organically on its own, which paradoxically has slowed its long-term development. Early nuclear power probably was not ready for prime time, and the hangover from problems and perceptions of this era have made it hard to proceed even when better technologies have existed. But we are at least 2 generations of technology past what is in most US nuclear plants. Small air-cooled thorium reactors and other technologies exist that could provide reliable safe power for over 100 years. I am not an expert on nuclear regulation, but it strikes me that a regime similar to aircraft safety, where a few designs are approved and used over and over makes sense. France, which has the strongest nuclear base in the world, followed this strategy. Using thorium could also have the advantage of making the technology more exportable, since its utility in weapons production would be limited.
Point 5: Help clean up Chinese, and Asian, coal production
One of the hard parts about fighting CO2 emissions, vs. all the other emissions we have tackled in the past (NOx, SOx, soot/particulates, unburned hydrocarbons, etc), is that we simply don't know how to combust fossil fuels without creating CO2 -- CO2 is inherent to the base chemical reaction of the combustion. But we do know how to burn coal without tons of particulates and smog and acid rain -- and we know how to do it economically enough to support a growing, prosperous modern economy.
In my mind it is utterly pointless to ask China to limit their CO2 growth. China has seen the miracle over the last 30 years of having almost a billion people exit poverty. This is an event unprecedented in human history, and they have achieved it in part by burning every molecule of fossil fuels they can get their hands on, and they are unlikely to accept limitations on fossil fuel consumption that will derail this economic progress. But I think it is reasonable to help China stop making their air unbreathable, a goal that is entirely compatible with continued economic growth. In 20 years, when we have figured out and started to build some modern nuclear designs, I am sure the Chinese will be happy to copy these and start working on their CO2 output, but for now their Maslov hierarchy of needs should point more towards breathable air.
As a bonus, this would pay one immediate climate change benefit that likely would dwarf the near-term effect of CO2 reduction. Right now, much of this soot from Asian coal plants lands on the ice in the Arctic and Greenland. This black carbon changes the albedo of the ice, causing it to reflect less sunlight and absorb more heat. The net effect is more melting ice and higher Arctic temperatures. A lot of folks, including myself, think that the recent melting of Arctic sea ice and rising Arctic temperatures is more attributable to Asian black carbon pollution than to CO2 and greenhouse gas warming (particularly since similar warming and sea ice melting is not seen in the Antarctic, where there is not a problem with soot pollution).
Final Thoughts
At its core, this is a very low cost, even negative cost, climate insurance policy. The carbon tax combined with a market economy does the work of identifying the most efficient ways to reduce CO2 production. The economy benefits from the removal of a myriad of distortions and crony give-aways, while also potentially benefiting from the replacement of a consumption tax on labor with a consumption tax on fuel. The near-term effect on CO2 is small (since the US is only a small part of the global emissions picture), but actually larger than the near-term effect of all the haphazard current programs, and almost certainly cheaper to obtain. As an added benefit, if you can help China with its soot problem, we could see immediate improvements in probably the most visible front of man-made climate change: in the Arctic.
For those who have hung with me this entire series, many thanks for your interest. If you have questions, concerns, or outraged refutations, you are welcome to email me at the link above.
Having established that the Earth has warmed over the past century or so (though with some dispute over how much), we turn to the more interesting -- and certainly more difficult -- question of finding causes for past warming. Specifically, for the global warming debate, we would like to know how much of the warming was due to natural variations and how much was man-made. Obviously this is hard to do, because no one has two thermometers that show the temperature with and without man's influence.
I like to begin each chapter with the IPCC's official position, but this is a bit hard in this case because they use a lot of soft words rather than exact numbers. They don't say 0.5 of the 0.8C is due to man, or anything so specific. They use phrases like "much of the warming" to describe man's affect. However, it is safe to say that most advocates of catastrophic man-made global warming theory will claim that most or all of the last century's warming is due to man, and that is how we have put it in our framework below:
By the way, the "and more" is not a typo -- there are a number of folks who will argue that the world would have actually cooled without manmade CO2 and thus manmade CO2 has contributed more than the total measured warming. This actually turns out to be an important argument, since the totality of past warming is not enough to be consistent with high sensitivity, high feedback warming forecasts. But we will return to this in part C of this chapter.
Past, Mostly Abandoned Arguments for Attribution to Man
There have been and still are many different approaches to the attributions problem. In a moment, we will discuss the current preferred approach. However, it is worth reviewing two other approaches that have mostly been abandoned but which had a lot of currency in the media for some time, in part because both were in Al Gore's film An Inconvenient Truth.
Before we get into them, I want to take a step back and briefly discuss what is called paleo-climatology, which is essentially the study of past climate before the time when we had measurement instruments and systematic record-keeping for weather. Because we don't have direct measurements, say, of the temperature in the year 1352, scientists must look for some alternate measure, called a "proxy," that might be correlated with a certain climate variable and thus useful in estimating past climate metrics. For example, one might look at the width of tree rings, and hypothesize that varying widths in different years might correlate to temperature or precipitation in those years. Most proxies take advantage of such annual layering, as we have in tree rings.
One such methodology uses ice cores. Ice in certain places like Antarctica and Greenland is laid down in annual layers. By taking a core sample, characteristics of the ice can be measured at different layers and matched to approximate years. CO2 concentrations can actually be measured in air bubbles in the ice, and atmospheric temperatures at the time the ice was laid down can be estimated from certain oxygen isotope ratios in the ice. The result is that one can plot a chart going back hundreds of thousands of years that estimates atmospheric CO2 and temperature. Al Gore showed this chart in his movie, in a really cool presentation where the chart wrapped around three screens:
As Gore points out, this looks to be a smoking gun for attribution of temperature changes to CO2. From this chart, temperature and CO2 concentrations appear to be moving in lockstep. From this, CO2 doesn't seem to be a driver of temperatures, it seems to be THE driver, which is why Gore often called it the global thermostat.
But there turned out to be a problem, which is why this analysis no longer is treated as a smoking gun, at least for the attribution issue. Over time, scientists got better at taking finer and finer cuts of the ice cores, and what they found is that when they looked on a tighter scale, the temperature was rising (in the black spikes of the chart) on average 800 years before the CO2 levels (in red) rose.
This obviously throws a monkey wrench in the causality argument. Rising CO2 can hardly be the cause of rising temperatures if the CO2 levels are rising after temperatures.
It is now mostly thought that what this chart represents is the liberation of dissolved CO2 from oceans as temperatures rise. Oceans have a lot of dissolved CO2, and as the oceans get hotter, they will give up some of this CO2 to the atmosphere.
The second outdated attribution analysis we will discuss is perhaps the most famous: The Hockey Stick. Based on a research paper by Michael Mann when he was still a grad student, it was made famous in Al Gore's movie as well as numerous other press articles. It became the poster child, for a few years, of the global warming movement.
So what is it? Like the ice core chart, it is a proxy analysis attempting to reconstruct temperature history, in this case over the last 1000 years or so. Mann originally used tree rings, though in later versions he has added other proxies, such as from organic matter laid down in sediment layers.
Before the Mann hockey stick, scientists (and the IPCC) believed the temperature history of the last 1000 years looked something like this:
Generally accepted history had a warm period from about 1100-1300 called the Medieval Warm Period which was warmer than it is today, with a cold period in the 17th and 18th centuries called the "Little Ice Age". Temperature increases since the little ice age could in part be thought of as a recovery from this colder period. Strong anecdotal evidence existed from European sources supporting the existence of both the Medieval Warm Period and the Little Ice Age. For example, I have taken several history courses on the high Middle Ages and every single professor has described the warm period from 1100-1300 as creating a demographic boom which defined the era (yes, warmth was a good thing back then). In fact, many will point to the famines in the early 14th century that resulted from the end of this warm period as having weakened the population and set the stage for the Black Death.
However, this sort of natural variation before the age where man burned substantial amounts of fossil fuels created something of a problem for catastrophic man-made global warming theory. How does one convince the population of catastrophe if current warming is within the limits of natural variation? Doesn't this push the default attribution of warming towards natural factors and away from man?
The answer came from Michael Mann (now Dr. Mann but actually produced originally before he finished grad school). It has been dubbed the hockey stick for its shape:
The reconstructed temperatures are shown in blue, and gone are the Medieval Warm Period and the Little Ice Age, which Mann argued were local to Europe and not global phenomena. The story that emerged from this chart is that before industrialization, global temperatures were virtually flat, oscillating within a very narrow band of a few tenths of a degree. However, since 1900, something entirely new seems to be happening, breaking the historical pattern. From this chart, it looks like modern man has perhaps changed the climate. This shape, with the long flat historical trend and the sharp uptick at the end, is why it gets the name "hockey stick."
Oceans of ink and electrons have been spilled over the last 10+ years around the hockey stick, including a myriad of published books. In general, except for a few hard core paleoclimatologists and perhaps Dr. Mann himself, most folks have moved on from the hockey stick as a useful argument in the attribution debate. After all, even if the chart is correct, it provides only indirect evidence of the effect of man-made CO2.
Here are a few of the critiques:
Note that the real visual impact of the hockey stick comes from the orange data on the far right -- the blue data alone doesn't form much of a hockey stick. But the orange data is from an entirely different source, in fact an entirely different measurement technology -- the blue data is from tree rings, and the orange is form thermometers. Dr. Mann bristles at the accusation that he "grafted" one data set onto the other, but by drawing the chart this way, that is exactly what he did, at least visually. Why does this matter? Well, we have to be very careful with inflections in data that occur exactly at the point that where we change measurement technologies -- we are left with the suspicion that the change in slope is due to differences in the measurement technology, rather than in the underlying phenomenon being measured.
In fact, well after this chart was published, we discovered that Mann and other like Keith Briffa actually truncated the tree ring temperature reconstructions (the blue line) early. Note that the blue data ends around 1950. Why? Well, it turns out that many tree ring reconstructions showed temperatures declining after 1950. Does this mean that thermometers were wrong? No, but it does provide good evidence that the trees are not accurately following current temperature increases, and so probably did not accurately portray temperatures in the past.
If one looks at the graphs of all of Mann's individual proxy series that are averaged into this chart, astonishingly few actually look like hockey sticks. So how do they average into one? McIntyre and McKitrick in 2005 showed that Mann used some highly unusual and unprecedented-to-all-but-himself statistical methods that could create hockey sticks out of thin air. The duo fed random data into Mann's algorithm and got hockey sticks.
At the end of the day, most of the hockey stick (again due to Mann's averaging methods) was due to samples from just a handful of bristle-cone pine trees in one spot in California, trees whose growth is likely driven by a number of non-temperature factors like precipitation levels and atmospheric CO2 fertilization. Without these few trees, most of the hockey stick disappears. In later years he added in non-tree-ring series, but the results still often relied on just a few series, including the Tiljander sediments where Mann essentially flipped the data upside down to get the results he wanted. Taking out the bristlecone pines and the abused Tiljander series made the hockey stick go away again.
There have been plenty of other efforts at proxy series that continue to show the Medieval Warm Period and Little Ice Age as we know them from the historical record
As an aside, Mann's hockey stick was always problematic for supporters of catastrophic man-made global warming theory for another reason. The hockey stick implies that the world's temperatures are, in absence of man, almost dead-flat stable. But this is hardly consistent with the basic hypothesis, discussed earlier, that the climate is dominated by strong positive feedbacks that take small temperature variations and multiply them many times. If Mann's hockey stick is correct, it could also be taken as evidence against high climate sensitivities that are demanded by the catastrophe theory.
The Current Lead Argument for Attribution of Past Warming to Man
So we are still left wondering, how do climate scientists attribute past warming to man? Well, to begin, in doing so they tend to focus on the period after 1940, when large-scale fossil fuel combustion really began in earnest. Temperatures have risen since 1940, but in fact nearly all of this rise occurred in the 20 year period from 1978 to 1998:
To be fair, and better understand the thinking at the time, let's put ourselves in the shoes of scientists around the turn of the century and throw out what we know happened after that date. Scientists then would have been looking at this picture:
Sitting in the year 2000, the recent warming rate might have looked dire .. nearly 2C per century...
Or possibly worse if we were on an accelerating course...
Scientists began to develop a hypothesis that this temperature rise was occurring too rapidly to be natural, that it had to be at least partially man-made. I have always thought this a slightly odd conclusion, since the slope from this 20-year period looks almost identical to the slope centered around the 1930's, which was very unlikely to have much human influence.
But never-the-less, the hypothesis that the 1978-1998 temperature rise was too fast to be natural gained great currency. But how does one prove it?
What scientists did was to build computer models to simulate the climate. They then ran the computer models twice. The first time they ran them with only natural factors, or at least only the natural factors they knew about or were able to model (they left a lot out, but we will get to that in time). These models were not able to produce the 1978-1998 warming rates. Then, they re-ran the models with manmade CO2, and particularly with a high climate sensitivity to CO2 based on the high feedback assumptions we discussed in an earlier chapter. With these models, they were able to recreate the 1978-1998 temperature rise. As Dr. Richard Lindzen of MIT described the process:
What was done, was to take a large number of models that could not reasonably simulate known patterns of natural behavior (such as ENSO, the Pacific Decadal Oscillation, the Atlantic Multidecadal Oscillation), claim that such models nonetheless accurately depicted natural internal climate variability, and use the fact that these models could not replicate the warming episode from the mid seventies through the mid nineties, to argue that forcing was necessary and that the forcing must have been due to man.
Another way to put this argument is "we can't think of anything natural that could be causing this warming, so by default it must be man-made. With various increases in sophistication, this remains the lead argument in favor of attribution of past warming to man.
In part B of this chapter, we will discuss what natural factors were left out of these models, and I will take my own shot at a simple attribution analysis.
While I am not deeply worried about man-made climate change, I am appalled at all the absolutely stupid, counter-productive things the government has implemented in the name of climate change, all of which have costly distorting effects on the economy while doing extremely little to affect man-made greenhouse gas production. For example:
Corn ethanol mandates and subsidies, which study after study have shown to have zero net effect on CO2 emissions, and which likely still exist only because the first Presidential primary is in Iowa. Even Koch Industries, who is one of the largest beneficiaries of this corporate welfare, has called for their abolition
Bad government technology bets like the massive public subsidies of failed Solyndra
Even when government programs do likely have an impact of CO2, they are seldom managed intelligently. For example, the government subsidizes solar panel installations, presumably to reduce their cost to consumers, but then imposes duties on imported panels to raise their price (indicating that the program has become more of a crony subsidy for US solar panel makers, which is typical of these types of government interventions). Obama's coal power plan, also known as his war on coal, will certainly reduce some CO2 from electricity generation but at a very high cost to consumers and industries. Steps like this are taken without any idea of whether this is the lowest cost approach to reducing CO2 production -- likely it is not given the arbitrary aspects of the program.
For years I have opposed steps like a Federal carbon tax or cap and trade system because I believe (and still believe) them to be unnecessary given the modest amount of man-made warming I expect over the next century. I would expect to see about one degree C of man-made warming between now and 2100, and believe most of the cries that "we are already seeing catastrophic climate changes" are in fact panics driven by normal natural variation (most supposed trends, say in hurricanes or tornadoes or heat waves, can't actually be found when one looks at the official data).
But I am exhausted with all the stupid, costly, crony legislation that passes in the name of climate change action. I am convinced there is a better approach that will have more impact on man-made CO2 and simultaneously will benefit the economy vs. our current starting point. So here goes:
The Plan
Point 1: Impose a Federal carbon tax on fuel.
I am open to a range of actual tax amounts, as long as point 2 below is also part of the plan. Something that prices CO2 between $25 and $45 a ton seems to match the mainstream estimates out there of the social costs of CO2. I think methane is a rounding error, but one could make an adjustment to the natural gas tax numbers to take into account methane leakage in the production chain. I am even open to make the tax=0 on biofuels given these fuels are recycling carbon from the atmosphere.
A Pigovian tax on carbon in fuels is going to be the most efficient possible way to reduce CO2 production. What is the best way to reduce CO2 -- by substituting gas for coal? by more conservation? by solar, or wind? with biofuels? With a carbon tax, we don't have to figure it out. Different approaches will be tested in the marketplace. Cap and trade could theoretically do the same thing, but while this worked well in some niche markets (like SO2 emissions), it has not worked at all in European markets for CO2. There has just been too many opportunities for cronyism, too much weird accounting for things like offsets that is hard to do well, and too much temptation to pick winners and losers.
Point 2: Offset 100% of carbon tax proceeds against the payroll tax
Yes, there are likely many politicians, given their incentives, that would love a big new pool of money they could use to send largess, from more health care spending to more aircraft carriers, to their favored constituent groups. But we simply are not going to get Conservatives (and libertarians) on board for a net tax increase, particularly one to address an issue they may not agree is an issue at all. So our plan will use carbon tax revenues to reduce other Federal taxes.
I think the best choice would be to reduce the payroll tax. Why? First, the carbon tax will necessarily be regressive (as are most consumption taxes) and the most regressive other major Federal tax we have are payroll taxes. Offsetting income taxes would likely be a non-starter on the Left, as no matter how one structures the tax reduction the rich would get most of it since they pay most of the income taxes.
There is another benefit of reducing the payroll tax -- it would mean that we are replacing a consumption tax on labor with a consumption tax on fuel. It is always dangerous to make gut-feel assessments of complex systems like the economy, but my sense is that this swap might even have net benefits for the economy -- ie we might want to do it even if there was no such thing as greenhouse gas warming. In theory, labor and fuel are economically equivalent in that they are both production raw materials. But in practice, they are treated entirely differently by the public. Few people care about the full productive employment of our underground fuel reserves, but nearly everybody cares about the full productive employment of our labor force. After all, for most people, the primary single metric of economic health is the unemployment rate. So replacing a disincentive to hire with a disincentive to use fuel could well be popular.
Point 3: Eliminate all the stupid stuff
Oddly enough, this might be the hardest part politically because every subsidy, no matter how idiotic, has a hard core of beneficiaries who will defend it to the death -- this the the concentrated benefits, dispersed cost phenomena that makes it hard to change many government programs. But never-the-less I propose that we eliminate all the current Federal subsidies, mandates, and prohibitions that have been justified by climate change. Ethanol rules and mandates, solar subsidies, wind subsidies, EV subsidies, targeted technology investments, coal plant bans, pipeline bans, drilling bans -- it all should go. The carbon tax does the work.
States can continue to do whatever they want -- we don't need the Feds to step on states any more than they do already, and I continue to like the 50 state laboratory concept. If California wants to continue to subsidize wind generators, let them do it. That is between the state and its taxpayers (and for those who think the California legislature is crazy, that is what U-Haul is for).
Point 4: Revamp our nuclear regulatory regime
As much as alternative energy enthusiasts would like to deny it, the world needs reliable, 24-hour baseload power -- and wind and solar are not going to do it (without a change in storage technology of at least 2 orders of magnitude in cost). The only carbon-free baseload power technology that is currently viable is nuclear.
I will observe that nuclear power suffers under some of the same problems as commercial space flight -- the government helped force the technology faster than it might have grown organically on its own, which paradoxically has slowed its long-term development. Early nuclear power probably was not ready for prime time, and the hangover from problems and perceptions of this era have made it hard to proceed even when better technologies have existed. But we are at least 2 generations of technology past what is in most US nuclear plants. Small air-cooled thorium reactors and other technologies exist that could provide reliable safe power for over 100 years. I am not an expert on nuclear regulation, but it strikes me that a regime similar to aircraft safety, where a few designs are approved and used over and over makes sense. France, which has the strongest nuclear base in the world, followed this strategy. Using thorium could also have the advantage of making the technology more exportable, since its utility in weapons production would be limited.
Point 5: Help clean up Chinese, and Asian, coal production
One of the hard parts about fighting CO2 emissions, vs. all the other emissions we have tackled in the past (NOx, SOx, soot/particulates, unburned hydrocarbons, etc), is that we simply don't know how to combust fossil fuels without creating CO2 -- CO2 is inherent to the base chemical reaction of the combustion. But we do know how to burn coal without tons of particulates and smog and acid rain -- and we know how to do it economically enough to support a growing, prosperous modern economy.
In my mind it is utterly pointless to ask China to limit their CO2 growth. China has seen the miracle over the last 30 years of having almost a billion people exit poverty. This is an event unprecedented in human history, and they have achieved it in part by burning every molecule of fossil fuels they can get their hands on, and they are unlikely to accept limitations on fossil fuel consumption that will derail this economic progress. But I think it is reasonable to help China stop making their air unbreathable, a goal that is entirely compatible with continued economic growth. In 20 years, when we have figured out and started to build some modern nuclear designs, I am sure the Chinese will be happy to copy these and start working on their CO2 output, but for now their Maslov hierarchy of needs should point more towards breathable air.
As a bonus, this would pay one immediate climate change benefit that likely would dwarf the near-term effect of CO2 reduction. Right now, much of this soot from Asian coal plants lands on the ice in the Arctic and Greenland. This black carbon changes the albedo of the ice, causing it to reflect less sunlight and absorb more heat. The net effect is more melting ice and higher Arctic temperatures. A lot of folks, including myself, think that the recent melting of Arctic sea ice and rising Arctic temperatures is more attributable to Asian black carbon pollution than to CO2 and greenhouse gas warming (particularly since similar warming and sea ice melting is not seen in the Antarctic, where there is not a problem with soot pollution).
Final Thoughts
At its core, this is a very low cost, even negative cost, climate insurance policy. The carbon tax combined with a market economy does the work of identifying the most efficient ways to reduce CO2 production. The economy benefits from the removal of a myriad of distortions and crony give-aways, while also potentially benefiting from the replacement of a consumption tax on labor with a consumption tax on fuel. The near-term effect on CO2 is small (since the US is only a small part of the global emissions picture), but actually larger than the near-term effect of all the haphazard current programs, and almost certainly cheaper to obtain. As an added benefit, if you can help China with its soot problem, we could see immediate improvements in probably the most visible front of man-made climate change: in the Arctic.
Postscript
Perhaps the hardest thing to overcome in reaching a compromise here is the tribalism of modern politics. I believe this is a perfectly sensible plan that even those folks who believe man-made global warming is a total myth ( a group to which I do not belong) could sign up for. The barrier, though, is tribal. I consider myself to be pretty free of team politics but my first reaction when thinking about this kind of plan was, "What? We can't let those guys win. They are totally full of sh*t. They are threatening to throw me in jail for my opinions."
It was at this point I was reminded of a customer service story at my company. I had a customer who was upset call me, and I ended up giving them a full-refund and a certificate to come back and visit us in the future. I actually suspected there was more to the story, but I didn't want a bad review. The customer was happy, but my local manager was not. She called me and said, "That was a bad customer! He was lying to you. How can you let him win like that?" Does this sound familiar? I think we fall into this trap all the time in modern politics, worried more about preventing the other team from winning than about doing the right thing.
My guess is that there are no new cocktails under the sun, but I have not found anything similar out there so here is my current favorite homegrown concoction. Call it a Coyote Cocktail if it has not been named yet. I suppose it is sort of kind of like a Sidecar but I actually started from an Old Fashioned to get here:
2 parts Bourbon (I think a slightly sweeter one like Makers Mark works well)
1 part Cointreau
1 part fresh grapefruit juice (we have a tree so this is easy)
a couple dashes of orange bitters
stir over ice.
A lot of restaurants in my area are serving slightly spicy tequila drinks, making Palomas or Spicy Margaritas with pepper-infused tequlia. We have home-infused a bottle of tequila with peppers and really like it. Our first try was a disaster -- we put 2 or 3 small dry peppers in bottle of tequila and let it sit for 5 days. Mistake! That is way too long. A day is all that is needed for a good infusion and a nice level of spice. We held onto the five-day flamethrower tequila. It is fun to serve as a shot to friends who think they are manly for pounding Jagermeister. Really gets their attention.
As an awful aside, apparently my son and his friends at college drink some concoction made of Jagermeister and Red Bull. I am told this is a standard at clubs nowadays. gahk. Possibly even worse than the Schmidt Beer I drank occasionally at college when we were short on cash.
Anyone want to explain this? It was sent in one of those emails that sort of go around.
Water straight from the tap becomes cloudy when frozen.
To make ice cubes crystal clear, allow a kettle of boiled water to cool slightly
and use this to fill your ice cube trays.
I know that crystal growth is path dependent. Is this just the water equivalent of annealing in metal and glass?
Update: Long-time reader Travis says that boiling the water drives all the trapped air out, making the cubes clear. Jeez, I so wanted this to be some wonky crystal formation answer
For the first time, a research team has been able to reconstruct the solar activity at the end of the last ice age, around 20 000–10 000 years ago, by analysing trace elements in ice cores in Greenland and cave formations from China. During the last glacial maximum, Sweden was covered in a thick ice sheet that stretched all the way down to northern Germany and sea levels were more than 100 metres lower than they are today, because the water was frozen in the extensive ice caps. The new study shows that the sun’s variation influences the climate in a similar way regardless of whether the climate is extreme, as during the Ice Age, or as it is today.
“The study shows an unexpected link between solar activity and climate change. It shows both that changes in solar activity are nothing new and that solar activity influences the climate, especially on a regional level. Understanding these processes helps us to better forecast the climate in certain regions”, said Raimund Muscheler, Lecturer in Quaternary Geology at Lund University and co-author of the study.
My snarky tone is a bit unfair here. While the sun seems an obvious candidate as a major climate driver, changes in its actual energy hitting the Earth have always appeared small compared to what would be needed to explain observed temperature changes. This team hypothesizes that the changes in the sun's output have effects on atmospheric circulation that have a larger than expected impact on temperatures. Henrik Svensmark explains it a different way, hypothesizing that cloud formation is heavily influenced by cosmic rays, and higher solar activity tends to shield the Earth from cosmic rays, thus reducing cloud formation and increasing temperatures.
Skeptics find this sudden realization that the sun affects climate to be kind of funny, since they have argued for years that higher temperatures in the late 20th century have coincided with a very active sun, probably more active than it has been in hundreds of years. Climate alarmists have denied any influence to the sun. Sun deniers! This absolutist stance may seem odd, given that most skeptics (despite what is said of us) actually accept some amount of warming from CO2, but here are these folks who wrap themselves in the mantle of science that deny any effect from the sun? The problem that warmists have is that higher climate sensitivities, on the order of 3 degrees C per doubling of CO2, greatly over-predict past warming (as I demonstrate in my videos, see around the 59 minute mark). If anything else whatsoever other than CO2 caused one iota of the warming over the last 50 years, then this over-prediction just gets worse. In fact, warmists have to assume crazy high levels of aerosol cooling -- that go beyond what most of the science supports -- to make their forecasts work looking backwards.
As a former hater, I have really enjoyed the World Cup this year. I think an unsung part of why so many people have been coming around in the States is having ESPN broadcast every game, instead of just seeing two or three here. Seeing all the games lets one start getting to know the players and the teams, develop favorites, etc.
However, like most Americans, I do find it, at best, humorous to watch folks act like they have been gut-shot every time someone brushes their jersey. I talked to a friend of mine who used to manage NHL teams, and said that it would be funny to do a parody with ice hockey players falling and writhing on the ground every time they were touched. There would be 10 guys laying on the ice in about 30 seconds.
Not quite the same idea, but I thought this parody was pretty funny
This is Snuggles, happy to be home finally from her surgeries and near life-ending coyote encounter. Thanks to everyone who sent in their best wishes.
Like most of us she is a bit vain so she asked for the head shot, since from the sides she is a total mess of randomly shaved patches, bite marks, and Frankenstein-like stitches. She has lost about 25% of her body mass, so she is no longer the World's Largest Maltese (TM). She has, though, upped the ante in the competition for World's Most Poorly Groomed Maltese (TM).
For dog and pet lovers, I don't have to explain why we spent thousands of dollars to keep her alive.
For those of you who are not (and I was really in that camp a few years ago as this is my first pet), I will tell you what I told a cynical friend: "I did not necessarily spend thousands of dollars to save the dog. I spent it to save my kids from heartbreak. And just possibly, to preserve my reputation in the eyes of my family (sorry kids, I really wanted that new Alienware laptop so Snuggs is not going to make it)."
Update: I find the rational choices discussion in the comments unsurprising given the diversity of responses I have had from friends. Key facts here: 1. I could afford it (grandma was not going to get put out on the ice flow to save the dog); 2. I was entirely responsible for the costs; 3. The hospital, unlike in the human world, gave me a very detailed cost estimate of what the procedure would cost in advance. When the costs went over, we challenged them and they agreed to a refund. 4. My daughter had a very difficult day yesterday. This morning I found her sleeping snuggled up with the dog in bed. Put a price on that.
My argument is that the smoothing and relatively low sampling intervals in the early data very likely mask variations similar to what we are seeing in the last 100 years -- ie they greatly exaggerate the smoothness of history and create a false impression that recent temperature changes are unprecedented (also the grey range bands are self-evidently garbage, but that is another story).
Drum's response was that "it was published in Science." Apparently, this sort of appeal to authority is what passes for data analysis in the climate world.
Well, maybe I did not explain the issue well. So I found a political analysis that may help Kevin Drum see the problem. This is from an actual blog post by Dave Manuel (this seems to be such a common data analysis fallacy that I found an example on the first page of my first Google search). It is an analysis of average GDP growth by President. I don't know this Dave Manuel guy and can't comment on the data quality, but let's assume the data is correct for a moment. Quoting from his post:
Here are the individual performances of each president since 1948:
1948-1952 (Harry S. Truman, Democrat), +4.82%
1953-1960 (Dwight D. Eisenhower, Republican), +3%
1961-1964 (John F. Kennedy / Lyndon B. Johnson, Democrat), +4.65%
Look, a hockey stick , right? Obama is the worst, right?
In fact there is a big problem with this analysis, even if the data is correct. And I bet Kevin Drum can get it right away, even though it is the exact same problem as on his climate chart.
The problem is that a single year of Obama's is compared to four or eight years for other presidents. These earlier presidents may well have had individual down economic years - in fact, Reagan's first year was almost certainly a down year for GDP. But that kind of volatility is masked because the data points for the other presidents represent much more time, effectively smoothing variability.
Now, this chart has a difference in sampling frequency of 4-8x between the previous presidents and Obama. This made a huge difference here, but it is a trivial difference compared to the 1 million times greater sampling frequency of modern temperature data vs. historical data obtained by looking at proxies (such as ice cores and tree rings). And, unlike this chart, the method of sampling is very different across time with temperature - thermometers today are far more reliable and linear measurement devices than trees or ice. In our GDP example, this problem roughly equates to trying to compare the GDP under Obama (with all the economic data we collate today) to, say, the economic growth rate under Henry the VIII. Or perhaps under Ramses II. If I showed that GDP growth in a single month under Obama was less than the average over 66 years under Ramses II, and tried to draw some conclusion from that, I think someone might challenge my analysis. Unless of course it appears in Science, then it must be beyond question.
Kevin Drum can't believe the folks at the National Review are still calling global warming science a "myth". As is usual for global warming supporters, he wraps himself in the mantle of science while implying that those who don't toe the line on the declared consensus are somehow anti-science.
Readers will know that as a lukewarmer, I have as little patience with outright CO2 warming deniers as I do with those declaring a catastrophe (for my views read this and this). But if you are going to simply be thunderstruck that some people don't trust climate scientists, then don't post a chart that is a great example of why people think that a lot of global warming science is garbage. Here is Drum's chart:
The problem is that his chart is a splice of multiple data series with very different time resolutions. The series up to about 1850 has data points taken at best every 50 years and likely at 100-200 year or more intervals. It is smoothed so that temperature shifts less than 200 years or so in length won't show up and are smoothed out.
In contrast, the data series after 1850 has data sampled every day or even hour. It has a sampling interval 6 orders of magnitude (over a million times) more frequent. It by definition is smoothed on a time scale substantially shorter than the rest of the data.
In addition, these two data sets use entirely different measurement techniques. The modern data comes from thermometers and satellites, measurement approaches that we understand fairly well. The earlier data comes from some sort of proxy analysis (ice cores, tree rings, sediments, etc.) While we know these proxies generally change with temperature, there are still a lot of questions as to their accuracy and, perhaps more importantly for us here, whether they vary linearly or have any sort of attenuation of the peaks. For example, recent warming has not shown up as strongly in tree ring proxies, raising the question of whether they may also be missing rapid temperature changes or peaks in earlier data for which we don't have thermometers to back-check them (this is an oft-discussed problem called proxy divergence).
The problem is not the accuracy of the data for the last 100 years, though we could quibble this it is perhaps exaggerated by a few tenths of a degree. The problem is with the historic data and using it as a valid comparison to recent data. Even a 100 year increase of about a degree would, in the data series before 1850, be at most a single data point. If the sampling is on 200 year intervals, there is a 50-50 chance a 100 year spike would be missed entirely in the historic data. And even if it were in the data as a single data point, it would be smoothed out at this data scale.
Do you really think that there was never a 100-year period in those last 10,000 years where the temperatures varied by more than 0.1F, as implied by this chart? This chart has a data set that is smoothed to signals no finer than about 200 years and compares it to recent data with no such filter. It is like comparing the annualized GDP increase for the last quarter to the average annual GDP increase for the entire 19th century. It is easy to demonstrate how silly this is. If you cut the chart off at say 1950, before much anthropogenic effect will have occurred, it would still look like this, with an anomalous spike at the right (just a bit shorter). If you believe this analysis, you have to believe that there is an unprecedented spike at the end even without anthropogenic effects.
There are several other issues with this chart that makes it laughably bad for someone to use in the context of arguing that he is the true defender of scientific integrity
The grey range band is if anything an even bigger scientific absurdity than the main data line. Are they really trying to argue that there were no years, or decades, or even whole centuries that never deviated from a 0.7F baseline anomaly by more than 0.3F for the entire 4000 year period from 7500 years ago to 3500 years ago? I will bet just about anything that the error bars on this analysis should be more than 0.3F, much less the range of variability around the mean. Any natural scientist worth his or her salt would laugh this out of the room. It is absurd. But here it is presented as climate science in the exact same article that the author expresses dismay that anyone would distrust climate science.
A more minor point, but one that disguises the sampling frequency problem a bit, is that the last dark brown shaded area on the right that is labelled "the last 100 years" is actually at least 300 years wide. Based on the scale, a hundred years should be about one dot on the x axis. This means that 100 years is less than the width of the red line, and the last 60 years or the real anthropogenic period is less than half the width of the red line. We are talking about a temperature change whose duration is half the width of the red line, which hopefully gives you some idea why I say the data sampling and smoothing processes would disguise any past periods similar to the most recent one.
Update: Kevin Drum posted a defense of this chart on Twitter. Here it is: "It was published in Science." Well folks, there is climate debate in a nutshell. An 1000-word dissection of what appears to be wrong with a particular analysis retorted by a five-word appeal to authority.
I wrote below about Chinese pollution, but here is one other thought. Shifting Chinese focus from reducing CO2 with unproven 21st century technology to reducing particulates with 1970s technology would be a great boon for its citizens. But it could well have one other effect:
It might reverse the warming in the Arctic.
The reduction of Arctic ice sheet size in the summer, and the warming of the Arctic over the last several decades, is generally attributed to greenhouse warming. But there are reasons to doubt that Co2 is the whole story. One is that the sea ice extent in Antarctica has actually been growing at the same time the Arctic sea ice cover has been shrinking. Maybe there is another explanation, one that affects only the northern hemisphere and not the southern?
I don't know if you have snow right now or even ever get snow. If you do, find some black dust, like coal dust or dark dirt, and sprinkle it on a patch of snow. Then come back tomorrow. What will you find? The patch of snow you sprinkled in dark dust melted a lot in comparison to the rest of the snow. This is an albedo effect. Snow takes a while to melt because it reflects rather than absorbs solar radiation. Putting black dust on it changes that equation, and suddenly solar radiation is adsorbed as heat, and the now melts. Fast. I know this because I run a sledding hill in the wintertime, where snow falls on a black cinder hill. The snow will last until even the smallest patch of black cinders is exposed. Once exposed, that small hole will grow like a cancer, as it absorbs solar energy and pumps it into the surrounding ground.
By the way, if you have not snow, Accuweather.com did the experiment for you. See here. Very nice pictures that make the story really clear.
So consider this mess:
Eventually that mess blows away. Where does it end up? Well, a lot of it ends up deposited in the Arctic, on top of the sea ice and Greenland ice sheet.
There is a growing hypothesis that this black carbon deposited on the ice from China is causing much of the sea ice to melt faster. And as the ice sheet melts faster, this lowers the albedo of the arctic, and creates warming. In this hypothesis, warming follows from ice melting, rather than vice versa.
How do we test this? Well, the best way would be to go out and actually measure the deposits and calculate the albedo changes from this. My sense is that this work is starting to be done (example), but it has been slow, because everyone who is interested in Arctic ice of late are strong global warming proponents who have incentives not to find an alternative explanation for melting ice.
But here are two quick mental experiments we can do:
We already mentioned one proof. Wind patterns cause most pollution to remain within the hemisphere (northern or southern) where it was generated. So we would expect black carbon ice melting to be limited to the Arctic and not be seen in the Antarctic. This fits observations
In the winter, as the sea ice is growing, we would expect new ice would be free of particulate deposits and that any new deposits would be quickly covered in snow. This would mean that we should see ice extents in the winter to be about the same as they were historically, and we would see most of the ice extent reduction in the summer. Again, this is exactly what we see.
This is by no means a proof -- there are other explanations for the same data. But I am convinced we would see at least a partial sea ice recovery in the Arctic if China could get their particulate emissions under control.
Via Icecap (I still don't think they have permalinks that work)
In his Dec. 10, 2007 “Earth has a fever” speech, Gore referred to a prediction by U.S. climate scientist Wieslaw Maslowski that the Arctic’s summer ice could “completely disappear” by 2013 due to global warming caused by carbon emissions.
Gore said that on Sept. 21, 2007, “scientists reported with unprecedented alarm that the North Polar icecap is, in their words, ‘falling off a cliff.’ One study estimated that it could be completely gone during summer in less than 22 years. Another new study to be presented by U.S. Navy researchers later this week warns that it could happen in as little as seven years, seven years from now.”
Maslowski told members of the American Geophysical Union in 2007 that the Arctics summer ice could completely disappear within the decade. “If anything,” he said, “our projection of 2013 for the removal of ice in summer...is already too conservative.”
The former vice president also warned that rising temperatures were “a planetary emergency and a threat to the survival of our civilization.”
However, instead of completely melting away, the polar icecap is at now at its highest level for this time of year since 2006.
I discuss in a bit more detail at my climate blog why I feel like climate blogging has become boring and repetitious. To prove it, I predict in advance the stories that skeptics will run about the upcoming IPCC report.
Kevin Drum quoted this from James Fallows in a post labelled "threat inflation"
As I think about it this war and others the U.S. has contemplated or entered during my conscious life, I realize how strong is the recurrent pattern of threat inflation. Exactly once in the post-WW II era has the real threat been more ominous than officially portrayed
I thought, "wow, someone from the Coke or the Pepsi party is finally going to call BS on all the apocalyptic forecasts from both parties over the sequester." But alas, he was just discussing foreign policy. That is not to say I don't agree with the basic point, that foreign policy prescriptions are often accompanied by exaggerated horror stories of imminent threats -- I just wish they would recognize the same dynamic on the domestic front, whenever the smallest cut in government spending growth rates suddenly mean we are are going to put grandma out on an ice flow to freeze.
Glendale administrators propose cutting nearly a quarter of the city's employees, or 249 positions, if voters approve a ballot measure in November to repeal a sales-tax hike.
Repeal of the 0.7 percentage-point tax hike that took effect last month would mean the loss of $11 million this year and $25 million annually through 2017, according to city estimates.
The City Council had approved the temporary increase to shore up its deficit-ridden general fund after laying off 49 employees and cutting $10 million from departments at the start of this fiscal year....
Proposed cuts include shuttering two of the three city libraries, one of its two aquatic centers, the TV station and all city festivals, including Glendale Glitters.
The article continues with the usual panic about cuts in police and firefighters and libraries and parks, etc. etc. What the article does not mention except in passing in paragraph 12 is the reason for the tax increase and the budget problems in the first place. Over heated opposition in the community, the City Council, which has enjoyed pretending to be big shot Donald Trumps over the last few years with taxpayer money, handed a private individual $25 million a year to keep the ice hockey team in town, an ice hockey team that has the lowest attendance in the league despite doing fairly well the last few years. This is on top of years of other subsidies and the taxpayer-funded $300 million stadium. The numbers line up exactly -- a new $25 million a year subsidy and a new $25 million a year tax, and the paper cannot even connect these dots, even when they were directly connected in real time (ie the tax was specifically justified to pay for the subsidy).
What the article entirely fails to mention is that, given no voice in these corporatist extravagances in Glendale (the tiny town of 250,000 has also subsidized an NFL franchise and a couple of MLB teams), the only way the citizens of this town have any way to exercise accountability is to vote down the tax that enables this corporate handout. They were not allowed to vote on the deal itself. This is not a bunch of wacky red-staters voting to decimate the parks departments, as the city and the paper would like you to believe, but a citizenship that is tired of the idiotic corporate cronyism in the Glendale city council and are looking for some way, any way, to enforce some accountability.
This is the media and the state in bed together promoting the larger state. Glendale's problems are entirely self-imposed, spending huge amounts of tax money on subsidizing sports teams and real estate ventures. When these all failed like so many Solyndras, they are trying to make this out to be a tax shortfall, when in fact it is spending idiocy.
The media always seems to participate as a cheerleader in this statism, but local papers have a special interest in promoting this sort of sports corporatism. Just about the only thing that sells dead-tree newspapers any more is the sports section. I would love to see what would happen to circulation rates if they cut the sports section. So any state actions that add professional sports franchises or keeps them in town contribute directly to the newspapers' survival.
For years now I have lampooned the crazy money Glendale, AZ has thrown at the Phoenix ice hockey team in a desperate attempt to trade taxpayer money for prestige. Let me bring you up to date:
Years ago a town of about 250,000 people committed about $200 million in taxpayer money to build a stadium for a professional ice hockey team, to attract it away from Scottsdale or downtown Phoenix to what is frankly the ass-end of the metropolitan area (I have no problems with the west side of town, but from a geographic, demographic, and economic logic standpoint this was roughly equivalent to moving the LA Lakers to Riverside or San Bernardino).
For some weird reason, moving an ice hockey team to the desert with no base of hockey fans and locating it a good 45 minutes from the wealthier parts of town caused the team to go bankrupt. Lots of people were willing to pay good money to haul the team back to Canada where there are, you know, ice hockey fans, but few wanted to pay good money to keep it on the west side of Phoenix.
So enter the NHL, which took the team over. The NHL commissioner promised the other owners that it would not lose money on the deal, so it set the price of the team not at the market price (which appears to be around $100 million based on the Atlanta sale) but based on its costs, which were about $200 million. It has agreed to try to keep the team in Glendale, but only if the city covers its operating losses of $25 million each year, which incredibly, the city has done for two years (note this is $100 a year for every man, woman, and child in the city to subsidize a hockey team).
The team may be worth $200 million in Canada, but it is only worth $100 million in Glendale (at most) so it does not sell. The city agreed to make up the $100 million difference with a bond issue (and throw another $90+ million in to boot), which almost closed the deal with one buyer until the Goldwater Institute pointed out that this kind of subsidy was illegal under the AZ constitution. And so the situation sits. The asking price is still $200 million, which no one will pay if they have to keep the team in Glendale. And the city keeps forking over $25 million a year to the NHL to keep the team running.
The league, which purchased the Phoenix Coyotes at a bankruptcy court auction in 2009, has been managing the team and city-owned arena until an owner willing to keep the team in Glendale can be found. The city paid $25 million to the NHL during the 2010-11 season and pledged another $25 million for the current season, which is expected to come due in May.
To fulfill that pledge, the city put $20 million in escrow and still needs to come up with $5 million.
The hefty payouts have nearly drained the city's reserves, leading to a recent drop in the city's bond rating.
And the city is looking at a deficit next fiscal year that one councilwoman has estimated could reach $30 million. A possible sales-tax hike, furloughs and program cuts are on the table to close the spending gap....
During Tuesday's budget talks, [Glendale Mayor] Scruggs asked council members to join her in signing a letter to NHL Commissioner Gary Bettman to "release us from that $20 million in escrow and let us pay over time."
None of the councilmembers responded to her request. Councilman Manny Martinez later told The Republic he would "have to think about it in light of what is going on."
Scruggs said if the city can get back the $20 million from escrow and pay the NHL an initial $5 million, "our problems and everything our employees are fearful of would pretty much go away."
Translation: Dear NHL, we are idiots and committed a bunch of money to a stupid purpose that we can't really afford. Would you pretty please let us out of our commitment? Hilarious and pathetic. The chickens are coming home to roost by the millions.
Even funnier, the Glendale mayor is trying to blame the NHL for bad faith
The mayor said she and four others councilmembers pledged the second payout last May because city staff and NHL Deputy Commissioner Bill Daly said a deal with a team owner was nearly complete and that "we should never have to pay that $25 million."
Scruggs said the city was told the money was just a place holder so that the NHL wouldn't move the team out of Glendale.
"Given the stress that our budget is under, there should be a payment plan developed," Scruggs said. "They have no right to that money. They held us hostage for a year."
She said the NHL never intended to do business with Chicago businessman Matt Hulsizer, who wanted to buy the team but walked away from the negotiation table in frustration just weeks after the council pledged the second payment to the NHL....
Scruggs said the NHL last spring "misled us and they can't do this to our city."
In fact, the NHL was totally serious about the Hulsizer deal. That deal fell through not because the NHL screwed up, but because Glendale did. The deal fell through because Glendale had committed to a subsidy of the deal which may not have been Constitutional, and even if it had proved legal, became impossible when Glendale's bond ratings started tanking and they realized they could not move the paper. Glendale officials have been amateurish and dishonest through this entire process.
By the way, several years ago, Jim Balsillie offered a deal worth over $200 million for the team, PLUS he offered to pay off something like $150 million of Glendale's stadium debt. Glendale opposed the deal, because they would have been left with an empty stadium and tens of millions in debt (given the crash in RIM's fortunes, the offer is unlikely to be renewed).
Glendale is likely going to wish they had taken the first offer. There is a very good chance that Glendale will lose the team without any sort of payment on their debt and after paying $25 million a year to the NHL. Glendale will end up with hundreds of millions in debt, an empty stadium, a junk-level bond rating and a busted budget.
There is a saying in the investment world - your first loss is your best loss. Glendale is about to learn this very expensive lesson.
OK, those of you looking for a business opportunity, Taylor dominates the soft-serve ice cream machine business. Today one of our machines broke. We got a quote for a refurbished machine -- with trade-in of our old macine - $14,000! The brand new ones cost as much as a car.
So investors -- there is your flashing price signal. There should be a big enough umbrella here to make some money with a good design and thoughtful sourcing. And I can tell you everyone who uses these machines is eagerly awaiting such an entrant.
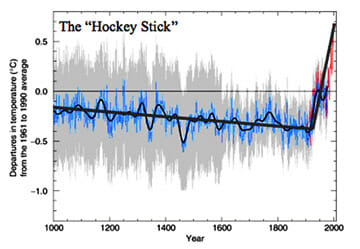


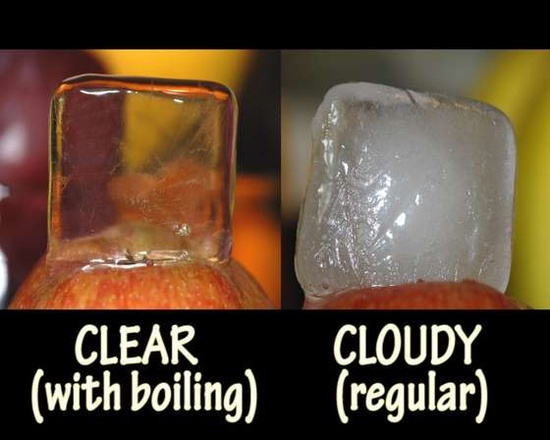


