Posts tagged ‘2008’

California Governor Finally Sees Reason on High-Speed Rail. And Then He Doesn't

Via USA Today:

California Gov. Gavin Newsom has announced that he’s abandoning a plan to build a high-speed rail line between Los Angeles and San Francisco.

The project's cost has ballooned to $77 billion.

“Let’s be real,” Newsom said in his first State of the State address on Tuesday. “The current project, as planned, would cost too much and respectfully take too long. There’s been too little oversight and not enough transparency.”

Hurray!  This is long overdue.  I was writing about how dumb an idea this was back in 2008.  I remember it because I was on Fox and Friends in the worst time slot ever to talk about it.  Not only was the interview at like 4AM Arizona time, but the segment immediately before I discussed economics and public policy *yawn* they had 8 cute maltese puppies frolicking on stage.

Everyone, including I would bet California officials but probably excepting elements of the fawning media, knew the cost estimates were a joke.  In 2010 when CA said $30-$40 billion I said it would take at least $75 billion and when CA belatedly adopted that number I doubled it to $150 billion and I think that is still low for what it would have cost.  This was all at a time when you could fly Burbank to Oakland on Southwest for $90.

But because it seems to be a rule that no CA politician can remain sane for more than 5 minutes straight, here are the next lines of the story:

Newsom, though, said he wants to finish construction already underway on a segment of the high-speed train through the Central Valley. The project would connect a 119-mile stretch from Merced to Bakersfield.

“I know that some critics are going to say, ‘Well, that’s a train to nowhere.’ But I think that’s wrong and I think that’s offensive,” Newsom said. “It’s about economic transformation. It’s about unlocking the enormous potential of the Valley.”

This is absolutely absurd.  If you started with a clean sheet and studied what the Central Valley really needed for "economic transformation," I am willing to bet a high-speed rail line from Merced to Bakersfield would not be in the top 100 items, maybe not the top 1000.  Probably first on the list for the Central Valley economy would be to stop applying minimum wage rates based on San Francisco to poorer rural areas of California.  If you wanted to limit yourself to infrastructure projects, the Central Valley would probably beg for water infrastructure projects, not a silly overpriced train.

Transpartisan Plan #2: A Better Approach to Government Health Care: Focus the Government on the One Thing It Does Best

So this is my second in a series of transpartisan proposals, the unintended consequence of which is likely to have me ostracized not just by the two major parties but by the libertarian community as well.  My first such proposal, on climate, helped get me ostracized from the climate skeptic community.  Much of this article is based on a proposal I first made in 2015.

I want to say at the top that unlike my climate plan, this is not a plan so much as a concept for a plan.  As in climate, tribalism and muddled thinking about goals has made it hard to make forward progress on the role of government in health care.  The Democrats in 2008 and 2018 and the Republicans in 2010 arguably won a lot of Congressional seats stirring up fears about health care, so it is a vital issue with the public.  For those who want to just dig in their heals and wait until it all goes away, I don't think this will happen.  And I think the logic I outline is superior to the typical political process described by Megan McArdle as 

  1. Something must be done.
  2. This is something.
  3. Therefore, this must be done.

I think the key to creating a viable program for health care depends on being very clear on the goals that one is trying to achieve and matching those goals well with the capabilities of government.  Obamacare was a huge mess in this regard, weaving all over the place in terms of goals (increasing insurance coverage, lowering costs, improving care effectiveness) and assigning roles to the government that were laughably poorly matched to its skills.

Take increasing the percentage of Americans with health insurance, probably the number one goal of Obamacare and the metric most cited to evaluate its success.  Is the core need of Americans really to have health insurance, or it something else?  Is mandating that people buy insurance they don't value in order to improve this metric really improving individual well-being?  Does increased coverage really translate to increased health? (spoiler -- any causal link here is really tenuous in the data).  All these questions and more exist because increasing insurance coverage was the wrong goal.  So is anything having to do with "pre-existing conditions" as Democrats framed it (fairly successfully) in the recent election.

The #1 Consumer Need and Fear in Health Care

Here is my main assumption:  The real, core need of individuals is that a) when they or a family member get dreadfully sick, lack of money will not be a barrier to getting them the needed care and b) even if they can get the care, they would really prefer not to be bankrupted by it.  All these other things -- percent covered by insurance, mandates to accept pre-existing conditions, insurance mandates and subsidies -- are all imperfect proxies for this core need.

This is exactly the kind of need that we buy catastrophic insurance to cover.  I would be bankrupted and homeless if my house burned down and I was still responsible for the mortgage but relatively inexpensive fire insurance covers that.  Losses are not usually correlated (ie one loss does not make it more likely I have a second loss, except in flood insurance which is why there is no private flood insurance any more) so I don't worry about non-renewal even after a major fire.

But obviously health care is different.  Health problems this year greatly raise the probability of health problems in future years.  There is every incentive for an insurer to bail on you after one bad year.   This is the major fear that then follows the need - that catastrophic insurance will no longer be available after the first claim.  Had health insurance developed differently (e.g. with policies that covered more than just one year, more like term life) we might be in a different situation, but here we are.

Government is Good at Having Lots of Money on Call

And the good news is that the one thing the government is really, really good at is being an insurer of last resort -- they have the deep pockets and the fiat money power to do this better than anyone else -- that is why they are the insurer of last resort of bank deposits and for flood insurance (I am not saying that there are not moral hazards in these or unintended consequences, but the insurance works).  So there is the clear opportunity -- what people need most is catastrophic insurance even when the private market won't provide it and the government does really well is provide catastrophic insurance as a last resort.

Before we get into the plan itself, let's discuss a few things that the government does NOT do well:

Government is Bad at Cost control.

I feel like arguing that government is bad at cost control should be about as necessary as arguing that socialism always fails, but I guess it just needs to be repeated over and over.  A large part of the PPACA (Obamacare) was adding provisions meant to reap cost savings in health care.  None of it has worked.  The problem is that any real markets for health care have been disappearing for decades as more and more health care expenses get paid by third parties rather than individuals making price/value trade-offs (as they do with pretty much everything else -- the prosaic word for this is "shopping").

Now, Democrats are increasingly seeking "single payer" health care, arguing that aggregating all purchases in one entity will result in huge negotiating leverage.  But this never has been true.  It is impossible to have a real price negotiation without a market, and market price, to reference.   Look at another area of government spending where the government does 100% of the industry purchasing:  military hardware.  Do you really have the sense that the military is getting great pricing due to their purchasing power?  Supporters will site discounts that Medicare gets over other buyers for certain services and pharmaceuticals.  But note again that this is all in reference to a market price benchmark, that will disappear with single payer.  Further, many of the savings Medicare gets are not real savings, but cross subsidies where other customers end up paying more so Medicare can get something below cost.  When the government is buying everything, this cross-subsidy goes away.  And can you even imagine the lobbying and cronyism and opportunities for graft that will exist once government pricing is untethered from any market price?  Just think again about military procurement.

I suppose that the government could turn all health care suppliers into a huge regulated utility, for example paying pharmaceutical companies a utility-like cost plus a fixed return on drugs.  If this occurs, I hope you are satisfied with the range of treatments you have today because you won't get many others -- if you don't believe me, name the three most recent innovations that have come out of your local regulated utility.  Typically all they do is fight innovation (e.g. rooftop solar and co-generation).Finally, the government has a lot of regulations that Congress did not touch in the PPACA that restrict supply and greatly increase costs.  For example, many states and municipalities have certificate of need processes that prevent new entrants from adding hospitals or even new equipment without the permission of existing competitors.  The same is true in occupational licensing, which protects the most skilled (and expensive) health care workers from competition on simple procedures (e.g. why is someone required to go through a decade of medical training to put stitches in my kid's elbow?)

I will say that the PPACA has perhaps had an accidental effect on costs but not through any intended mechanism.  As deductibles in the gold/silver/bronze exchange plans have gone up to try to keep a lid on premiums, individuals previously used to first dollar health care now find themselves responsible for making spending choices.  This is a good thing, maybe the best part of the whole program.

Government is Bad at Service Effectiveness. 

The PPACA also sought to increase the effectiveness of health care providers.  The problem is that it is impossible for a small group of people in Washington to do this.  We are 300 million consumers who each make trade-offs in different ways and define effectiveness differently.  Take an example from another field:  Hair care.  In the state of AZ, hair cutters must go through 2000 hours of training to be licensed to cut hair -- they must demonstrate proficiency in all sorts of hair styles.  I personally don't give a cr*p about that -- I tend to choose the fastest, cheapest person who does a reasonable job.  But no one in government has anticipated that as a valid consumer need.

The PPACA was larded with expensive provisions that reflected the vision of a few elites about how they personally wanted health care performed.  A great example is the whole electronic medical records requirement, likely stuck in their based on a lot of intensive lobbying by makers of this software.  I have yet to meet a doctor who likes this software, or who feels that their patient service is improved by it, but everyone has to do it none-the-less.Perhaps even more than the cost issue, it is amazing to me that anyone believes that government involvement will make some service more effective.  If you think it can, I urge you to take two identical copies of documents, and go through the process of sending and tracking one by Fedex and sending and tracking one via the post office

Outlines of A Plan

I am not sure how you actually do this, but I think being clear on the goal and the useful (and not useful) roles of government in the process are good.  Rather than a plan, I offer some design goals for a plan

  1. Make the government the insurer of last resort to make sure that all Americans are protected against catastrophic health care costs in a year.  One approach, though probably not the most compact, is to make the government responsible for all non-discretionary individual health care expenditures in a year above a certain percentage of that person's adjusted gross income for that year.   I am thinking personal responsibility numbers that start at 15% of AGI and could increase in higher income brackets. Yes, if you are a person making $50,000 a year, then $7,500 of out of pocket health care expenses will be difficult -- but likely not bankrupting and not a barrier to getting needed care.   Perhaps we exclude social security from AGI and apply this to seniors as well, effectively eliminating medicare and phasing out government benefits for wealthy seniors.I am open to a more compact way of doing this. Perhaps guaranteed-entry government subsidized high-risk pools for health insurance.  The problem is that insurance companies will just dump all their expensive customers into those pools and we will end up with a system as costly to the taxpayers as the one above but less rationally organized.
  2. Shift as many of the individual spending price / value tradeoffs as possible into individual hands.  The step outlined above in #1 is a good start, at least for more routine purchases.  As a design goal, at every turn, try to build in ways for consumers to get money back or get rewarded for choices to use less or more inexpensive care.I do not think there is anything with more potential leverage for improving the health care world than bringing back individual shopping for medical care.  My kid used to injure himself a lot in sports and we had a high deductible on our insurance, so we found a sports medicine guy who charged us only $50 a visit if we paid cash.  Then he told us that when we went downstairs to the radiology company, to tell them we were paying cash.  Sure enough, the lady there pulled out a special book from behind the counter and the $300+ they charge to the insurance companies became $40 to us.  On the other hand, we have spent weeks talking to doctors and hospitals about  heart surgery my mother-in-law (who is covered by Medicare) needs.  You know what has not come up a single time?  Price.  I have zero idea how much it will cost -- but let's say it is $100,000.  Can you imagine buying anything else that expensive without discussing the price once?
  3. Any medical benefits paid by the employer become fully taxable
  4. Price transparency mandates -- every provider must disclose the best price it sells a product and service at, as well as your price.  For all but emergency procedures, a cost estimate must be given in advance (My dog had to have surgery and even in an emergency condition they gave me a detailed cost estimate in advance).
  5. Systematic review of supply restrictions and rethinking of licensing arrangements. Banning of state and local certificate of need processes.
  6. Accelerated and streamlined drug approval process.  Really what I would like to see is that there is a government led testing process that leads not to an approval/refusal but to the publication of safety/effectiveness data that doctors and patients can then use to make their own decisions.

Hat tip to Megan McArdle who has been suggesting something like this for years, probably long before I started thinking about it.

What I Am Wondering About Inflation

Tyler Cowen asks, "Why isn’t inflation higher?"  I have wondered that for a while, but monetary policy and related topics in macro are one of the areas I admit that I simply do not understand so I don't write about it.  So rather than offering any hypotheses to Cowen's question, I will ask my own:

  1. Is it possible that inflation exists but it shows up mainly in financial assets (stocks, bonds, perhaps real estate) that don't really factor into standard inflation metrics?  Every step the Fed has taken, as well as other western central banks, appears to me to be crafted to pump money into securities markets rather than into main street.  Certainly we have seen a huge inflation in the value of financial assets and real estate over the past several years.
  2. Expansion of the economy above the rate of productivity improvement should drive inflation, unless there was a lot of excess capacity to soak up.   That may have been partly the case in the US since 2008, but surely that is gone.  Does the still greatly underutilized Chinese and Indian labor force act as excess capacity that prevents inflation from heating up here?  If so, might Trump's trade restrictions interfere with this going forward?

Another Phoenix Light Rail Fail: Light Rail KILLS Transit Systems

Well, another year's ridership numbers are out for Valley Metro and Phoenix light rail and they are just as grim as they have been every year since Phoenix spent the first $1.4 billion on the first leg of the rail system (source)

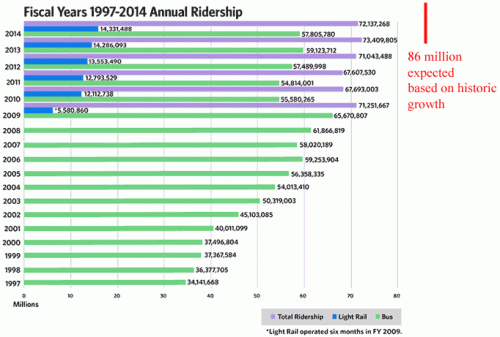
Now, this picture is bad enough, until you realize that Valley Metro completed a huge extension of the rail line in 2016.  In 2016 the line length was increased by 31% and the cumulative capital investment increased by 36%.  With, as you can see, essentially zero effect on rail ridership in red.  The only small highlight was that after falling for years, bus ridership actually perked up a few percent.  As you may remember from earlier posts, bus ridership could be expected to fall due to cannibalization from light rail, but in fact it tends to fall even faster than rail ridership rises, causing total ridership to fall.  The reason is that light rail costs at least an order of magnitude more (including amortized capex) per passenger mile than busses, and so light rail tends to starve the bus system of funds.  Every light rail system implementation has been met with the need to slash bus service to pay for the huge light rail costs.  So despite enormous operating subsidies and more than $2 billion in cumulative capex, rail ridership has been flat and total transit ridership has fallen.

But in fact the picture is worse than this when you look over a longer timeframe, which is why Valley Metro has probably changed their practice from graphing nearly 20 years of history to graphing just 6.  Here is an older chart of theirs I posted years ago: (the top year in this chart is the bottom year in the chart above)

I will get back to the annotation in a moment.  But notice that despite all the cost and disruption and higher taxes from the light rail system, total ridership this year of 66.8 million is less than any year since light rail was opened and baredly 8% higher than it was before light rail opened 10 years ago in 2008.  Just organic city growth and recovery of the economy since 2008 should have driven faster growth than this.  In fact, in the 10 years before light rail was opened, Phoenix transit ridership grew 70%.  If that organic growth rate in bus service had been allowed to continue without the backbreaking costs and limited capacity of light rail being added to the mix, we should have expected 105 million riders this past year, not 66.8 million.

Worker Mobility and Exploitation

The other day I commented on an interview with an author who felt that seniors living in RV's and "work camping" were somehow more vulnerable to exploitation.

Imagine a person in a small town with a home and she works in the local factory, really the only major employer in that small town.  If she thinks she is getting hosed at work, what can she do?  She can certainly quit, but then she likely must sell her house, find a new place to live, move to a new city, etc.  Basically, she has high job switching costs and thus probably would have to put up with more cr*p before she would leave.  Now imagine our work campers.  I once had an employee tell me that I had to treat him well, because he had wheels on his home and could leave any time.  And he was right.   Work campers, being more mobile, have much lower job switching costs.  Economically, this should make them less, rather than more, vulnerable to exploitation.

As a side note, this is one reason (beyond the obvious ones highlighted by the 2008 crash) that I have always thought the government promotion of home ownership was counter-productive.  I call this cargo cult economics -- legislators observe that successful people own homes, so therefore pass legislation on the assumption that having people own a home will make them successful.  But in fact I think for many classes of workers, home ownership is counter-productive because it reduces their mobility and greatly increases their job switching costs.  I personally, between the ages of 24 and 40, had jobs in 7 different cities in pursuit both of opportunity and employment that matched my interests and skills.  Had I locked myself into my first location (Baytown, Texas) I can't imagine I would be as well off today.

$150 Million in Lost Tax Money Later, Another Sorry Tale Of Government "Investment" Hopefully Comes to An End

Years ago I wrote about the Sheraton hotel the city built:

For some reason, it appears that building hotels next to city convention centers is a honey pot for politicians.  I am not sure why, but my guess is that they spend hundreds of millions or billions on a convention center based on some visitation promises.  When those promises don't pan out, politicians blame it on the lack of a hotel, and then use public money for a hotel.  When that does not pan out, I am not sure what is next.  Probably a sports stadium.  Then light rail.  Then, ?  It just keeps going and going....

When Phoenix leaders opened the Sheraton in 2008, they proclaimed it would be a cornerstone of downtown's comeback. They had one goal in mind: lure big conventions and tourism dollars. Officials argued the city needed the extra hotel beds to support its massive taxpayer-funded convention center a block away.

Finally, we may be at an end, though politicians are still hoping for some sort of solution that better hides what a sorry expenditure of tax money this really was

Phoenix has entered into exclusive negotiations to sell the city-owned Sheraton Grand Phoenix downtown hotel —the largest hotel in Arizona — for $255 million.

The city signed a letter of intent with TLG Phoenix LLC, an investment company based in Florida, to accept the offer and negotiate a purchase contract, city officials announced Tuesday evening.

But the deal faces criticism from some council members concerned about the loss to taxpayers. The city also attempted, unsuccessfully, to sell the hotel to the same buyer for a higher price last year.

If Phoenix ultimately takes the offer, the city's total losses on the taxpayer-funded Sheraton could exceed $100 million.

The city still owes $306 million on the hotel and likely would have to pay that off, even after a sale. That would come on top of about $47 million the city has sunk into the hotel, largely when bookings dropped due to the recession.

...

In addition to taking a loss on the building, Phoenix would give the buyer a property-tax break — the city hasn't released a potential value for that incentive — and transfer over a roughly $13 million reserve fund for hotel improvements.

By the way, the hotel -- after just 9 years under city ownership -- will require a $30 to $40 million face lift from the owner.  Why do I suspect that part of the sales price problem is that the government, like with every other asset it owns, did not keep up with its regular maintenance?

Update:  Phoenix is in the top ten US cities in terms of hotel room capacity, so city government of course detects that there is a market failure such that the city ... needs more hotel rooms, so it gets the government in the business of building more.  Good plan.

Coyote's first rule of government authority: Never support any government power you would not want your ideological enemy wielding

Way back in 2014 I wrote:

I often wonder if Democrats really believe they will hold the White House forever.  I suppose they must, because they seem utterly unconcerned, even gleeful in fact, about new authoritarian Presidential powers they would freak out over if a Republican exercised.

Coyote's first rule of government authority:  Never support any government power you would not want your ideological enemy wielding.

As Damon Root writes:

In December 2007 presidential candidate Barack Obama told The Boston Globe that if he won the 2008 election, he would enter the White House committed to rolling back the sort of overreaching executive power that had characterized the presidency of George W. Bush. "The President is not above the law," Obama insisted.

Once elected, however, President Obama began to sing a different sort of tune. "We're not just going to be waiting for legislation," Obama announced. "I've got a pen and I've got a phone...and I can use that pen to sign executive orders and take executive actions and administrative actions."...

To make matters worse, many of Obama's fervent liberal supporters pretended to see nothing wrong with such obvious abuses of executive power. For example, consider the behavior of the prestigious editorial board of The New York Times. Back in 2006, when George W. Bush had the reins, the Times published an unsigned editorial lambasting Bush for his "grandiose vision of executive power" and his foul scheme to sidestep the Senate and unilaterally install his nominees in high office. "Seizing the opportunity presented by the Congressional holiday break," the Times complained, "Mr. Bush announced 17 recess appointments—a constitutional gimmick."

But guess what the Times had to say a few years later when President Obama had the reins and he utilized the exact same gimmick? "Mr. Obama was entirely justified in using his executive power to keep federal agencies operating," the Times declared in defense of Obama's three illegal appointments to the National Labor Relations Board. (Those three NLRB appointments, incidentally, were ruled unconstitutional by a 9-0 Supreme Court.)

I remember a conversation with my mother-in-law, who is a fairly accurate gauge of New England Left-liberal thought.  She was absolutely adamant that the Republican Congress, from the very beginning, had dug in and refused to work with Obama and that the resulting gridlock gave Obama the absolute right to work around Congress and govern by fiat.   I remember asking her, are you comfortable giving President Lindsey Graham that power too? (Trump was not even a glimmer in the eye of the body politic at that point so Graham was the best Republican bogeyman I could think up on short notice).  I don't remember an answer to this, which reinforced the sense I had at the time that Democrats honestly did not think they would lose the White House in their lifetimes -- I suppose they thought that 8 years of Obama would be followed by 8 years of Clinton.

Well, the freak out is officially here and I will happily embrace all Democrats who want to make common cause in limiting Presidential power.


Update:  Glenn Greenwald makes many of the same points

Sen. Barack Obama certainly saw it that way when he first ran for president in 2008. Limiting executive-power abuses and protecting civil liberties were central themes of his campaign. The former law professor repeatedly railed against the Bush-Cheney template of vesting the president with unchecked authorities in the name of fighting terrorism or achieving other policy objectives. “This administration also puts forward a false choice between the liberties we cherish and the security we provide,” he said in 2007. Listing an array of controversial Bush-Cheney policies, from warrantless domestic surveillance to due-process-free investigations and imprisonment, he vowed: “We will again set an example for the world that the law is not subject to the whims of stubborn rulers.”

Yet, beginning in his first month in office and continuing through today, Obama not only continued many of the most extreme executive-power policies he once condemned, but in many cases strengthened and extended them. His administration detained terrorism suspects without due process, proposed new frameworks to keep them locked up without trial, targeted thousands of individuals (including a U.S. citizen) for execution by drone, invoked secrecy doctrines to shield torture and eavesdropping programs from judicial review, and covertly expanded the nation’s mass electronic surveillance.

Blinded by the belief that Obama was too benevolent and benign to abuse his office, and drowning in partisan loyalties at the expense of political principles, Democrats consecrated this framework with their acquiescence and, often, their explicit approval. This is the unrestrained set of powers Trump will inherit. The president-elect frightens them, so they are now alarmed. But if they want to know whom to blame, they should look in the mirror.

Perhaps Not a Trump Win, But A Clinton Loss -- The Trap of Reasoning From a Price Change

One of the homilies one hears all the time from economists is "Never reason from a price change."  What does this mean?  Prices emerge in the market at the intersection of the supply and demand curve.  Often, when (say) a price of a commodity like oil decreases, pundits might reason that the demand for oil has suddenly dropped.  But they don't necessarily know that, not without information other than just the price change.  The price could have dropped because of a shift in the supply curve or the demand curve, or perhaps some combination of both.  We can't know just from the price change.

Which gets me thinking about the last election.  Trump won the election in part because several states like PA and WI, which had been safe Democratic wins in the last several elections, shifted to voting Republican.  Reasoning from this shift, pundits have poured forth today with torrents of bloviation about revolutionary changes in how groups like midwestern white males are voting.  But all these pundits were way wrong yesterday, so why would we expect them to suddenly be right today?  In my mind they are making the same mistake as reasoning from a price change, because the shift in relative party fortunes in a number of states could be because Trump is somehow doing better than Romney and McCain, or it could be because Clinton is doing worse than Obama.  Without other information, it is just as likely the story of the election is about a Clinton loss, not a Trump win.

Republican pundits want to think that they are riding some sort of revolutionary wave in the country.  Democratic pundits don't want to admit their candidate was really weak and like how they can spin white supremacist story lines out of the narrative that Trump won on the backs of angry white men.

The only way we can know the true story is to get more data than just the fact of the shift.  Let's go to Ramesh Ponnuru (and Kevin Drum from the other side of the political aisle makes many of the same points here and here).

The exit polls are remarkable. Would you believe that Mitt Romney won a greater percentage of the white vote than Donald Trump? Mitt took 59 percent while Trump won 58 percent. Would you believe that Trump improved the GOP’s position with black and Hispanic voters? Obama won 93 percent of the black vote. Hillary won 88 percent. Obama won 71 percent of the Latino vote. Hillary won 65 percent.

Critically, millions of minority voters apparently stayed home. Trump’s total vote is likely to land somewhere between John McCain’s and Romney’s (and well short of George W. Bush’s 2004 total), while the Democrats have lost almost 10 million voters since 2008. And all this happened even as Democrats doubled-down on their own identity politics. Black Lives Matter went from a fringe movement to the Democratic mainstream in the blink of an eye. Radical sexual politics were mainstreamed even faster. White voters responded mainly by voting in the same or lesser numbers as the last three presidential elections. That’s not a “whitelash,” it’s consistency.

As I know all too well, a portion of Trump’s online support is viciously racist. Conservative and liberal Americans can and must exercise extreme vigilance to insure that not one alt-right “thinker” has a place in the Trump administration, but it’s simply wrong to attribute Trump’s win to some form of great white wave. Trump won because minority voters let him win. The numbers don’t lie. The “coalition of the ascendant” stayed home.

Trump had roughly the same vote totals as Romney and McCain, and did relatively better with non-whites and Hispanics.   The difference in the election was not any particular enthusiasm for Trump, and certainly not any unique white enthusiasm, but a total lack of enthusiasm for Hillary Clinton.   Look at the numbers in Drum's post -- Hillary did worse with every group.  For god sakes, she did 5 points worse than Obama with unmarried women, the Lena Dunham crowd that theoretically should have been her core constituency.  She did 8 points worse than Obama with Latino women!

This is not a story of a Trump revolution.  This is a story of a loss by a really weak Clinton.  Obama would have dusted the floor with Trump.

The Virtues of Short-Selling

Is there anything that rankles populists who are "anti-speculator" more than the ability to short stocks?  From time to time countries that are upset about falling markets will ban short-selling.  But I have defended stock (and other asset shorting) as a critical market mechanism that helps to limit damaging bubbles.  I wrote waaaaaay back in 2008, after the US temporarily banned short selling of certain assets:

At the start of the bubble, a particular asset (be it an equity or a commodity like oil) is owned by a mix of people who have different expectations about future price movements.  For whatever reasons, in a bubble, a subset of the market develops rapidly rising expectations about the value of the asset.  They start buying the asset, and the price starts rising.  As the price rises, and these bulls buy in, folks who owned the asset previously and are less bullish about the future will sell to the new buyers.  The very fact of the rising price of the asset from this buying reinforces the bulls' feeling that the sky is the limit for prices, and bulls buy in even more.

Let's fast forward to a point where the price has risen to some stratospheric levels vs. the previous pricing as well as historical norms or ratios.  The ownership base for the asset is now disproportionately
made up of those sky-is-the-limit bulls, while everyone who thought these guys were overly optimistic and a bit wonky have sold out. 99.9% of the world now thinks the asset is grossly overvalued.  But how does it come to earth?  After all, the only way the price can drop is if some owners sell, and all the owners are super-bulls who are unlikely to do so.  As a result, the bubble might continue and grow long after most of the world has seen the insanity of it.

Thus, we have short-selling.  Short-selling allows the other 99.9% who are not owners to sell part of the asset anyway, casting their financial vote [on] the value of the company.  Short-selling shortens bubbles, hastens the reckoning, and in the process generally reduces the wreckage on the back end.

I am remembering this old post because Arnold Kling links an interesting bit on economists discussing the Big Short, who among a number of interesting things say this:

Shorting the market in the way they did is very risky, and one has to be very confident, perhaps overconfident, in one’s forecast to take such risks. As a consequence, many people who were pessimistic about the housing market simply stayed on the sidelines—which in turn meant that for a while, valuations in the market primarily reflected the beliefs of optimists.

The timing issue is key.  I have been right probably in 4 of out the 5 major market shorting opportunities I have identified in the last 10 years, but have been on average 2 years early with all of them, meaning I lost money on most of them, or made money after enduring some really big paper losses for a while.

Why Exxon Provides a Good Analogy for the Central Banker's Dilemma

This article on Exxon stock seemed to be an allegory for the current problem central bankers face:

Earlier this month, Exxon Mobil (NYSE:XOM) reported Q4 2015 earningswhich, as expected, looked ugly considering the large decline in the price of oil over the last one and a half years. Exxon Mobil has long been one of the largest repurchasers of shares, spending a net of $89.74B on share buybacks during the 2010 through 2015 period. However, during the Q4 earnings release, management stated that share buybacks were being halted, presumably to preserve cash...

Contrast that with the strategy from 2008 when share buybacks were accelerated during the market fallout of the Lehman Brothers bankruptcy and the beginnings of what's now known as the Great Recession. Management reduced shares outstanding by 7.5% in 2008 alone...

Oil prices have sunk to lows not seen in more than a decade. The share price hit a low in the $60s in 2015 which hadn't been seen since late 2010. If you're of the belief that oil prices will rebound, eventually, then now should be the time that Exxon Mobil is ramping up the share buybacks not eliminating them.

This is the problem the author is highlighting:  Exxon ran up tens of billions in debt to stimulate the stock price in good times.  Now that times are bad, at least in the oil patch, the tank is empty (so to speak) and they have had to cease buybacks at the very time they would make the most sense (the same amount of money spent at lower stock prices would have higher impact on EPS).  The tank is empty enough that they might have to cut the dividend, an action with such negative consequences for stock value that it would likely undo all the effects of years of stock purchases.

I am not trying to beat up on Exxon -- I actually admire them as a well-managed company and pretty much every large corporation has gotten caught up in this unproductive Fed-inspired game of borrowing at close to zero and buying back stock (to my mind the financial equivalent of the Keynesian digging of holes and filling them back in).  But I hope you can see the analogy with the position of governments and central bankers.   For the last 5 years, when economic times have been good (alright, maybe just OK) governments have been deficit spending like crazy and central banks have been expanding their balance sheets with programs like QE to keep the economy stimulated.  But just as with the situation at Exxon, when the bad times come, bankers are going to find themselves with far fewer options than they had in 2008.

PS:  This is what Exxon really should have been doing the last 5 years -- hoarding their cash and borrowing reserves to be able to buy assets like crazy on the cheap in the next downturn.  They have always been able to do this in past downturns.  I suspect it may not be possible this time.

Phoenix Light Rail: We Spent $1.4 Billion (and Growing) To Subsidize ASU Students

The AZ Republic has some of the first information I have ever seen on the nature of Phoenix light rail ridership.  The first part confirms what I have always said, that light rail's primary appeal is to middle and upper class whites who don't want to ride on the bus with the plebes

Light rail has changed the demographics of overall transit users since the system opened in 2008, according to Valley Metro.

Passengers report higher incomes than bus riders, with more than a quarter living in households making more than $50,000 a year. Many riders have cars they could use.

The 20-mile system running through Phoenix, Tempe and Mesa recorded more than than 14 million boardings last year. Still, census data estimate less than one-third of 1 percent of Phoenix commuters — or about 2,000 people — use rail as their main transportation to work.

.0033% huh?  If we built similar facilities to serve everyone, it would only cost us about $420 billion at the rate of $1.4 billion per third of a percent.

But I thought this next bit was the most startling.  I always had a sneaking suspicion this was true but never have seen it in print before:

While the much larger bus system reaches most corners of the Valley, light rail connects specific destinations along a single line. Nearly half of light-rail riders are enrolled in college.

I must have missed this in the original sales pitch for the light rail line: "Let's pay $1.4 billion so ASU students can get to more distant bars."   Note that by these numbers, students likely outnumber commuters 10:1.  Doesn't bode well for light rail extensions that don't plow right through the middle of the most populous college campus in the country.

Postscript:  They don't break out people riding to get to sporting events downtown, but sporting events make up most of the largest traffic days on the system.  From my personal acquaintances, many people use light rail as a substitute for expensive downtown parking at sporting events, parking (often semi-illegally) near light rail stops and taking the train the rest of the way in.  On the whole, its not very compelling as a taxpayer to be helping to subsidize someone else's parking.  And from a municipal fiscal standpoint, it means that light rail fares may be cannibalizing (on a much greater ratio than 1:1 given the price differential) parking fees at municipal parking lots.

I Have Been Wondering This Same Thing

In an article on an incipient bank run in Greece, Zero Hedge wonders, "What is perhaps more shocking is that anyone still had money in Greek banks at all..."  I agree.  With talk for weeks of capital controls and the example of raids on depositor funds (even supposedly insured deposits) in Cyprus, my money would have been long gone.  Even in the US in 2008-2010, I took our corporate funds out of the main Bank of America account and spread them all over.  It was a pain in the butt to manage but even facing much smaller risks than in Greece, I thought it was worth it.

Lack of Hotel is Not a Market Failure -- It Was a Market Success

For some reason, it appears that building hotels next to city convention centers is a honey pot for politicians.  I am not sure why, but my guess is that they spend hundreds of millions or billions on a convention center based on some visitation promises.  When those promises don't pan out, politicians blame it on the lack of a hotel, and then use public money for a hotel.  When that does not pan out, I am not sure what is next.  Probably a sports stadium.  Then light rail.  Then, ?  It just keeps going and going.

I thought we in Phoenix took some kind of prize with this:

The city-owned Sheraton Phoenix Downtown Hotel has lost so much money — more than $28.2 million total — that some city leaders say the hotel must be put in the hands of the private sector.

They also worry that the hotel, Arizona's largest with 1,000 rooms, could harm other projects in the downtown core.

When Phoenix leaders opened the Sheraton in 2008, they proclaimed it would be a cornerstone of downtown's comeback. They had one goal in mind: lure big conventions and tourism dollars. Officials argued the city needed the extra hotel beds to support its massive taxpayer-funded convention center a block away.

But apparently things are even worse in Baltimore:

The city-owned Hilton Baltimore convention center hotel lost $5.6 million last year — a worse performance than 2013 despite its close location to Camden Yards and the Orioles' playoff run.

It was the seventh consecutive year that the hotel has underperformed financially, according to an audit of financial statements presented Wednesday to the city's Board of Estimates. Under the deal's initial projections, the hotel was supposed to be making $7 million in profit by now — pumping that mone into the city's budget....

The hotel has lost more than $70 million since it opened.

I am sure that politicians in both cities called the lack of a hotel a market failure.  But now we see that it was a market success.  All the companies who chose not to build a hotel with private money obviously knew what they were doing, and only the political benefits of pandering the the public at large and a few special interests in specific made it seem like an attractive investment to city politicians.  Which is all pretty unsurprising, since hotels have pretty much been built off every exit ramp in this country, so there seems to be no private inhibition towards building hotels -- just towards building hotels in bad locations.

The Clinton Foundation Appears to Be A Terrible Charity

From the Federalist

Between 2009 and 2012, the Clinton Foundation raised over $500 million dollars according to a review of IRS documents by The Federalist (2012,2011, 2010, 2009, 2008). A measly 15 percent of that, or $75 million, went towards programmatic grants. More than $25 million went to fund travel expenses. Nearly $110 million went toward employee salaries and benefits. And a whopping $290 million during that period — nearly 60 percent of all money raised — was classified merely as “other expenses.”

Now it may be that the "other"expenses are directly benefiting someone but the numbers here are not encouraging.  There are a number of sham charities out there whose income goes mostly to supporting  the lifestyle of their directors and employees so that they can make good money but simultaneously be self-righteous.   I do not know that this is the case here but I think you can be pretty sure the reason they get most of their donations is to curry favor with the Clintons rather than because the organization is particularly efficient or adept at deploying charitable resources.

Q: What's The Difference Between GE and Enron? A: GE Got Bailed Out

I am going to oversimplify, but the essence of bank risk is that they borrow short-term and invest/lend long-term.   This is a money-making strategy in that one can often borrow short-term much cheaper than one can borrow long term.  This spread between long and short term rates is due to people valuing liquidity.  You probably have experienced it yourself when buying a certificate of deposit (CD).  The rates for 5 or 10 year CD's are higher, but do you really want to tie your money up for so long?  What if rates improve and you find yourself locked into a CD with lower rates?  What if you need the money for an emergency?  Your concern for having your money locked up is what a preference for liquidity means.

So banks live off this spread.   But there are risks, just like you understood there are risks to locking your money in a long-term CD.  Imagine the bank is lending for mortgages and AAA corporate customers at 6%.  To fund that, they have some shareholder money, which is a long-term investment.  But they make the rest up with things like deposits and commercial paper (essentially 90-day or shorter notes).  We will leave the Fed out for this.  There are two main risks

  1. Short term interest rates rise, such that the spread between their short term borrowing and long-term investments narrows, or even reverses to negative
  2. Worse, the short term money can just disappear.  In panics, as we saw in the last financial crisis, the commercial paper market essentially dries up and depositors withdraw their money at the first sign of trouble (this is mitigated for small depositors by deposit insurance but not for large depositors who are not 100% covered).

These risks are made worse when banks or bank-like institutions try to improve the spread they are earning by making riskier investments, thus increasing the spread between their borrowing and investing, but also increasing risk.  This is particularly so because these risky investments tend to go south at the same time that short-term credit markets dry up.  In fact, the two are closely related.

This is exactly what happened to GE.  Via MarketWatch:

GE’s news release announcing its latest and greatest reduction of GE Capital summed up the move beautifully, saying “the business model for large wholesale-funded financial companies has changed, making it increasingly difficult to generate acceptable returns going forward.”

“Wholesale-funded” refers to GE Capital’s traditional reliance on the commercial paper market for liquidity. The problem with this short-term funding model for a balance sheet with long-term assets is that during a financial crisis, overnight liquidity tends to dry up as it did for GE late in 2008. When the company had difficulty finding buyers for its paper, the Federal Deposit Insurance Corp. stepped in and through its Temporary Liquidity Guarantee Program (TLGP) was covering $21.8 billion of GE commercial paper. GE Capital registered for up to $126 billion in commercial-paper guarantees under the TLGP.

If you have a AAA credit rating, you can always, always make money in the good times borrowing short and investing long.  You can make even more money borrowing short and investing long and risky.  GE made their money in the good times, and then when the model absolutely inevitably fell on its face in the bad times, we taxpayers bailed them out.

Which leads me to think back to Enron.  Enron is associated in most people's minds with fraud, and Enron played a lot of funky accounting games to disguise its true financial position from its owners.  But at the end of the day, that fraud was not why it failed.  Enron failed because it was essentially a bank that was borrowing short and investing long.  When the liquidity crisis arrived and they couldn't borrow short any more, they went bankrupt.   Jeff Skilling didn't actually go to jail for accounting fraud, he went to jail for making potentially inaccurate positive statements to shareholders to try to head off the crisis of confidence (and the resulting liquidity crisis).  Something every CEO in history has done in a liquidity crisis (back in 2008 I wrote an article comparing Bear Stearns crash and the actions of its CEO to Enron's; two days later the Economist went into great depth on the same topic).

So the difference between GE and Enron?  The government bailed out GE by guaranteeing its commercial paper (thus solving its problem of access to short term funding) and did nothing for Enron.  Obviously the time and place and government officials involved differed, but I would also offer up two differences:

  • Few really understood what mad genius Jeff Skilling was doing at Enron (I can call him that because I actually worked with him briefly at McKinsey, which you can also take as a disclosure).  With Enron so opaque to outsiders, for which a lot of the blame has to be put on Enron managers for making it that way, it was far easier to ascribe its problems to fraud rather than the liquidity crisis that was well-understood at Bear or Lehman or GE.
  • Enron failed to convince the world it posed systematic risk, which in hindsight it did not.  GE and other big banks survived 2008 and got bailed out because they convinced the government they would take everyone down with them.  They followed the strategy of the Joker in The Dark Knight, who revealed to a hostile room a coat full of grenades with this finger ready to pull the pins if they didn't let him out alive.

TDK-joker-grenades


Artist's rendering of 2008 business strategy of GE Capital, Citicorp, Bank of America, Goldman Sachs, GMAC, etc.


Postscript:  For those not clicking through, I though this bit from the 2008 Economist article was pretty thought-provoking:

For many people, the mere fact of Enron's collapse is evidence that Mr Skilling and his old mentor and boss, Ken Lay, who died between hisconviction and sentencing, presided over a fraudulent house of cards. Yet Mr Skilling has always argued that Enron's collapse largely resulted from a loss of trust in the firm by its financial-market counterparties, who engaged in the equivalent of a bank run. Certainly, the amounts of money involved in the specific frauds identified at Enron were small compared to the amount of shareholder value that was ultimately destroyed when it plunged into bankruptcy.

Yet recent events in the financial markets add some weight to Mr Skilling's story"”though nobody is (yet) alleging the sort of fraudulentbehaviour on Wall Street that apparently took place at Enron. The hastily arranged purchase of Bear Stearns by JP Morgan Chase is the result of exactly such a bank run on the bank, as Bear's counterparties lost faith in it. This has seen the destruction of most of its roughly $20-billion market capitalisation since January 2007. By comparison, $65 billion was wiped out at Enron, and $190 billion at Citigroup since May 2007, as the credit crunch turned into a crisis in capitalism.

Mr Skilling's defence team unearthed another apparent inconsistency in Mr Fastow's testimony that resonates with today's events. As Enronentered its death spiral, Mr Lay held a meeting to reassure employees that the firm was still in good shape, and that its "liquidity was strong". The composite suggested that Mr Fastow "felt [Mr Lay's comment] was an overstatement" stemming from Mr Lay's need to "increase public confidence" in the firm.

The original FBI notes say that Mr Fastow thought the comment "fair". The jury found Mr Lay guilty of fraud at least partly because it believed the government's allegations that Mr Lay knew such bullish statements were false when he made them.

As recently as March 12th, Alan Schwartz, the chief executive of Bear Stearns, issued a statement responding to rumours that it was introuble, saying that "we don't see any pressure on our liquidity, let alone a liquidity crisis." Two days later, only an emergency credit line arranged by the Federal Reserve was keeping the investment bank alive. (Meanwhile, as its share price tumbled on rumours of trouble onMarch 17th, Lehman Brothers issued a statement confirming that its "liquidity is very strong.")

Although it can do nothing for Mr Lay, the fate of Bear Stearns illustrates how fast quickly a firm's prospects can go from promising to non-existent when counterparties lose confidence in it. The rapid loss of market value so soon after a bullish comment from a chief executive may, judging by one reading of Enron's experience, get prosecutorial juices going, should the financial crisis get so bad that the public demands locking up some prominent Wall Streeters.

Our securities laws are written to protect shareholders and rightly take a dim view of CEO's make false statements about the condition of a company.  But if you owned stock in a company facing such a crisis, what would you want your CEO saying?  "Everything is fine, nothing to see here" or "We're toast, call Blackstone to pick up the carcass"?

What Is It About California Shepherds?

I saw this by accident on the California FAQ on the state minimum wage.

1. Q. What is the minimum wage?
A. Effective January 1, 2008, the minimum wage in California is $8.00 per hour. It will increase to $9.00 per hour effective July 1, 2014, and to $10.00 per hour effective January 1, 2016.

For sheepherders, however, effective July 1, 2002, the minimum wage was set at $1,200.00 per month. On January 1, 2007, this wage increased to a minimum monthly salary of $1,333.20, and on January 1, 2008, it increased again to a minimum monthly salary of $1,422.52. Effective July 1, 2014, the minimum monthly salary for sheepherders will be $1600.34. Effective January 1, 2016, the minimum monthly salary for sheepherders will be $1777.98. Wages paid to sheepherders may not be offset by meals or lodging provided by the employer. Instead, there are provisions in IWC Order 14-2007, Sections 10(F), (G) and (H) that apply to sheepherders with respect to monthly meal and lodging benefits required to be provided by the employer.


What the hell?  The new minimum wage is absolutely appropriate to every industry in California except sheepherding?  It would be interesting to see the political process that led to this one narrow special rule.  The state Speaker of the House's brother-in-law is probably in the sheep business.

This kind of crap is frustrating as hell for me.  We have a labor model that is generally not even considered when politicians are setting labor law, and thus compliance causes us fits.  I would love special labor exemptions for my workers as well, but I don't have any pull in Sacramento.

Postscript:  While most folks think of the minimum wage as a restriction on employers, it is just as much a restriction on workers as well.  I am glad to see the California site acknowledge this:

3. Q. May an employee agree to work for less than the minimum wage?
A. No.

There Seems to Be No Limit to Politicians' Hypocrisy

Obama, 2008:  "I taught constitutional law for ten years. I take the Constitution very seriously. The biggest problems that we're facing right now have to do with George Bush trying to bring more and more power into the executive branch and not go through Congress at all, and that's what I intend to reverse when I'm president of the United States of America." (Townhall in Lancaster, Pennsylvania, March 31, 2008).

They all suck.  Every one of them.  This man was the great hope of more than half the nation and look what a loser he is.  We should stop talking about whether we are going to hand power to the Coke or the Pepsi party and start talking about limiting the power of these jerks.

Congratulations to Nature Magazine for Catching up to Bloggers

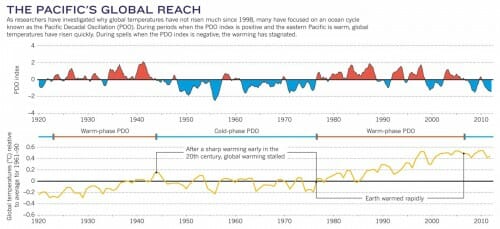
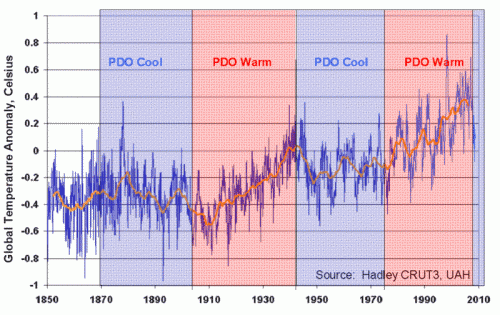
The journal Nature has finally caught up to the fact that ocean cycles may influence global surface temperature trends.  Climate alarmists refused to acknowledge this when temperatures were rising and the cycles were in their warm phase, but now are grasping at these cycles for an explanation of the 15+ year hiatus in warming as a way to avoid abandoning high climate sensitivity assumptions  (ie the sensitivity of global temperatures to CO2 concentrations, which IMO are exaggerated by implausible assumptions of positive feedback).

Here is the chart from Nature:

click to enlarge


I cannot find my first use of this chart, but here is a version I was using over 5 years ago.  I know I was using it long before that

click to enlarge


It will be interesting to see if they find a way to blame cycles for cooling in the last 10-15 years but not for the warming in the 80's and 90's.

Next step -- alarmists have the same epiphany about the sun, and blame non-warming on a low solar cycle without simultaneously giving previous high solar cycles any credit for warming.  For Nature's benefit, here is another chart they might use (from the same 2008 blog post).  The number 50 below is selected arbitrarily, but does a good job of highlighting solar activity in the second half of the 20th century vs. the first half.

click to enlarge


Explaining the Flaw in Kevin Drum's (and Apparently Science Magazine's) Climate Chart

I won't repeat the analysis, you need to see it here.  Here is the chart in question:

la-sci-climate-warming

My argument is that the smoothing and relatively low sampling intervals in the early data very likely mask variations similar to what we are seeing in the last 100 years -- ie they greatly exaggerate the smoothness of history and create a false impression that recent temperature changes are unprecedented (also the grey range bands are self-evidently garbage, but that is another story).

Drum's response was that "it was published in Science."  Apparently, this sort of appeal to authority is what passes for data analysis in the climate world.

Well, maybe I did not explain the issue well.  So I found a political analysis that may help Kevin Drum see the problem.  This is from an actual blog post by Dave Manuel (this seems to be such a common data analysis fallacy that I found an example on the first page of my first Google search).  It is an analysis of average GDP growth by President.  I don't know this Dave Manuel guy and can't comment on the data quality, but let's assume the data is correct for a moment.  Quoting from his post:

Here are the individual performances of each president since 1948:

1948-1952 (Harry S. Truman, Democrat), +4.82%

1953-1960 (Dwight D. Eisenhower, Republican), +3%

1961-1964 (John F. Kennedy / Lyndon B. Johnson, Democrat), +4.65%

1965-1968 (Lyndon B. Johnson, Democrat), +5.05%

1969-1972 (Richard Nixon, Republican), +3%

1973-1976 (Richard Nixon / Gerald Ford, Republican), +2.6%

1977-1980 (Jimmy Carter, Democrat), +3.25%

1981-1988 (Ronald Reagan, Republican), 3.4%

1989-1992 (George H. W. Bush, Republican), 2.17%

1993-2000 (Bill Clinton, Democrat), 3.88%

2001-2008 (George W. Bush, Republican), +2.09%

2009 (Barack Obama, Democrat), -2.6%

Let's put this data in a chart:

click to enlarge


Look, a hockey stick , right?   Obama is the worst, right?

In fact there is a big problem with this analysis, even if the data is correct.  And I bet Kevin Drum can get it right away, even though it is the exact same problem as on his climate chart.

The problem is that a single year of Obama's is compared to four or eight years for other presidents.  These earlier presidents may well have had individual down economic years - in fact, Reagan's first year was almost certainly a down year for GDP.  But that kind of volatility is masked because the data points for the other presidents represent much more time, effectively smoothing variability.

Now, this chart has a difference in sampling frequency of 4-8x between the previous presidents and Obama.  This made a huge difference here, but it is a trivial difference compared to the 1 million times greater sampling frequency of modern temperature data vs. historical data obtained by looking at proxies (such as ice cores and tree rings).  And, unlike this chart, the method of sampling is very different across time with temperature - thermometers today are far more reliable and linear measurement devices than trees or ice.  In our GDP example, this problem roughly equates to trying to compare the GDP under Obama (with all the economic data we collate today) to, say, the economic growth rate under Henry the VIII.  Or perhaps under Ramses II.   If I showed that GDP growth in a single month under Obama was less than the average over 66 years under Ramses II, and tried to draw some conclusion from that, I think someone might challenge my analysis.  Unless of course it appears in Science, then it must be beyond question.

The Real Health Insurance Shock Is Coming Next Fall

Obviously, the whole Obamacare implementation is in disarray.  Some of this I expected -- the policy cancellations -- and some of it I did not -- the horrendous systems implementation.  But I actually thought that most of this would be swept under the rug by a willing media.

What I really expected was for the true shock to come next fall.  And I think it is still coming.  I believe that despite rate increases, insurers are likely being overly optimistic about how much adverse selection and cost control issues they are going to have.  As a result, I expected, and still expect, huge premium increases in the fall of 2014.

Why?  The main benefit of Obamacare is for people who cannot afford health insurance but want it, and for people who are very sick and have lost their insurance.   Obamacare is a terrible plan as implemented because it futzes with virtually everything in the health care system when a more limited plan could have achieved the same humanitarian coverage goals.

Anyway, one reason Obamacare is so comprehensive is that it is based on a goal of cost control for the whole system.  Unfortunately, most all of its cost control goals are faulty.  From Megan McArdle, in an amazing article covering a huge range of Obamacare issues:

But I think it’s also clearly true that the majority of the public did not understand this. In 2008, the Barack Obama campaign told them that their premiums would go down under the new health-care law. And the law’s supporters believed it.

Q. Obama says his plan will save $2,500 annually for my family. How?

A. Through a combination of developing efficiencies in the system, expanding coverage to all Americans, and picking up the cost of some high-cost cases. Specifically:

-- Health IT investment, which will reduce unnecessary and wasteful spending in the health care system. Examples include extra hospital stays because of preventable medical errors and duplicative diagnostic tests;

-- Improving prevention and management of chronic conditions;

-- Increasing insurance industry competition and reining in the abusive practices of monopoly insurance and drug companies;

-- Providing reinsurance for catastrophic cases, which will reduce insurance premiums; and

-- Ensuring every American has health coverage, which will reduce spending on the “uncompensated” care of uninsured people who end up in emergency rooms and whose care is picked up by institutions and then passed through higher charges to insured individuals.

The part about reinsurance was always nonsense; unless it’s subsidized, reinsurance doesn’t save money for the system, though it may reduce the risk that an individual company will go broke. But the rest of it all sounded entirely plausible; I heard many smart wonks make most of these arguments in 2008 and 2009. However, it’s fair to say that by the time the law passed, the debate had pretty well established that few to none of them were true. “We all knew” that preventive care doesn’t save money, electronic medical records don’t save money, reducing uncompensated care saves very little money, and “reining in the abusive practices” of insurance companies was likely to raise premiums, not lower them, because those “abuses” mostly consist of refusing to cover very sick people.

The result?  Many of these things that supposedly reduced costs actually increase them.  So if you think the shock is high now, wait until next fall.  We will see:

  • Rates going up
  • Less choice, as insurers pull out of many local markets
  • Narrowing of doctors networks, and reduced choice in doctors
  • Companies dropping health care and dumping workers (and retirees if they can get away with it) into the exchanges and Medicare.

Deceptive Chart of the Day from Kevin Drum and Mother Jones to Desperately Sell the "Austerity" Hypothesis

Update:  OK, I pulled together the data and did what Drum should have done, is take the graph back to pre-recession levels.  Shouldn't it be even better if the increase in spending came during the recession rather than after?  See update here.

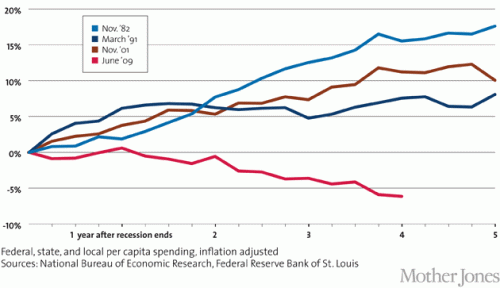
Kevin Drum complains about US government austerity (I know, I know, only some cocooned progressive could describe recent history as austerity, but let's deal with his argument).  He uses this chart to "prove" that we have been austere vs. other recessions, and thus austerity helps explain why recovery from this recession has been particularly slow.  Here is his chart

Austerity_2_WM_630

This is absurdly disingenuous.  Why?  Simple -- it is impossible to evaluate post recession spending without looking at what spending did during the recession.   All these numbers begin after the recession is over.  But what if, in the current recession, we increased spending much more than in other recessions.  We would still be at a higher level vs. pre-recession spending now, despite a lack of further increases after the recession.

In the time before this chart even starts, total state, local, Federal spending increased from 2007 to 2008 by 10.2%.  It increased another 11.1 % from 2008 to 2009.  So he starts the chart at the peak, only AFTER spending had increased in response to the recession by 22.5%.  Had he started the chart at the correct date and not at a self-serving one, my guess is that it would have shown that in this recession we increased spending more than any other recent recession, not less.  So went digging for some data.

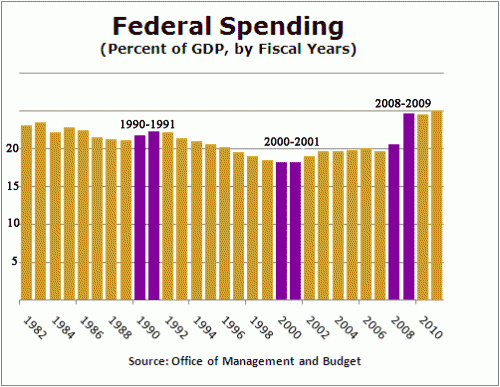
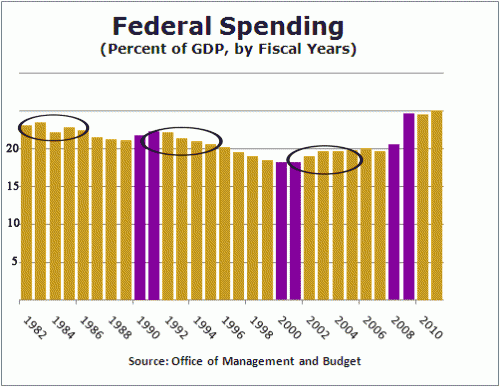
I actually have a day job, so I don't have time to create a chart of total government spending since 1981, so I will look at just Federal spending, but it makes my point.  I scavenged this chart from Factcheck.org.  The purple bars are the year that each of Drum's data series begin plus the year prior (which is excluded from Drum's chart).  Essentially the growth in spending between the two purple lines is the growth left out just ahead of when Drum started each data series in his chart.  The chart did not go back to 1981 so I could not do that year.

click to enlarge

Hopefully, you can see why I say that Drum is disingenuous for not going back to pre-recession numbers.  In this case, you can see the current recession has an unprecedented pop in spending in the year before Drum starts his data series, so it is not surprising that post recession spending might be flatter (remember, the pairs of purple lines are essentially the change in spending the year before each of Drum's data series).  In fact, it is very clear that relative to the pre-recession year of 2008 (really 2007, but I will give him a small break), even after 5 years of "austerity" our federal spending as a percent of GDP will be far higher than in any other recession he considers.  In no previous recession in this era did post recession spending end up more than 2 points higher (as a percent of GDP) than pre-recession levels.    In this recession, we are likely to end up 4-5 points higher.

By the way, isn't it possible that he has cause and effect reversed?  He argues that post-recession recovery was faster in other recessions because government spending kept increasing over five years after the recession is over.  But isn't it just possible that the truth is the reverse -- that government spending increased more rapidly after other recessions because recovery was faster, thus increasing tax revenues. Congress then promptly spent the new revenues on new toys.

Let's look at the same chart, highlighted in a different way.  I will circle the 4-5 years included in each of Drum's data series:

spending-2

You can see that despite the fact that government spending in these prior recessions was increasing in real terms, it was falling in two our of three of them as a percentage of GDP (the third increased due to war spending in Afghanistan and Iraq, spending which I, and I suspect Drum, would hesitate to call stimulative, particular since he and others at the time called it a jobless recovery).

How can it be that spending was increasing but falling as a percent of GDP?  Because the GDP was growing really fast, faster than government spending.  This does not prove my point, but is a good indicator that recovery is likely leading spending increases, rather than the other way around.

Absolute Fecklessness

I am still reading through the Detroit Free Press report on Detroit's financial history and it is really amazing.  All the stuff you expect to see is there -- over taxation, over regulation, crony gifts, huge government pay and pensions, etc.  But this was new to me, and even worse than I expected:

Gifting a billion in bonuses: Pension officials handed out about $1 billion in bonuses from the city’s two pension funds to retirees and active city workers from 1985 to 2008. That money — mostly in the form of so-called 13th checks — could have shored up the funds and possibly prevented the city from filing for bankruptcy. If that money had been saved, it would have been worth more than $1.9 billion today to the city and pension funds, by one expert’s estimate.

Outright gifts of taxpayer money to government workers, even beyond their already rich salary and pensions!  Folks on the Left from Paul Krugman to Obama are trying to portray Detroit as the innocent victim of economic and demographic exogenous forces beyond their control.  Don't let them.  The exodus from Detroit and the destruction of its economy were not random events the city had to endure, but self-inflicted wounds.

Keynesian Multiplier of 0.05

So much for that Keynesian stimulus notion (emphasis in the original)

With everyone focused on the 5th anniversary of the Lehman failure, we are taking a quick look at how the world's developed (G7) nations have fared since 2008, and just what the cost to restore "stability" has been. In a nutshell: the G7 have added around $18tn of consolidated debt to a record $140 trillion, relative to only $1tn of nominal GDP activity and nearly $5tn of G7 central bank balance sheet expansion (Fed+BoJ+BoE+ECB). In other words, over the past five years in the developed world, it took $18 dollars of debt (of which 28% was provided by central banks) to generate $1 of growth. For all talk of "deleveraging" G7 consolidated debt has been at a record high 440% for the past four years.

The theory of stimulus -- taking money out of the productive economy, where it is spent based on the information of hundreds of millions of people as to the relative value of millions of potential investments, and handing it to the government to spend based on political calculus -- never made a lick of sense to me.  I guess I would have assumed the multiplier in the short term was fractional but at least close to one, indicating in the short run that if we borrow and dump the money into the economy we would get some short-term growth, only to have to pay the piper later.  But we are not even seeing this.

New Feature Here: Trend That Is Not A Trend

Some have asked me why I have not updated my climate blog in a while.  Frankly, the climate debate has become like the movie Groundhog Day, with the same handful of scientists releasing the same flawed studies making the same mistakes.  What used to be exciting is frankly boring.  I still blog here on updated climate news, and perhaps the IPCC will give us new things to write about soon, but for now most of my climate work will just be making appearances and presentations  (let me know if you have a large group, I don't charge any sort of fee).

For a while now I have been contemplating a new focus area, perhaps even a new blog.  I call this new focus "trend that is not a trend."  It refers to the tendency I find in the media to cite a trend without any supporting data, sometimes even when the actual trend in the data turns out to have the opposite sign.  Sometimes the reporter is motivated by conventional wisdom, sometimes by passion in advocating for a certain issue, and sometimes they are fooled by their own coverage, mistaking increases in coverage of a phenomenon for increases in the phenomenon itself (for example, this year everyone believes wildfires are up, when in fact this is a very low year).  We get a lot of this type of thing in climate, so it will give me a chance to continue to blog on climate but from a slightly different angle.

The best way to explain the phenomenon is with an example, and the Arizona Republic presented me with a great one today, in the form of an article by Joan Lowy of the Associated Press.  This in an article that reads more like an editorial than a news story.  It is about the Federal requirement for railroads to put safety electronics called Positive Train Control (PTC) on trains by a certain date.  The author has a pretty clear narrative that this is an absolutely critical piece of equipment for the public good, and that railroads are using scheming and lobbying to unfairly delay and dilute this critical mandate (seriously, I am not exaggerating the tone, you can read it for yourself.)

My point, however, is not to challenge the basic premise of the article, but to address this statement in her opening paragraph (emphasis added).

Despite a rash of deadly train crashes, the railroad industry’s allies in Congress are trying to push back the deadline for installing technology to prevent the most catastrophic types of collisions until at least 2020, half a century after accident investigators first called for such safety measures.

The reporter is claiming a "rash of deadly train crashes"  -- in other words, she is saying, or at least implying, that there is an upward trend in deadly train crashes.  So let's ask ourselves if this claimed trend actually exists.  She says it so baldly, right there in the first seven words, that surely it must be true, right?

Here is the only data she cites:

The National Transportation Safety Board has investigated 27 train crashes that took 63 lives, injured nearly 1,200 and caused millions of dollars in damage over the past decade that officials say could have been prevented had the safety system been in place.

Astute readers will note that this is not a trend, it is one data point.   Has the number increased or decreased over the decade?  For comparable decades, are 27 crashes and 63 deaths a lot or a little?  Is it a "rash", or a tapering off?  We have no idea.   As we get further into this series, readers will be surprised at how often the media uses single data points to "prove" a trend.

The only other evidence we get of a "rash" are three examples:

  • The July high speed rail accident in Spain, which killed scores of people.  Of course, readers may note that she actually had to go to another country for her first example, an example involving high-speed passenger rail which has very little in common with private railroads in the US.
  • A 2008 crash blamed on inattention of a Metrolink driver -- a government employee on a government train, which sort of undermines the basic thrust of the story that this is about evil private railroads using lobbying to endanger the public.  Few readers are likely to consider a 2008 crash to constitute a recent "rash."
  • A 2005 crash at a private freight railroad that killed 9 people from a chlorine gas leak.  Fewer readers are likely to consider a 2005 crash to constitute a recent "rash".

So let's go to the data.  It is actually very easy to find, and I would be surprised if Ms. Lowy did not actually have this data in her hands.  It is at the Federal Railway Administration Office of Safety Analysis.  2013 data is only current through June and seems to be set up on an October -September fiscal year.  So I ran the data only for October-June of every year to make sure the results were comparable to 2013.  Each year in the data below is actually 9 months of data.

By the way, when one is looking at railroad fatalities, one needs to understand that railroads do kill a lot of people every year, but the vast, vast majority of these -- 99% or more -- are killed at grade crossings.  People still do not understand that a freight train takes miles to stop.  (see postscript below, but as an aside, I would be willing to make a bet: Since deaths at grade crossings outnumber deaths from collisions by about 100:1, I would be willing to bet any amount of money that I could take the capital the author wants railroads to invest in PTC and save far more lives by investing it in grade crossing protection.  People like Ms. Lowy who advocate for these regulations never, ever seem to consider prioritization and tradeoffs.)

Anyway, looking at the data, here is the data for people killed each year in US railroad accidents (as usual click to enlarge any of the charts):

click to enlarge

So, rather than a "rash", we have just the opposite -- the lowest number of deaths in a decade.  One.  I will admit that technically she said rash of "fatal accidents" and this is data on fatalities, but I'm going to make a reasonable assumption that one death means one fatal accident -- which certainly cannot be higher than the number of fatal accidents in previous years and is likely lower.

Most of you will agree that this makes the author's opening statement a joke.  Believe it or not -- and this happens a surprising number of times -- this journalist is claiming a trend that not only does not exist, but is of the opposite sign.  But let's go further with a few other charts.  Maybe we just got lucky and there is a rash of accidents but just not fatal ones:

click to enlarge

Not only is there not a "rash" but the number of accidents have actually been cut in half.   But let's give the author one last try at a benefit of the doubt.  She says the technology she is advocating reduces human error caused accidents.  The FRA actually tracks these separately.  I wonder what that trend is?

click to enlarge

LOL, if anything it declines more.    The only thing I can possibly find in her favor is that number of train accident injuries spiked in 2013 after 10 years of declining, but since fatalities and accidents went down, the odds are this is a statistical anomaly and not part of any trend.

Postscript:  To my point above, 1 person died from train accidents in the last 9 months or so.  We don't know why or how they died, but let's just say it was preventable by PTC.  The author is therefore castigating railroads for not racing ahead with hundreds of millions to prevent one death, when the railroads know their chief focus for reducing preventable deaths should be on the 588 other people who died on the railroad in the same period, mainly from grade crossing and trespasser/pedestrian accidents.

Do Reporters Even Look At Their Own Charts?

A Wall Street Journal article today looks at problems at Sears in their critical appliance business.  I have no problem believing that Sears is in trouble, and at various times over the past decade (full disclosure here) have held small short positions in Sears.  The author argues that the Sears appliance business has had a number of missteps, and is contributing to Sears growing losses, propositions with which I cannot argue, in part because there is no data provided to confirm or deny the connection between problems in the appliance business and Sears' profitability woes.

The other theme of the article is that recent missteps in the appliance business, particularly the 2009 switch from Whirlpool to Samsung and LG to manufacture its in-house Kenmore brand, is hurting its market share in the retail appliance business, and leading the the growth in market share at Home Depot and Loews.   But the author's own data belie this conclusion.  Here is the market share chart she includes:

MK-CF765_SEARS_G_20130822175404


While Sears may have lost a couple of points of market share since 2008, and 2013 does not look like a particularly good year so far, the vast majority of its market share loss occurred from 2002-2008, long before most of the recent problems profiled in the article.  In fact, its more likely that the loss coincided with Sears reorganization with Kmart a decade ago, events referred to only briefly in the article.

Look, I have no insider knowledge here, just a pet peeve that trends referenced in an article should match trends in the data.  But Sears is a tired old retailer.  Many of its peers from the same era are dying or dead.  People are shifting their shopping away from the malls where Sears is located.  Lowes and Home Depot were both juggernauts during this period.  I would have said that a story could equally well have been written that despite all the confusion in their business, they have done a pretty descent job arresting the decline in their market share over the last five years.  Of course they are likely dead in the long run.

Postscript:  Oddly, I witnessed a similar Sears private label fracas when I worked for Emerson Electric over a decade ago.  For years and years, Emerson (not the folks who make the cheap radios and TVs) manufactured many of the Sears Craftsman hand tools and power tools.  Sears got tough one year, and negotiated a better deal of some sort with someone else, and an entire division of Emerson saw its sales basically going to zero.  So Emerson bought a bunch of orange paint and plastic, went to Home Depot, and cut a deal for a private label tool line at Home Depot (Emerson separately owns the Rigid tool company, so a lot of the items were branded Rigid).  Emerson ended up in potentially better shape (I did not stay long enough to see how it turned out), partnered with a growing rather than a declining franchise.