Posts tagged ‘GPS’

Accountability for Police and Why Its So Hard

The other day, in writing about how I think Black Lives Matter has lost its way, I said that I supported their goal of increasing accountability of police forces but that goal was going to take a lot of hard, nuts-and-bolts legislative and policy steps that BLM seems uninterested in pursuing.  This article from Reuters (via link from Overlawyered) gives one an idea of some of the issues that exist:

The episode is a telling snapshot of the power police unions flex across the United States, using political might to cement contracts that often provide a shield of protection to officers accused of misdeeds and erect barriers to residents complaining of abuse.

From city to city, union contracts have become just as crucial in governing departments as police manuals and city charters. Yet those contracts are coming under scrutiny amid civil rights protests over alleged police abuses, including shootings of unarmed black subjects.

Reuters, examining the fine print of 82 police union contracts in large cities across the country, found a pattern of protections afforded the men and women in blue:

• A majority of the contracts call for departments to erase disciplinary records, some after just six months, making it difficult to fire officers with a history of abuses. In 18 cities, suspensions are erased in three years or less. In Anchorage, Alaska, suspensions, demotions and disciplinary transfers are removed after two years.

• Nearly half of the contracts allow officers accused of misconduct to access the entire investigative file – including witness statements, GPS readouts, photos, videos and notes from the internal investigation – before being interrogated.

• Twenty cities, including San Antonio, allow officers accused of misconduct to forfeit sick leave or holiday and vacation time rather than serve suspensions.

• Eighteen cities require an officer’s written consent before the department publicly releases documents involving prior discipline or internal investigations.

• Contracts in 17 cities set time limits for citizens to file complaints about police officers – some as short as 30 days. Nine cities restrict anonymous complaints from being investigated.

Police and their supporters will say that Police have a particularly dangerous job and need such extra process protections.  In fact, while there are dangers, it is certainly not among the most dangerous jobs (trash collectors are twice as likely to die on the job than police).  I would argue that we give the police unique powers -- to use violence and to take away a persons liberty -- not possessed by any other citizens and thus we should expect more rather than fewer accountability provisions to go with these special powers.

I will say that I am not particularly optimistic about progress in this area.  The Right tends to fetishize police and are tend to oppose any restrictions on police.  The Left is the natural home for police reform, but most on the Left are loath to take on public employee unions, probably their strongest base of political power, and most of these changes (as seen above) require challenging the police unions.  Black Lives Matter brought a lot of focus to these issues, but they simply can't seem to get past disruption and into policy changes and legislation, and besides the group appears to have been hijacked by the Left to be a vehicle for generic protests of Progressive causes like climate change legislation.

On The Steven Goddard Claim of "Fabricated" Temperature Data

Steven Goddard of the Real Science blog has a study that claims that US real temperature data is being replaced by fabricated data.  Christopher Booker has a sympathetic overview of the claims.

I believe that there is both wheat and chaff in this claim, and I would like to try to separate the two as best I can.  I don't have time to write a well-organized article, so here is just a list of thoughts

  1. At some level it is surprising that this is suddenly news.  Skeptics have criticized the adjustments in the surface temperature database for years
  2. There is certainly a signal to noise ratio issue here that mainstream climate scientists have always seemed insufficiently concerned about.  Specifically, the raw data for US temperatures is mostly flat, such that the manual adjustments to the temperature data set are about equal in magnitude to the total warming signal.  When the entire signal one is trying to measure is equal to the manual adjustments one is making to measurements, it probably makes sense to put a LOT of scrutiny on the adjustments.  (This is a post from 7 years ago discussing these adjustments.  Note that these adjustments are less than current ones in the data base as they have been increased, though I cannot find a similar chart any more from the NOAA discussing the adjustments)
  3. The NOAA HAS made adjustments to US temperature data over the last few years that has increased the apparent warming trend.  These changes in adjustments have not been well-explained.  In fact, they have not really be explained at all, and have only been detected by skeptics who happened to archive old NOAA charts and created comparisons like the one below.  Here is the before and after animation (pre-2000 NOAA US temperature history vs. post-2000).  History has been cooled and modern temperatures have been warmed from where they were being shown previously by the NOAA.  This does not mean the current version  is wrong, but since the entire US warming signal was effectively created by these changes, it is not unreasonable to act for a detailed reconciliation (particularly when those folks preparing the chart all believe that temperatures are going up, so would be predisposed to treating a flat temperature chart like the earlier version as wrong and in need of correction.
    1998changesannotated
  4. However, manual adjustments are not, as some skeptics seem to argue, wrong or biased in all cases.  There are real reasons for manual adjustments to data -- for example, if GPS signal data was not adjusted for relativistic effects, the position data would quickly get out of whack.  In the case of temperature data:
    • Data is adjusted for shifts in the start/end time for a day of measurement away from local midnight (ie if you average 24 hours starting and stopping at noon).  This is called Time of Observation or TOBS.  When I first encountered this, I was just sure it had to be BS.  For a month of data, you are only shifting the data set by 12 hours or about 1/60 of the month.  Fortunately for my self-respect, before I embarrassed myself I created a spreadsheet to monte carlo some temperature data and play around with this issue.  I convinced myself the Time of Observation adjustment is valid in theory, though I have no way to validate its magnitude  (one of the problems with all of these adjustments is that NOAA and other data authorities do not release the source code or raw data to show how they come up with these adjustments).   I do think it is valid in science to question a finding, even without proof that it is wrong, when the authors of the finding refuse to share replication data.  Steven Goddard, by the way, believes time of observation adjustments are exaggerated and do not follow NOAA's own specification.
    • Stations move over time.  A simple example is if it is on the roof of a building and that building is demolished, it has to move somewhere else.  In an extreme example the station might move to a new altitude or a slightly different micro-climate.  There are adjustments in the data base for these sort of changes.  Skeptics have occasionally challenged these, but I have no reason to believe that the authors are not using best efforts to correct for these effects (though again the authors of these adjustments bring criticism on themselves for not sharing replication data).
    • The technology the station uses for measurement changes (e.g. thermometers to electronic devices, one type of electronic device to another, etc.)   These measurement technologies sometimes have known biases.  Correcting for such biases is perfectly reasonable  (though a frustrated skeptic could argue that the government is diligent in correcting for new cooling biases but seldom corrects for warming biases, such as in the switch from bucket to water intake measurement of sea surface temperatures).
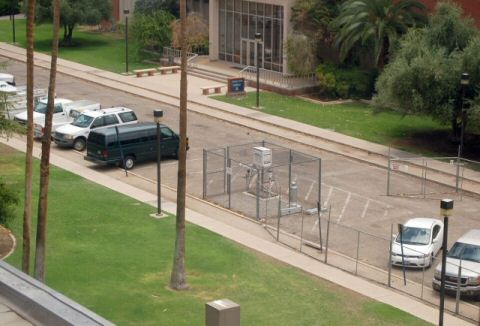
    • Even if the temperature station does not move, the location can degrade.  The clearest example is a measurement point that once was in the country but has been engulfed by development  (here is one example -- this at one time was the USHCN measurement point with the most warming since 1900, but it was located in an open field in 1900 and ended up in an asphalt parking lot in the middle of Tucson.)   Since urban heat islands can add as much as 10 degrees F to nighttime temperatures, this can create a warming signal over time that is related to a particular location, and not the climate as a whole.  The effect is undeniable -- my son easily measured it in a science fair project.  The effect it has on temperature measurement is hotly debated between warmists and skeptics.  Al Gore originally argued that there was no bias because all measurement points were in parks, which led Anthony Watts to pursue the surface station project where every USHCN station was photographed and documented.  The net results was that most of the sites were pretty poor.  Whatever the case, there is almost no correction in the official measurement numbers for urban heat island effects, and in fact last time I looked at it the adjustment went the other way, implying urban heat islands have become less of an issue since 1930.  The folks who put together the indexes argue that they have smoothing algorithms that find and remove these biases.  Skeptics argue that they just smear the bias around over multiple stations.  The debate continues.
  5. Overall, many mainstream skeptics believe that actual surface warming in the US and the world has been about half what is shown in traditional indices, an amount that is then exaggerated by poorly crafted adjustments and uncorrected heat island effects.  But note that almost no skeptic I know believes that the Earth has not actually warmed over the last 100 years.  Further, warming since about 1980 is hard to deny because we have a second, independent way to measure global temperatures in satellites.  These devices may have their own issues, but they are not subject to urban heat biases or location biases and further actually measure most of the Earth's surface, rather than just individual points that are sometimes scores or hundreds of miles apart.  This independent method of measurement has shown undoubted warming since 1979, though not since the late 1990's.
  6. As is usual in such debates, I find words like "fabrication", "lies",  and "myth" to be less than helpful.  People can be totally wrong, and refuse to confront their biases, without being evil or nefarious.

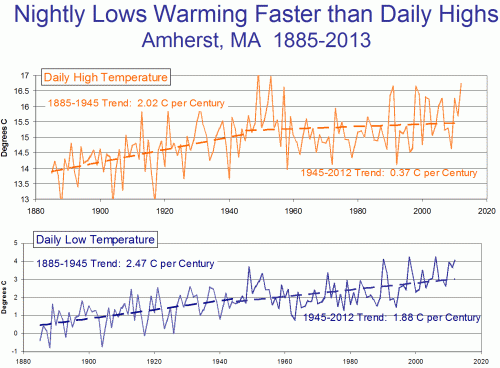
Postscript:  Not exactly on topic, but one thing that is never, ever mentioned in the press but is generally true about temperature trends -- almost all of the warming we have seen is in nighttime temperatures, rather than day time.  Here is an example from Amherst, MA (because I just presented up there).  This is one reason why, despite claims in the media, we are not hitting any more all time daytime highs than we would expect from a normal distribution.  If you look at temperature stations for which we have 80+ years of data, fewer than 10% of the 100-year highs were set in the last 10 years.  We are setting an unusual number of records for high low temperature, if that makes sense.

click to enlarge


He Who Has Two Clocks is Never Sure

I had no idea there were so many time standards

We already have way too many time standards, including:

  • TAI, time based on an atomic clock, which ignores all motion of the Earth
  • UT0 and UT1, time based on precise measurement of the Earth’s rotation
  • GPS, the time standard used by GPS satellites
  • UTC, the standard used in computing, which is like TAI but with leap seconds to keep it in sync with Earth
  • TDTTBTTCB, and TCG, which are all even worse

This leads to all kinds of little headaches, particularly for programmers. For example, the clock in your smartphone’s GPS is 16 seconds out of sync with the phone’s system clock. This is because the system clock uses Coordinated Universal Time (which has leap seconds), but GPS time doesn’t. They were in sync in January of 1980 and probably never will be again.

When Bad Things Happen to Well-Intentioned Legislation

My Forbes article is up for this week, and discusses 10 reasons why legislation frequently fails.  A buffet of Austrian economics, Bastiat, and public choice theory that I wrote for the high school economics class I teach each year.

Here is an example:

3.  Overriding Price Signals

The importance of prices is frequently underestimated.  Prices are the primary means by which literally billions of people (most of whom will never meet or even know of each others' existence) coordinate their actions, without any top-down planning.  With rising oil prices, for example, consumers around the world are telling oil companies:  "Go find more!"

For a business person, prices (of raw materials, labor, their products, and competitive products) are his or her primary navigation system, like the compass of an explorer or the GPS of a ship.  And just as disaster could well result from corrupting the readings of the explorer's compass while he is trekking across the Amazon, so too economic damage can result from government overriding price signals in the market.   Messing with the pricing mechanisms of markets turns the economy into a hall of mirrors that is almost impossible to navigate.  For example:

  • In the best case, corrupting market prices tends to result in gluts or shortages of individual products.  For example, price floors on labor (minimum wages) have created a huge glut of young and unskilled workers unable to find work.  On the other side, in the 1970s, caps on oil prices resulted in huge shortages in the US and those famous lines at gas stations.  These shortages and gas lines were repeated several times in the 1970's, but never have returned since the price caps were phased out.
  • In the worst case, overriding market price mechanisms can create enormous problems for the entire economy.   For example, it is quite likely that the artificially low interest rates promoted by the Federal Reserve over the last decade and higher housing prices driven by a myriad of US laws, organizations, and tax subsidies helped to drive the recent housing and financial bubble and subsequent crash.  Many will counter that it was the exuberance of private bankers that drove the bubble, but many bankers were like ship captains who drove their ships onto the rocks because their GPS signal had been altered

Fourth Amendment Win

Licensing Has Nothing to Do With Consumer Protection

Yeah, I know, this is volume one hundred and something in a series, but it is such a crystal clear example of government licensing working primarily to protect incumbent competitors in an industry I have to share it.

Suppose you’re the owner of a taxicab company in a largish metropolitan area. One day you notice some taxis tooling around town—and they’re not yours. They belong to an upstart competitor. His cars are newer, his drivers are nicer, and his fares are lower. Pretty soon your profits start shrinking. What are you going to do about it?

You have a couple of choices. Option A: Invest a lot of money in new vehicles, customer-service training for your drivers, GPS systems to map faster routes and so on. A lot of expense. A lot of effort.

So you go for Option B: Invest a little money in a few politicians, who adopt a medallion law: Only licensed operators with city-issued taxi medallions may operate cabs. The oldest cab companies get first dibs on the medallions, at the lowest rates. Only a few medallions are left over for the new guy, and he can’t afford them anyway. Bingo—your competition problem is solved. The customers might not like it, but what are they going to do—walk?

Apparently this is exactly what is happening in DC

Now it’s the District of Columbia’s turn. Four members of the D.C. City Council have introduced a bill that would create a medallion system for the nation’s capital. Medallion prices would start at $250 for the most established taxi companies and, for the newer entrants, run as high as $10,000. At least initially. As time wore on, it’s likely that the price of a medallion would go up for everyone. That’s what has happened in places such as New York, where a government permission slip to drive a cab costs about $600,000. In Boston, which initially capped medallions at 1,525 in the 1930s—and more than a half-century later had added only 250 more—a medallion will cost you $400,000.

At present the District has more than 10,000 licensed taxi drivers; the proposed legislation would establish only 4,000 medallions. Needless to say, such artificially imposed scarcity also drives up prices. A study by Natwar Gandhi, the District’s chief financial officer, found that fares in cities with medallion systems are 25 percent higher than in cities with open taxi markets.

By the way, for extra points, here is a lawsuit right out of Atlas Shrugged

That story has played out in many cities across the United States, with sometimes amusing variations. A decade or so ago, Minneapolis (population 300,000-plus) allowed a grand total of 343 taxis to operate until Luis Paucar, an immigrant, filed suit. The city council decided to allow another 45 cabs. Then the existing cab companies sued, using the creative legal theory that they had a constitutional right not to face competition. (They lost.)

Sure-Fire Science Fair Project

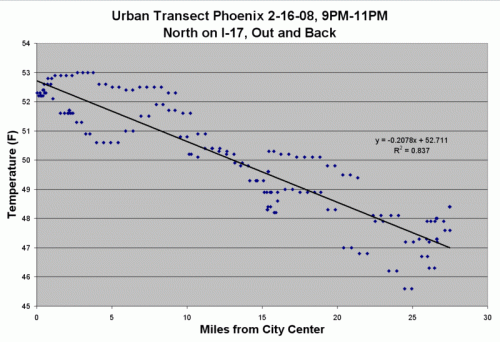
In 8th grade, my son won his science fair with this easy and fun project to measure the urban heat island effect around our city.  I know parents and kids alike can struggle to find a good project.  This is one that not only is interesting, but helps to prove the existence of a phenomenon that many climate alarmists work hard to deny.  Imagine a temperature measurement point in downtown Phoenix, which we found to be 7-10F hotter than the outlying areas just 30 miles away.

What did that thermometer read 100 years ago?  How much of measured global warming is due to this effect, particularly since our airport, the typical place where temperature records are based for large cities, is right in the center of town?

Anyway, we had to kluge together some stuff to make this work, but the Weather Shop now offers a simple kit. The site suggests keeping track of position in a log vs. time, which is what we did the first time and works just fine.  However, the second time through, we got fancy and also had a GPS logger.

Peak Pricing for Parking

From my point of view, the NY Times buried the lede in this story about installation of parking sensors on San Francisco streets.  The article focuses mainly on the ability of drivers at some time in the future to get locations of empty parking spots on the streets via smartphone or possibly their GPS.  But I thought the pricing changes they were facilitating were more interesting:

SFpark, part of a nearly two-year $95.5 million program intended to
clear the city's arteries, will also make it possible for the city to
adjust parking times and prices. For example, parking times could be
lengthened in the evening to allow for longer visits to restaurants.

The
city's planners want to ensure that at any time, on-street parking is
no more than 85 percent occupied. This strategy is based on research by
Mr. Shoup, who has estimated that drivers searching for curbside
parking are responsible for as much of 30 percent of the traffic in
central business districts.

In one small Los Angeles business
district that he studied over the course of a year, cars cruising for
parking created the equivalent of 38 trips around the world, burning
47,000 gallons of gasoline and producing 730 tons of carbon dioxide.

To
install the market-priced parking system, San Francisco has used a
system devised by Streetline, a small technology company that has
adapted a wireless sensor technology known as "smart dust" that was
pioneered by researchers at the University of California, Berkeley.

It
gives city parking officials up-to-date information on whether parking
spots are occupied or vacant. The embedded sensors will also be used to
relay congestion information to city planners by monitoring the speed
of traffic flowing on city streets. The heart of the system is a
wirelessly connected sensor embedded in a 4-inch-by-4-inch piece of
plastic glued to the pavement adjacent to each parking space.

The
device, called a "bump," is battery operated and intended to last for
five and 10 years without service. From the street the bumps form a
mesh of wireless Internet signals that funnel data to parking meters on
to a central management office near the San Francisco city hall.

This is actually really cool, but my guess is that politicians will not have the will to charge the level of peak prices the system may demand.

Postscript:  As many of you know, there is a new wave of urban planners who want to impose dense urban living on all of us, whether we like it or not.  I have no problem with folks who want to fight the masses and live in downtown SF or Manhattan, but the world should also have a place for the majority of us who like to have an acre of land and a bit less congestion. 

Anyway, in singing the praises of the urban lifestyle (which often is as much an aesthetic preference vs. suburbia as anything else), you seldom hear much about this type of thing:

Solving the parking mess takes on special significance in San Francisco
because two years ago a 19-year-old, Boris Albinder, was stabbed to
death during a fight over a parking space....

The study also said that drivers searching for metered parking in just
a 15-block area of Columbus Avenue on Manhattan's Upper West Side drove
366,000 miles[!!] a year.

And here we suburbanites are complaining when we have to park more than 5 spaces from the door of the supermarket.

Contributing to Science, Follow-up

My photo survey of the Tucson USHCN climate station is still creating a lot of discussion.  Discussion, for example, is here, here, and here.

And you too can have the satisfaction of contributing to science.  All
you need is a camera (a GPS of some sort is also helpful).  I wrote a
post with instructions on how to find temperature stations near you and how to document them for science here.  Believe it or not, for all the work and money spent on global warming,
this is something that no one had done -- actually go document these
sites to check their quality and potential biases.