Posts tagged ‘Temperatures’

Natural Climate Variability and Mann's Hockey Stick

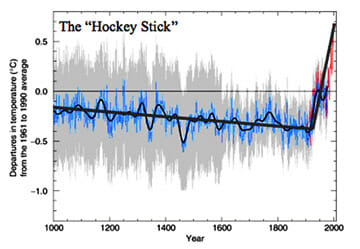
Most folks even slightly acquainted with the climate debate have seen Dr. Mann's hockey stick.  It is a historical temperature reconstruction using proxies such as the width of tree rings.

There were a zillion problems with this analysis, which I and many covered years ago and, frankly, I am past my tolerance in reiterating once again.  Just to name three:

  • The inflection of the hockey stick occurs right where two completely different data sets - proxies and actual thermometer readings -- have been grafted together, leading one to wonder if the inflection is a real natural phenomenon or instead related to differences in how the data was gathered
  • The blue line, of the proxy data, ends in 1950.  The reason for that is that the proxy data actually shows temperatures falling since 1950.  This does not mean that temperatures actually fell - we are sure they have risen -- it means that the proxies are not very good proxies.  If they are not following temperatures well in the last 50 years, why do we think they mirrored temperatures well in the 1000 years before that?
  • As Steve McIntyre showed, while Mann used many proxies, his statistical method basically over-weighted a single data set from bristlecone pines in California and used techniques that were shown later to generate hockey sticks even from random noise.

Anyway, you can search Google and spend most of the day reading critiques and defenses of Mann.

But I think a lot of laymen missed the point of the analysis.  Folks want to say that the hockey stick proves we have a big current spike in temperatures -- ie they focus on the blade of the hockey stick.  But we already knew from surface temperature records that world temperatures have risen perhaps 0.8C over the last century.  And besides, as mentioned above, Mann's proxy data does not even confirm or support the current working.

No, the "insight" of the hockey stick analysis was the handle -- the fact that until 1900, Mann was essentially claiming that temperatures had been 1) dead flat with limited variation and 2) consistently well below current temperatures.  Prior to Mann's analysis, most scientists had a picture of past climate that had a warm period from 1000-1300 that was perhaps as warm as it is today followed by a cold period  (called the medieval warm period and the little ice age).  Most of this was based on historical analysis.  Go to your local university and find a medieval historian.  Going forward, universities will probably not teach any European history any more, but you probably can find a few old folks still hanging on via tenure.  I took an audio course from Philip Daileader of William and Mary and he started his course on the high middle ages (1000-1300) by saying the most important fact of that period was the demographic expansion allowed in part by a warm and favorable climate.  The warm climate allowed more food production as new areas, particularly in the north, could be brought into production.  In turn, after 1300, Europe was met with a cooler and wetter climate that created a horrible famine in the 1320's, which in turn likely weakened the population and made the black death a few decades later all the worse.  Later on, we have records of canals and rivers freezing across Europe that almost never freeze today.  This colder period lasted until the early 19th century (I use 1812 as a break as I think of the freezing Russian winter of that year that sent Napoleon home without most of his army).  Temperatures and sea levels began rising after that, long before man was burning fossil fuels in earnest.

This historical picture, shared by pretty much everyone until 20 years ago, was overturned by Mann.  Look at his chart - no warm period in the middle ages, and no substantially colder period just afterwards.  How did he refute the historical evidence, which is robust?  He waved this evidence off as limited to Western Europe.  Which was sort of funny, because most of his proxy data came from an even smaller area, the mountains east of Bishop, CA**.

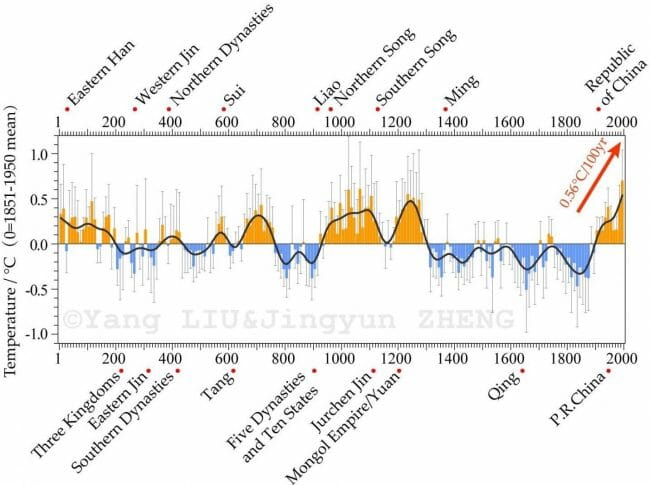
So all this is a leadup to a new study out of China looking at temperature proxies for China.  And it turns out China, which is on the other side of the world from the west (I know that because when Bugs Bunny digs straight down he always comes out in China), has pretty much the same temperature history everyone before Michael Mann thought we had in Europe.


**postscript:  If you have a sports car, and want to drive a curving mountain road that does not have a lot of big cliffs and has pretty much zero other cars to get in the way, you might try Highway 168 from near Bishop up towards the ancient bristlecone pine forest.


Scott Sumner Explains a Lot of Climate Alarmism, Without Discussing Climate

Scott Sumner is actually discussing discrimination, and how discrimination is often "proven" in social studies

The economy operates in very subtle ways, and often when I read academic studies of issues like discrimination, the techniques seem incredibly naive to me. They might put in all the attributes of male and female labor productivity they can think of, and then simply assume than any unexplained residual must be due to "discrimination." And they do this in cases where there is no obvious reason to assume discrimination. It would be like a scientist assuming that magicians created a white rabbit out of thin air, at the snap of their fingers, because they can't think of any other explanation of how it got into the black hat!

Most alarming climate forecasts are based on the period from 1978 to 1998.  During this 20 year period world temperatures rose about a half degree C.  People may say they are talking about temperature increases since 1950, but most if not all of those increases occurred from 1978-1998.  Temperatures were mostly flat or down before and since.

A key, if not the key, argument for CO2-driven catastrophic warming that is based on actual historic data (rather than on theory or models) is that temperatures rose in this 20 year period farther and faster than would be possible by any natural causes, and thus must have been driven by man-made CO2.  Essentially what scientists said was, "we have considered every possible natural cause of warming that we can think of, and these are not enough to cause this warming, so the warming must be unnatural."  I was struck just how similar this process was to what Mr. Sumner describes.  Most skeptics, by the way, agree that some of this warming may have been driven by manmade CO2 but at the same time argue that there were many potential natural effects (e.g. ocean cycles) that were not considered in this original analysis.

Hearing What You Want to Hear from the Climate Report

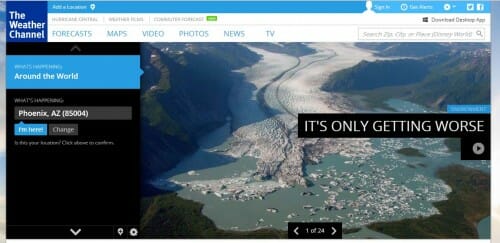
After over 15 years of no warming, which the IPCC still cannot explain, and with climate sensitivity numbers dropping so much in recent studies that the IPCC left climate sensitivity estimates out of their summary report rather than address the drop, the Weather Channel is running this headline on their site:

weatherch


The IPCC does claim more confidence that warming over the past 60 years is partly or mostly due to man (I have not yet seen the exact wording they landed on), from 90% to 95%.  But this is odd given that the warming all came from 1978 to 1998 (see for yourself in temperature data about halfway through this post).  Temperatures are flat or cooling for the other 40 years of the period.  The IPCC cannot explain these 40 years of no warming in the context of high temperature sensitivities to CO2.  And, they can't explain why they can be 95% confident of what drove temperatures in the 20 year period of 1978-1998 but simultaneously have no clue what drove temperatures in the other years.

At some point I will read the thing and comment further.


Some Responsible Press Coverage of Record Temperatures

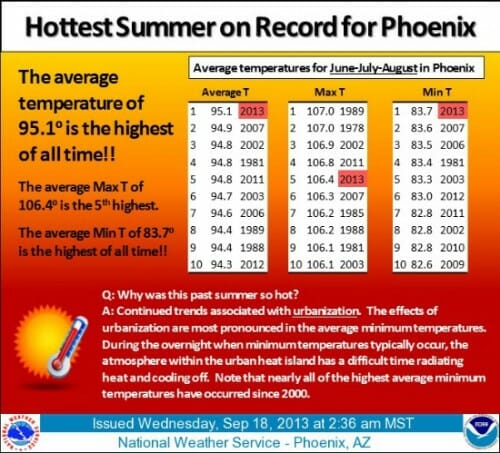
The Phoenix New Times blog had a fairly remarkable story on a record-hot Phoenix summer.  The core of the article is a chart from the NOAA.  There are three things to notice in it:

  • The article actually acknowledges that higher temperatures were due to higher night-time lows rather than higher daytime highs  Any mention of this is exceedingly rare in media stories on temperatures, perhaps because the idea of a higher low is confusing to communicate
  • It actually attributes urban warming to the urban heat island effect
  • It makes no mention of global warming

Here is the graphic:

hottest-summer


This puts me in the odd role of switching sides, so to speak, and observing that greenhouse warming could very likely manifest itself as rising nighttime lows (rather than rising daytime highs).  I can only assume the surrounding area of Arizona did not see the same sort of records, which would support the theory that this is a UHI effect.

Phoenix has a huge urban heat island effect, which my son actually measured.  At 9-10 in the evening, we measured a temperature differential of 8-12F from city center to rural areas outside the city.  By the way, this is a fabulous science fair project if you know a junior high or high school student trying to do something different than growing bean plants under different color lights.

Reminder: Nov. 10 Phoenix Climate Presentation

I will be making a free presentation in Phoenix on climate change and the science behind the skeptic's case.  It is free to the public, and in answer to numerous inquiries, it is not sponsored or paid for by any organization and I am not promoting a book or any commercial product.  This is simply my personal hobby and style of activism (e.g. cerebral lecture rather than circling around carrying a sign).

But here is the really interesting coincidence:  It turns out Al Gore will be making the keynote address at the Greenbuild Conference in Phoenix on the next day (Nov 11).  Those who would like to be immunized in advance against his silliness should come to my presentation the night before.

The web site and directions for the presentation are hereNov 10 Climate Lecture Brochure (pdf).   We have a pretty large auditorium, so everyone is welcome.  Feel free to send the link or brochure to your friends in the area.

You can sign up for email updates on the event here.

Update: I can see the local climate is already reacting to Gore's visit, as we get an early dose of the Gore effect:

Temperatures in the Valley are expected to fall more than 20 degrees to the 60s by midweek, according to the National Weather Service.

I'd Hate to See Winter

There is some discussion over at Climate Audit about Ojmjakon, Russia in the context of trying to debug some recent NASA temperature measurement glitches.  But I could not get past this data, which really seems a bit nippy for late Autumn:

ojmjakon

Well, as long as its sunny.