On The Steven Goddard Claim of "Fabricated" Temperature Data
Steven Goddard of the Real Science blog has a study that claims that US real temperature data is being replaced by fabricated data. Christopher Booker has a sympathetic overview of the claims.
I believe that there is both wheat and chaff in this claim, and I would like to try to separate the two as best I can. I don't have time to write a well-organized article, so here is just a list of thoughts
- At some level it is surprising that this is suddenly news. Skeptics have criticized the adjustments in the surface temperature database for years
- There is certainly a signal to noise ratio issue here that mainstream climate scientists have always seemed insufficiently concerned about. Specifically, the raw data for US temperatures is mostly flat, such that the manual adjustments to the temperature data set are about equal in magnitude to the total warming signal. When the entire signal one is trying to measure is equal to the manual adjustments one is making to measurements, it probably makes sense to put a LOT of scrutiny on the adjustments. (This is a post from 7 years ago discussing these adjustments. Note that these adjustments are less than current ones in the data base as they have been increased, though I cannot find a similar chart any more from the NOAA discussing the adjustments)
- The NOAA HAS made adjustments to US temperature data over the last few years that has increased the apparent warming trend. These changes in adjustments have not been well-explained. In fact, they have not really be explained at all, and have only been detected by skeptics who happened to archive old NOAA charts and created comparisons like the one below. Here is the before and after animation (pre-2000 NOAA US temperature history vs. post-2000). History has been cooled and modern temperatures have been warmed from where they were being shown previously by the NOAA. This does not mean the current version is wrong, but since the entire US warming signal was effectively created by these changes, it is not unreasonable to act for a detailed reconciliation (particularly when those folks preparing the chart all believe that temperatures are going up, so would be predisposed to treating a flat temperature chart like the earlier version as wrong and in need of correction.

- However, manual adjustments are not, as some skeptics seem to argue, wrong or biased in all cases. There are real reasons for manual adjustments to data -- for example, if GPS signal data was not adjusted for relativistic effects, the position data would quickly get out of whack. In the case of temperature data:
- Data is adjusted for shifts in the start/end time for a day of measurement away from local midnight (ie if you average 24 hours starting and stopping at noon). This is called Time of Observation or TOBS. When I first encountered this, I was just sure it had to be BS. For a month of data, you are only shifting the data set by 12 hours or about 1/60 of the month. Fortunately for my self-respect, before I embarrassed myself I created a spreadsheet to monte carlo some temperature data and play around with this issue. I convinced myself the Time of Observation adjustment is valid in theory, though I have no way to validate its magnitude (one of the problems with all of these adjustments is that NOAA and other data authorities do not release the source code or raw data to show how they come up with these adjustments). I do think it is valid in science to question a finding, even without proof that it is wrong, when the authors of the finding refuse to share replication data. Steven Goddard, by the way, believes time of observation adjustments are exaggerated and do not follow NOAA's own specification.
- Stations move over time. A simple example is if it is on the roof of a building and that building is demolished, it has to move somewhere else. In an extreme example the station might move to a new altitude or a slightly different micro-climate. There are adjustments in the data base for these sort of changes. Skeptics have occasionally challenged these, but I have no reason to believe that the authors are not using best efforts to correct for these effects (though again the authors of these adjustments bring criticism on themselves for not sharing replication data).
- The technology the station uses for measurement changes (e.g. thermometers to electronic devices, one type of electronic device to another, etc.) These measurement technologies sometimes have known biases. Correcting for such biases is perfectly reasonable (though a frustrated skeptic could argue that the government is diligent in correcting for new cooling biases but seldom corrects for warming biases, such as in the switch from bucket to water intake measurement of sea surface temperatures).
- Even if the temperature station does not move, the location can degrade. The clearest example is a measurement point that once was in the country but has been engulfed by development (here is one example -- this at one time was the USHCN measurement point with the most warming since 1900, but it was located in an open field in 1900 and ended up in an asphalt parking lot in the middle of Tucson.) Since urban heat islands can add as much as 10 degrees F to nighttime temperatures, this can create a warming signal over time that is related to a particular location, and not the climate as a whole. The effect is undeniable -- my son easily measured it in a science fair project. The effect it has on temperature measurement is hotly debated between warmists and skeptics. Al Gore originally argued that there was no bias because all measurement points were in parks, which led Anthony Watts to pursue the surface station project where every USHCN station was photographed and documented. The net results was that most of the sites were pretty poor. Whatever the case, there is almost no correction in the official measurement numbers for urban heat island effects, and in fact last time I looked at it the adjustment went the other way, implying urban heat islands have become less of an issue since 1930. The folks who put together the indexes argue that they have smoothing algorithms that find and remove these biases. Skeptics argue that they just smear the bias around over multiple stations. The debate continues.
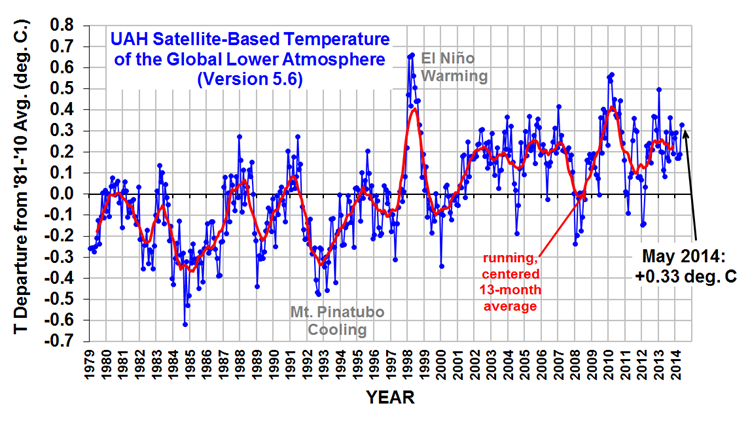
- Overall, many mainstream skeptics believe that actual surface warming in the US and the world has been about half what is shown in traditional indices, an amount that is then exaggerated by poorly crafted adjustments and uncorrected heat island effects. But note that almost no skeptic I know believes that the Earth has not actually warmed over the last 100 years. Further, warming since about 1980 is hard to deny because we have a second, independent way to measure global temperatures in satellites. These devices may have their own issues, but they are not subject to urban heat biases or location biases and further actually measure most of the Earth's surface, rather than just individual points that are sometimes scores or hundreds of miles apart. This independent method of measurement has shown undoubted warming since 1979, though not since the late 1990's.
- As is usual in such debates, I find words like "fabrication", "lies", and "myth" to be less than helpful. People can be totally wrong, and refuse to confront their biases, without being evil or nefarious.
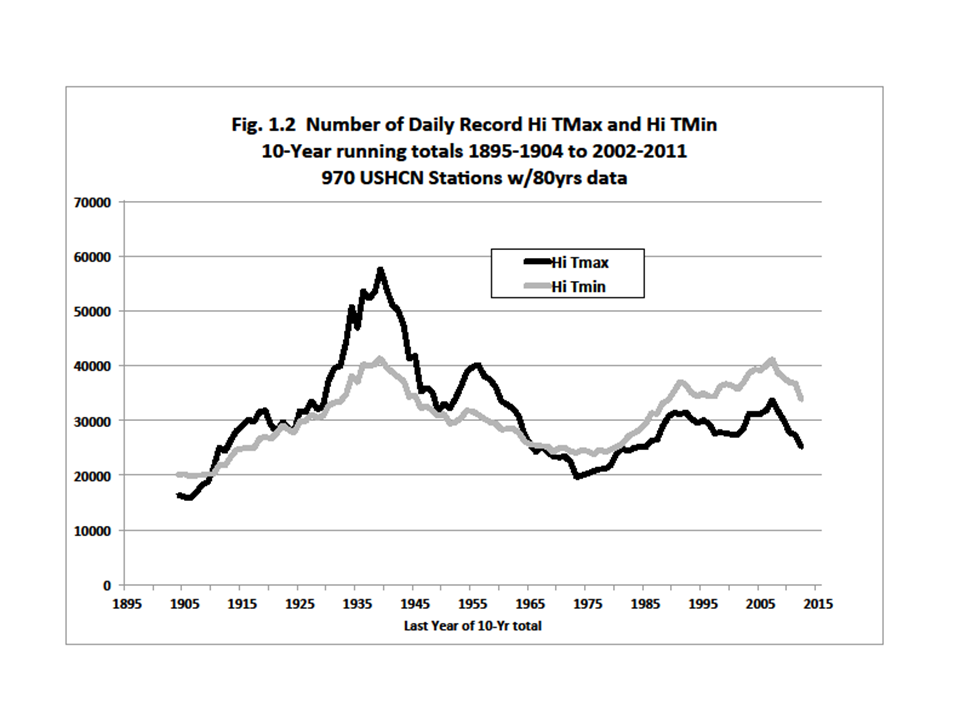
Postscript: Not exactly on topic, but one thing that is never, ever mentioned in the press but is generally true about temperature trends -- almost all of the warming we have seen is in nighttime temperatures, rather than day time. Here is an example from Amherst, MA (because I just presented up there). This is one reason why, despite claims in the media, we are not hitting any more all time daytime highs than we would expect from a normal distribution. If you look at temperature stations for which we have 80+ years of data, fewer than 10% of the 100-year highs were set in the last 10 years. We are setting an unusual number of records for high low temperature, if that makes sense.

On the subject of urban heat islands biasing nighttime temperatures... this is strictly anecdotal and not rigorously scientific, but we recently bought a car with an infrared night vision camera system for pedestrian detection (that it can also see cars parked along side of the highway from a decent distance is a nice bonus - helps to avoid the road pirates). Anyway, as you drive around you can see all of the objects around you that soak up heat from the sun during the day and are very slow to radiate it all out versus the natural ground cover, vegetation, etc. It's quite stark and right there in black and white, so to speak.
Your last point is particularly compelling. If a parking lot is put up around a station, then the station's measured temperature will increase by multiple degrees. Multiple degrees is not a big deal if you are just wondering if the temperature is in the 60s or in the 80s in the city you are about to land in.
However, it's a very big deal if you are trying to precisely measure a trend of 3-5 degrees over a century, because the measurement error is larger than the 100-year delta. With such a large measurement error, I don't know what you can really do. You need a better thermometer, which we now have via the satellite measurements. How do you get a better thermometer going back in time, though?
You can't fix this problem by massaging the data after the fact. To the extent it is feasible, you need to go perform some detailed analysis of each station and its history. For example, you could put thermometers out in the wilderness a few miles a way from a station, and then you could try and develop a way to convert the station data into the wilderness data. Combined with information about the history of the station, you could then repeat this analysis on older temperature data. I won't say it's impossible in general, but it does seem to be impossible if you only use the raw data feeds that we currently have. The necessary information is just not there.
Well balanced commentary. Of course those with a bias either way will tend to see it as they want, but I've tried to remain objective on this topic and have awaited some more info.
Ultimately I think this is a "where there's smoke there's fire" issue; especially in the context of so much other questionable data/study practices amongst the alarmists over the years.
1. Given the repeated lack of good faith demonstrated repeatedly by the alarmist establishment, I have no problem with Goddard's assertions that they are not operating in good faith in the present circumstance. 2. The establishment contention that their super duper pooper scooper algorithm can take 90+% crappy data (without knowing which data is accurate or how much the bad data is off or when) and turn it into Rumplestiltskin's gold is beyond ridiculous.
The most important takeaway is that science which cannot be independently replicated is not science. And before government takes away the liberty and property of the citizenry, they should have a right to confront the evidence used against them. Without replication, they are being subjected to the tyranny of secret evidence.
Another driver in warmer low temperatures is the vast amount of irrigation. Lawns in the cities and crops in the country. Not only do cities have warmer nights, now, but rural areas like central California and Iowa have measurably higher humidities now, than in the past.
almost all of the warming we have seen is in nighttime temperatures
The term "Greenhouse Gas" seems kinda harsh, could we change the name to "snuggly blanket gas" as it seems to be keeping us warm at night and is as accurate as greenhouse gas.
And it's still just the US. Calculating global temperature is amazingly complicated. The newest methods interpolate spatial holes with weather models instead of more simplified approximations.
Record high lows is of course what is predicted by models.
You guys sound less and less like skeptics. I guess it's a fun hobby learning about the science.
"You guys sound less and less like skeptics"
Or less and less like the caricature of skeptics in your mind.
Have you ever gone in a greenhouse at night?
I'm quite familiar with coyote's writing and evolution on the subject. Conceding the obvious and working slowly back toward the edges. It's actually what every good graduate student in the field does. Question everything. Of course they get to work on it 24-7 and interact with others who also do.
I think the problem may very well boil down to communication. Caricatures of scientists, misunderstanding of the scientific process, uncertainty, what's involved in peer review, etc., seem pretty rampant at the core.
Eventually, the most rational skeptics are just fighting media perspectives about uncertainty and consequences. They eventually figure out that skepticism with respect to the science is built into the science.
I wonder why all the data tweaks Coyote rationalizes tend to push the trend line up rather than down? Hmmm?
I had an interesting experience the other night. I live in Phoenix and was taking a walk at about 10 pm. I guess the temperature was about 95 or so and it was fairly pleasant. Then I went around a corner and walked into a what I'll call a " mini heat island." The cause was a large west-facing concrete and block wall that was still radiating heat it had absorbed during the day. As the blogger's posts on heat island effect and the posts on the bias that this effect and other siting-flaws at the official weather stations show, there is more than CO2 causing higher nighttime temps.
Imagine how much better the science will be when scientists allow their work to be replicated and adopt the novel practice of actually trying to replicate others' work. Imagine when they learn to site thermometers in accordance with basic standards. Imagine if the IPCC stops violating basic forecasting principles. Or if the models actually begin to recognize that the climate is a non-linear, chaotic system. We might actually start learning something useful about climate!
I imagine you'll eventually figure out that they're already there, already independently testing calculations, assumptions, models, and every climate model is based on the assumption of a non-linear chaotic system.
Common sense? That 0.0039% or double that will cause the oceans to rise? We all know it is a complicated subject, Cannonball. But on its face the idea that a trace gas has the effect alleged by the alarmists is absurd. Yes, it has some effect.
And yes, the temperature record is just for the U.S. It would be false to infer from those data any general conclusion about the global climate, regardless of the mechanism. For that we need data from Paraguay, Mongolia, and Zimbabwe. No problem there with air conditioners being near the thermometer.
We know these climate scientists work hard, a metaphorical 24/7. As Coyote concedes, not all manipulate data to prove a political point or to get in on the carbon credit gravy train, or to lower our standard of living. This is about saving the planet, right?
But even if one wears a lab coat and wears a pocket protector, if you collect garbage, you are in the garbage business.
FelineCannonball :
I'm late to the conversation but something you said caught my eye. You said "And record high lows is of course what is predicted by models...."
While I know that the Urban Heat Island effect (UHI) is a well documented factor in raising night time temperatures, I had not heard before that .... "high lows is of course what is predicted by models." I'd like to hear more and why BOTH daytime and night time temperatures are not affected in the same way by the models, i.e., what's different about day and night effects of CO2?
The last I heard Coyote is perfectly on board with 0.0039% having the direct impact that scientists have modeled. For some reason he has a problem with most modeled estimates of starting point-dependent positive feedbacks (like ice albedo, water vapor, soil/sediment oxidation, etc.) and for some reason he still expects that these feedbacks will have no lag times and the ocean heat sink will have no effect on the rate of atmospheric warming or internal oscillations that confuse short-term warming trends.
No climate scientist hangs their hat upon a particular instrumental record reconstruction of global surface temperature. In fact it's pretty clear they can't all be right as they don't agree. The reason you try to reconstruct global surface temperature now and back in time is to learn how to do it better. If anything you're creating constraints on past change, not laying it down precisely. Pay attention to the uncertainty and remember the earth's surface is just part of the system.
In the bigger picture the mechanism of global warming with CO2 acting as a long-term driver really isn't based on instrumental records. Paleoclimate studies and physics-based climate modelling are the origin of the theory. The instrumental reconstructions are just an early and ongoing attempt to observe a piece of it.
I do not want to speak for Coyote, but I believe he is among those who question the models from many angles, including theories about the magnitude of the feedback. The scientific basis for the IPCC may be obvious to you, but you weaken your case by not addressing the question.
One question I have is how one can test the effect of CO2 on the climate when there are so many uncontrolled variables.
But even if Coyote were on board, as you say, that does not settle the question of whether cap and trade or tighter CAFE standards will keep the ocean from flooding Miami. It is not obvious at all. It is not obvious at all, including the possibility that any of these measures will push the climate in the right direction. Note BHO was careful to say, "Climate change is real," which is, duh, not going out on a limb.
By the way, I think Coyote has said his models are better than their models. Then again, do we believe a person who writes for Forbes?
I'm not sure I understand all the questions. There are a lot of models. They all are simplifications and all have uncertainties. They differ in results and all of them are unstable so you have to look at large numbers of model runs to get a glimpse at the range of predicted variability. I believe Coyote is simply betting on a lower trajectory within the range of published model results, but since he isn't deep in the code I'm not sure what his basis is, other than assuming political bias. I'd probably use paleoclimate records (deep time -- not Hanson recent stuff) to put constraints on sensitivity, but I'd still say the uncertainty is high.
The IPCC is a bunch of scientists asked to provide a consensus report. They give their best guess as to magnitude and uncertainty, but nothing they write is fact. The consensus changes with time and evidence. Cap-n-trade or carbon taxes are policy questions, not science questions.
Testing CO2 sensitivity and model accuracy is best done at this point with the paleoclimate record. It gives you many opportunities to look at big events with large CO2 changes and climate impacts. The current "event" is still in it's inception and it is barely above the noise. The one thing I might look at is water vapor responses to temperature in the current system as a model test. The models which most accurately reflect temperature-water vapor response are probably the ones that will most accurately model this aspect of climate sensitivity in projections.
Basically dynamic effects are more likely to constrain day time highs (evaporation, convection, thermals, breakdown of high pressure systems, coastal breezes, etc) but night time lows will be will be more directly related to radiant heat loss (including impacts of water vapor from the day time evaporation and coastal circulation). The biggest effects should actually be high-lows during that big long night above the arctic circle -- and resulting impacts on the thickness of arctic sea ice created.
The main problem I have with adjustments is that (according to the law of large samples) we should see a zero trend without systemic influences. The only systemic influence we easily recognize is UHI islands, irrigation and altered landscapes. All of those are negative adjustments but the sum of all adjustment is hugely positive. Why? I know of the TOB and haven't looked into it but have a really hard time to believe that the sum of all time-of-observation adjustments should differ much from zero.
Coyote’s evolution?
LMFAO
Global WarmingClimate DisruptionClimate Change is a laughably inaccurate field, with a 95% failure rate for the models.
This entire field is beyond corrupt. If you tried the same statistical tactics in the financial field, you would be immediately sanctioned, and likely criminally tried and jailed.
You can't just splice time series measurements together, much less unrelated proxies. That's like splicing price performance charts of Microsoft to platinum futures, to make it look good.
That is fraudulent misrepresentation in many contexts, and that is highly prosecutable (unless you're a Friend of Barry of course).
I imagine you'll finally figure out that the overt bullshit perpetrated by these government-funding-beholden pseudoscientific whores is incorrect.
Oh, wait, you probably won't because you lack basic math and reasoning skills, not to mention actual intelligence.
There you go again, saying "they" are already there, operating in a non-linear chaotic system. What does it mean, exactly, to model chaos, and please do not answer by saying the answer lies in the methods used by paleo climatologists. Your sentences resist scrutiny, to put it politely.
I am sorry I did not put a previous question to you more clearly, when wondering about the problem of having uncontrolled variables in measuring ANY phenomenon. I will give you part credit for acknowledging that a near-chaotic situation (conceding to the materialists that the climate may not be infinitely chaotic) has the same problem as an uncontrolled simple experiment.
I gather your field is geology, and I do not wish to impugn that pursuit in any way, or deny that one can learn much from it. But the big question is whether humans should commit huge resources SOON to reducing CO2, which hinges on whether doing so will be effective in preventing nature from doing what it will. SOON, at present in the US, means before the November elections or perhaps shortly after January 3, when Harry Reid might have to move his office. Now that the science is settled, it's time to move on with progress and end coal, as the Sierra Club and the NRDC says.
So, even if we can deduce what happened ages ago, and draw from that record why it might have happened and then theorize what might happen ages hence, one's predictions have to be in the thousands of years. You tell me.
But first explain your philosophy of science, including what nonlinear thinking is, and what it means to model chaos. Maybe the rest of us are prisoners of Western ways of thinking. Have at it.
In climate modeling you are modeling a chaotic system but you aren't caring about predicting the precise chaos. You care about predicting statistical values that describe climate (averages, variances, boundary states, etc.). It turns out these statistical values and their response to forcing can be modeled, while precise predictions of weather or hurricane paths can not.
I used to be an investment advisor, and in retrospect spent too much time reading brokerage house research, which was improved, they said, with the advent of Lotus 1-2-3 and Multiplan. I used to read economic research, too -- some of it useful. And like Hillary, I read the WSJ (still do), and read a lot of annual and quarterly reports. Of necessity, I had to make decisions about where to put other people's money, or at least tell them what I considered best.
Perhaps the most valuable lesson I learned was not to listen to anyone making market predictions, and never to attempt making any myself beyond saying that today's number in the paper today might be tomorrow's price, and that stock prices generally follow earnings.
Another thing I learned was not to panic when, say, XYZ company misses street earnings estimates for quarterly earnings by a few pennies. The chairman of the board does not know what that number will be within a few cents until his chief bean counter reveals it to him. Sure, the Vice President of Sales got out the word to the warehouses to load as much finished goods out of the plant and into rail cars, but everybody knows in the short term one can borrow from the future. If that is hard to figure, then ponder the meaning of a macro number like GDP, or the figure for business inventories in Barron's Market Laboratory. The pulse of trade and commerce, to plug into your model.
I also worked for a consulting firm specializing in operations. One of the first things in our training, beyond showing up on time not stinking, was to believe nothing you heard and only half of what you see.
I guess that makes me reflexively skeptical, not just listening to Al Gore or Barack Obama discuss global warming, but nearly everything I hear and read. Of course, a piece written by nuclear engineers about building a reactor gets more credence than a piece on the same subject written by an electrical engineer or a sociologist or an astrologer.
So, how does one evaluate the latest emanation from the IPCC? The obvious answer is to read it, along with all the footnotes, and examine the details. Or, you hang out on the Coyote Blog and the blogs he refers to, which present the many sides in the debate, especially the critical arguments. Life is short.
From this, I have decided never to read Earth in the Balance, a waste of time. If I had to teach ecology, I guess I would have to read it, but there are limits. Experts on football probably do not have to read Brian Bosworth's autobiography without worrying they had missed something important about football, which is still just football.
Correct - regarding adjustments - if you move a station - there is usually a 2 year overlap period so data on the new station can be sync'ed. There should be on average a 50% chance that the new location is warmer an 50% that it is colder - seems like 80+ percent of those adjustments are up.
Changing out thermometers - seems like in this day and age our more accurate high tech thermometers almost always underreport the temperature as well. Then of course there were the station shutdowns a few years back in which amazingly, only those stations showing cooling were shut down to save costs. The stations shut down shouldn't have boosted temps one iota.
In the end we will probably all freeze to death in the blazing heat.
Yes - global warming won't raise warm temperatures - it should just result in raising the cooler temperatures in so pole to equator differences won't be as great. H2O does a great job of overlapping some of the CO2 absorption frequencies - so CO2 only has an effect where the air is very dry (this is different from having low humidity).
Coyote believes, like he should, that stable natural processes are ruled by negative feedback. It is much more likely that there are processes in the atmosphere that dampen the effects of CO2 rather than amplify them. Systems ruled by positive feedback tend to be short lived and unstable. If our atmosphere were really ruled by positive feedback, it would have blown away eons ago with the first "catastrophic" event. There was a time when almost all O2' in the air was bound to carbon - and the evolution of plants disrupted the planet by rapidly iminating CO2 and replacing it with the poison O2. Somehow animals adapted to this new environment.
As for ice labedo - since our planet currently has the greatest ice extent ever recorded - somehow CO2 doest seem to be doing its job all that well. Maybe it joined a union and is in a work slowdown?
Gee. Who to believe? Respected physicists and acknowledged experts in statistics or some anonymous internet troll spewing bullcrap? Tough choice. not.
During the last interglacial the oceans got about 10 feet higher than they are today and the temperature was about 2degC warmer as well before then very sudden downturn. It seems like the alarmists, knowing this, have set up the argument so they will win. Of course it will continue warming, natural - and of course the sea levels will rise, naturally. We will just blame it on AGW this time around.
Not too that the ocean rise is declining. It averaged about 7mm per year the last 11,000 years -,occasionally rising several feet within days. Now we have a widy cited propaganda figure of 3mm and actual measurements show about 1.7 mm per year - which again seems very normal for our stage in the interglacial. Note some experts (though I can not fathom how they did this with equipment that - at best has 30mm accuracy) think that last year the oceans actually shrank in size - meaning Obama actually did fullfill one of his campaign promises.
Well yeah - except these respected physicists - sent emails to each other about how they doctored the data for political effect .
How soon we forget climate gate I and II.
And then there are the recent revelations of scientists who have different opinions being fired or barred from working because they don't follow the politically correct line.
And then we see the models of their hypotheses ring colossally.
Hmm, seems like in this case it might be more wise to trust the blogger.
You can splice different datasets together - if you want to hide the decline.
Yes and the lack of clean circulating air due to the super sealed structure - gave me a headache. But in liked the solar/thatch roof.
The biggest problem..."(one of the problems with all of these adjustments is that NOAA and other data authorities do not release the source code or raw data to show how they come up with these adjustments)"
No raw data, just results from models, and no indication of how the models are constructed = fairy dust and unicorn toots.
Even in grammar school math class you always had to 'show your work' not just an answer.
It's constrained positive feedback. Ice albedo stops being a factor after it is all melted. Soils stop contributing carbon after they're depleted. Water vapor can't get too high globally without forming more clouds and reflecting primary light back.
If negative feedbacks were the only process we wouldn't have ice ages, Triassic and Eocene polar forests, Antarctic dinosaurs, equatorial glaciers in the Precambrian, etc.
Well if it is constrained, we have nothing to worry about then.
Interestingly, you are going on about the ice again. We currently are experiencing the greatest global ice extent ever recorded. Is CO2 on vacation? Cuz it sure seems to not be melting our ice.
? Greatest extent?
You don't believe in glacial deposits and ice ages either?
You can imagine they are already there. You can imagine that.
There is no independent testing calculations, assumptions and models, as we found out from climategate - doh.
Don't just make stuff up.
In fact replication is down in all sciences because there is little money in it. Much easier to get funds say something new, bold and grand, with a tinge of fear, than to actually figure if your coworker, is actually being truthful about his new bold grand fearful study.
OK, if that is what you call a philosophy, so be it. I am not going to beat that horse any more. What you are saying is that there has to be x amount of forcing to conclude that y CO2 to make your model fit, and that the mechanism itself cannot be tested.
Evidently you are confident that the models used today are reliable enough to predict what will likely occur in the next century, or maybe in the next ten or twenty years, which is what the controversy is all about. We have to cut burning carbon fuels to 1992 levels (why not 1940 levels, the heel of the hockey stick?). "We" includes not just the gluttonous US, but the rest of the world too. Then, and only then, we will not subject the world to man-made catastrophe.
In ancient times, people sacrificed chickens, goats, and people to appease the sun god, and if it was done often enough, rain would come. How awful, we say today. They had not thought about the post hoc ergo propter hoc fallacy. Today we know better because our models are better and we have better thermometers, and we now know our world is like a greenhouse. If we can just get CO2 stabilized at the right level, regardless of the cost, we will be OK.
Or, are you less confident in the models than you appear to suggest?
I don't recall us RECORDING ice extents 11,000 years ago, but I am sure Mann and Biffra, and Jones found a way, hiring some near to be extinct Neanderthal to march up south to take some measurements. I think we tend to extrapolate and estimate, not measure extents from the past, before we took live measurements.
Anyhow the extent is greater than the last much ballyhooed maximum in 1979 the previous largest extent in the satellite age, and is the largest extent ever recorded. You get it? - we are all in fear because 1979 - a maximal year was somehow the poster for the amount of ice we should have on the planet, and now the extent is greater - crickets, and actually lies - eg new studies showing how penguins are suffering from the loss of ice, even though it has been growing, etc.
There are whole branches of mathematics and physics devoted to the statistical description of dynamic, nonlinear, and chaotic systems, their responses to forcing, etc.
chaos theory, ergodic theory, applications in civil engineering, traffic modeling, computing, etc. You can start with Lorenz and associates and follow five decades of academic work.
People don't just say "oh, it's chaotic. That sucks. Too bad there's no way to describe it or study it."
You appear to be confusing stochastic variation (interannual variation in sea ice extent) with statistical climate states and their variation and forcing. The latter is what climate models are capable of predicting, recreating, and describing. They are looking at the statistical mean state and statistical variance about it.
Maximum ice extent is generally marked by terminal moraines and the timing is recorded by carbon dating of organic materials in it. Neanderthal pictographs have limited utility. Although plant seeds and pollen might be recorded in their crap.
Don't confuse troll and blogger. Respected physicists (see e.g RG Brown, Freeman Dyson) tell us the models don't come close to modelling the climate accurately. Feline Cannonball is a troll spewing noise. No one checks anyone else's work in climate science. Hell, they don't even make their data and code available in the unlikely event that someone other than Steve Mc wanted to.
guy, you are making stuff up, and claiming I am confused, because you messed up in your post above.
When all the climate crowd is crying that ice is not to the extent it was in 1979 - an ice maximum, and now we have a bigger maximum, it says says something about their claims, expecially if you think they are " confusing stochastic variation (interannual variation in sea ice extent) with statistical climate states"
So if you are still saying I am confused, maybe the confusion comes from climate scientists attempting to confuse us about the real meaning of 1979 ice extent, no? And I am sure you have noticed that all the cry and hew about ice not near 1979 has disappeared. When disproven, climate scientists go on to the next unfounded assertion. This time the world is going to drown from West Antarctic ice, which is going to collapse into the sea due to global warming, and not the recent increase in volcanic activity under the sheet.
You are very good yourself at obfuscation - do you work in the field?
The point would be that the accuracy of a climate model doesn't depend on a particular picked metric from 2014 or 1979 (I won't go into the relevance or accuracy of your assertion). A GCM model predicts statistical mean states. A weather prediction or an El Niño prediction on the other hand is aimed at predicting short term stochastic variation.
I didn't realize you were talking to the cat. Apologies.
Touche marque.
The real danger with what this cabal of corrupt frauds has done is to create the façade of credibility with the ignorant public, built on nothing.
They refuse to release their data, they persecute and threaten those who disagree with them (and exercise plenary power at the institutions they control), and they have justified enormously dangerous and destructive economic “solutions” to what is increasingly turning out to be a non-problem.
This is an enormous historical crisis in science, and scientists have done themselves no favors by retreating to their meaningless credentialism and closed communities.
you are apparently not aware that the so-called climate models are unable to hindcast--you cannot start any of them in say 1920, put in know CO2 data, and recreate the temps of 1930, 1940, etc. further, a leading hoaxer recently proclaimed that of course the models do not coincide with observed data for the past 30 years, but that is no problem, because the models are not meant to correlate to reality anyhow,
"greatest ice extent ever recorded."?? I guess you have never seen a recreation of snowball earth or the ice maxima of the Pleistocene ice age. Ice worldwide has been in a general retreat for 20K-40K. Anchorage Alaska was under a halfmile of ice about 2000 BC.
Anthony Watts has an excellent post on Steven Goddard's recent statements. Watt said that at first he thought Goddard was seriously blundering, but as he looked into it in detail, he is agreeing generally with Goddard--
http://wattsupwiththat.com/2014/06/28/the-scientific-method-is-at-work-on-the-ushcn-temperature-data-set/