Posts tagged ‘Roy Spencer’

Why Global Warming Does Not Necessarily Translate to Daily High Temperature Records

Most folks assume that global warming results in record high daily temperatures, but this is not necessarily the case.  When your local news station blames a high temperature record on global warming, they may be wrong for two reasons.

  1.  Most of the temperature stations used by your local news channels for weather are full of urban heat island biases.  This is particularly true of the airport temperature that many local news stations use as their official reading (though to be fair UHI has much more effect on evening temperatures than temperatures at the daily high).
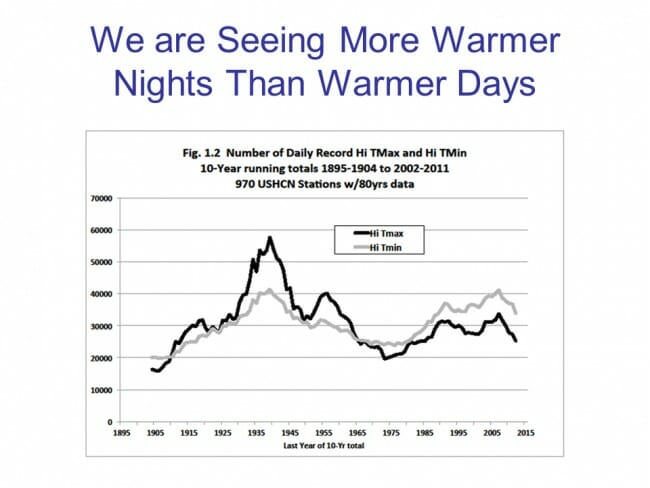
  2.  Most global warming, at least in the US where we have some of the best records, does not occur during the day -- it occurs at night

The latter point is surprising to most folks, but as a result we are not seeing an unusual number of daily high temperature records set (many were set in the 1930s and still stand).  What we are seeing instead is a large number of record high low temperature readings.  This is confusing, but basically it means that the lowest temperature that is reached at nighttime is higher than it has been in the past.  The chart below is a bit dated but still holds:

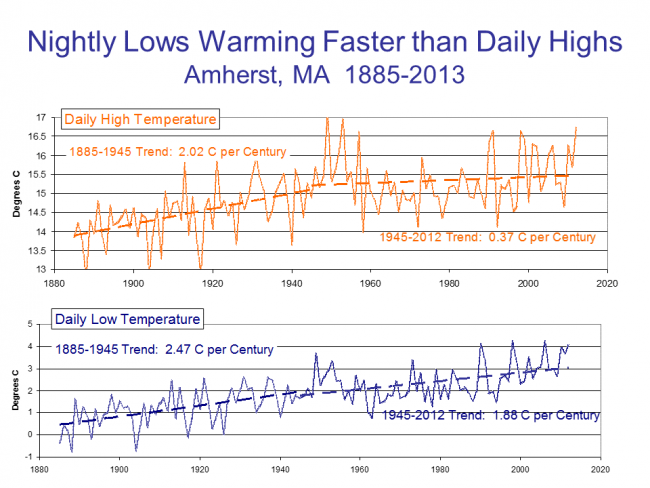
When I give presentations I try to use examples from local data.  Here is the comparison of night time warming vs. day time warming in Amherst, MA.

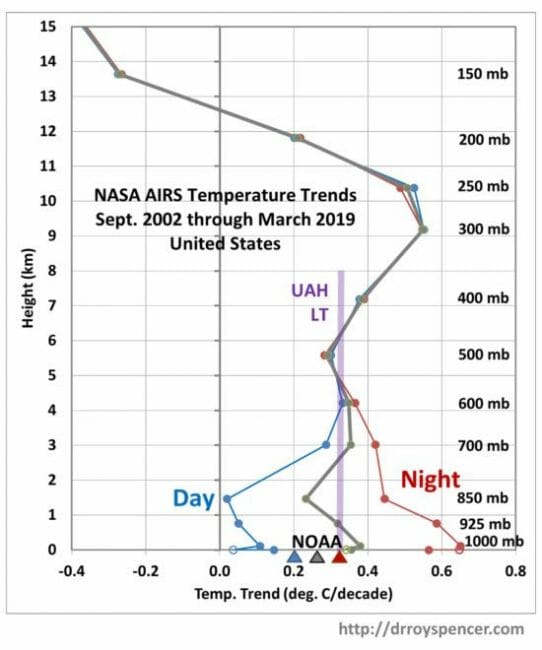
I bring this all up again because Dr. Roy Spencer has done a similar analysis for the US from the relatively new AIRS database (a satellite-based data set that avoids some of the problems of land thermometer data sets like urban heat island biases and geographic coverage gaps).  He shows this same finding, that over 80% of the warming we have seen recently in the US is at night.

This is a bit over-complicated because it is looking at temperatures through different heights of the atmosphere when most of you only care about the surface.  But you can just look at the 0 height line to see the surface warming trend.  Note that in general the data is pretty consistent with the UAH lower-troposphere temperature (satellite) and the NOAA metric (ground thermometers).

No particular point except to highlight something that is poorly understood by most folks because the media never talks about it.


Skeptics -- Don't Be That Guy Who Gets Us All Tarred as Anti-Science

Alarmists have adopted the seemingly farcical but oddly effective technique of finding the most absurd skeptic argument they can, then beating the carp out of this straw man, and then claiming that this proves that all skeptics are anti-science.

Don't believe me?  Kevin Drum did it yesterday, bravely taking on a claim -- that atmospheric CO2 concentrations have not increased in the last century -- that I have never seen a skeptic make and I am pretty active in the community.  Having beaten up on this odd, outlier position, he then claims this tars everyone who does not agree with him

Nonetheless, there you have it. In the tea party precincts of the conservative movement, even the simplest version of reality doesn't matter. If cheese denial is how you demonstrate you're part of the tribe, then anyone who denies cheese is a hero. The fact that you happen to be happily munching away on a slice of pizza at the time doesn't faze you at all.

Awesome.  So by this logic, everything Kevin Drum says about the environment is wrong because some moron environmental activists signed a petition against dihydrogen monoxide in a Penn and Teller Bullshit! episode

So, as a public service, I wanted to link to Roy Spencer's list of 10 skeptic arguments that don't hold water.  There are quality scientific arguments against catastrophic man-made warming theory.  You don't need to rely on ones that are wrong.

I agree with all of these.  I will say that I used to believe a version of #5, but I have been convinced as to why it is wrong.  However, it is still true that CO2 has a diminishing return effect on warming such that each additional molecule has less effect on warming than the last.  That is why climate sensitivity is most often shown as degrees of warming per doubling of concentration of CO2, meaning 400-800 ppm has the same effect as 800-1600ppm.

Postscript:  Drum choose to lampoon a position that is such an outlier it did not even make Spencer's list.  Spencer assumes even the craziest skeptics accept that CO2 is increasing, such that the bad science he is refuting in #7 relates to the causes of that increase.

This Is How We Get In Pointless Climate Flame Wars

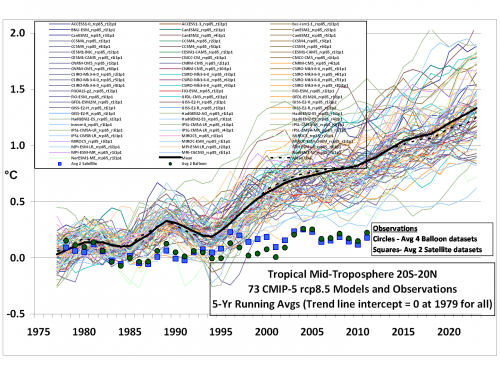
The other day I posted a graph from Roy Spencer comparing climate model predictions to actual measurements in the tropical mid-troposphere (the zone on Earth where climate models predict the most warming due to large assumed water vapor positive feedbacks).  The graph is a powerful indictment of the accuracy of climate models.

Spencer has an article (or perhaps a blog post) in the Financial Post with the same results, and includes a graph that does a pretty good job of simplifying the messy spaghetti graph in the original version.  Except for one problem.  Nowhere is it correctly labelled.  One would assume looking at it that it is a graph of global surface temperatures, which is what most folks are used to seeing in global warming articles. But in fact it is a graph of temperatures in the mid-troposphere, between 20 degrees North and 20 degrees South latitude.  He mentions that it is for tropical troposphere in the text of the article, but it is not labelled as such on the graph.  There is a very good reason for that narrow focus, but now the graph will end up on Google image search, and people will start crying "bullsh*t" because they will compare the numbers to global surface temperature data and it won't match.

I respect Spencer's work but he did not do a good job with this.

Climate Model Fail

Dr. Roy Spencer has compared the output of 73 climate models to actual recent temperature measurements.  He has focused on temperatures in the mid-troposphere in the tropics -- this is not the same as global surface temperatures but is of course related.  The reason for this focus is 1) we have some good space-based data sources for temperatures in this region that don't suffer the same biases and limitations as surface thermometers and 2) This is the zone that catastrophic anthropogenic global warming theory says should be seeing the most warming, due to positive feedback effects of water vapor.  The lines are the model results for temperatures, the dots are the actuals.

click to enlarge

As Spencer writes in an earlier post:

I continue to suspect that the main source of disagreement is that the models’ positive feedbacks are too strong…and possibly of even the wrong sign.

The lack of a tropical upper tropospheric hotspot in the observations is the main reason for the disconnect in the above plots, and as I have been pointing out this is probably rooted in differences in water vapor feedback. The models exhibit strongly positive water vapor feedback, which ends up causing a strong upper tropospheric warming response (the “hot spot”), while the observation’s lack of a hot spot would be consistent with little water vapor feedback.

The warming from manmade CO2 without positive feedbacks would be about 1.3C per doubling of CO2 concentrations, a fraction of the 3-10C predicted by these climate models.  If the climate, like most other long-term stable natural systems, is dominated by negative feedbacks, the sensitivity would be likely less than 1C.  Either way, the resulting predicted warming from manmade CO2 over the rest of this century would likely be less than 1 degree C.

More on declining estimates of climate sensitivity based on actual temperature observations rather than computer models here.

I Don't Think This is Settled

For those who have read my climate work or seen the video, the key question in climate science revolves around the feedback effects in the climate system to Co2 warming.

Skeptics, like alarmists, generally agree that a doubling of Co2 concentrations might warm the Earth about a degree Celsius, absent any other effects.  But we can imagine all sorts of feedback effects, the most important of which are in water vapor and cloud formation.  Warming that forms more clouds might have negative feedback, as clouds offset some of the warming.  Warming that increases humidity could lead to more warming, as water vapor is a strong greenhouse gas.

The difference, then, between minor warming and catastrophe is in the feedbacks, and most importantly in clouds and water vapor.  All the research the government is funding on whether warming will cause sterility in tree frogs is tangential to this key question.

And this question is far from decided.  I won't get into all the arguments here, but to the extent there is any consensus, it is that man' CO2 is probably causing some warming.  Whether this is a catastrophe or a nuisance depends on feedbacks which are not well understood.

This week there has been a lot of interesting back and forth over a paper by Roy Spencer several months ago arguing that cloud feedback was negative and would serve to limit the total amount of man-made warming.  Just how central this issue is can be seen in the fuss this paper has caused, including editors forced to resign for even daring to publish such heresy, and the speed with which a counter-paper flew through peer review.

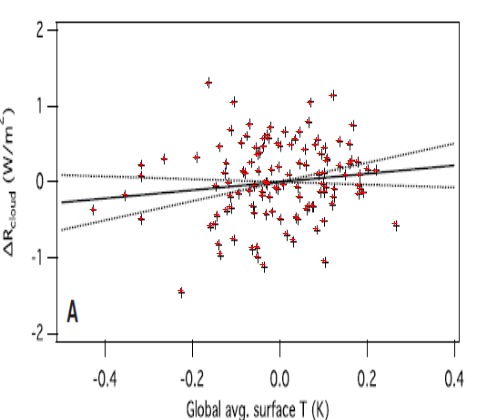
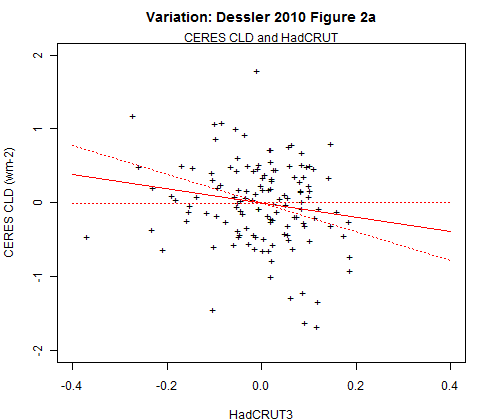
I won't get into the depths of this, except to show two charts.  The first is from Dessler in the alarmist camp, the second is the same chart but using a different data series.  I won't explain the axes,  just trust the relationship between these two variables is key to diagnosing the size and direction of feedback.

So we get opposite results (the slope of the regression) simply by using temperature and radiative flux data from to different agencies.  And note how thin the fit is in both -- basically drawing a line through a cloud.  Neither of these likely has an R-squared higher than about .05.

So there you have it, the most important question in climate - really, the only important question associated with anthropogenic global warming.  Settled science, indeed.

Skeptic's Primer

Dr. Roy Spencer has a nice primer on what climate skeptics do, and as importantly, don't believe ( a lot of straw men are being set up and knocked down recently, a tried-and-true practice of people under fire).  Good for those relatively new to the topic, though you can find most of this in more detail in my most recent video.

Explaining Temperature History

I post most of my more detailed climate work over at my other blog.  But I wanted to repost here something I wrote in response to a number of request for a brief version of what is driving global temperatures.

My sense is that medium to long scale 20th century temperature trends can be explained mostly through three drivers:

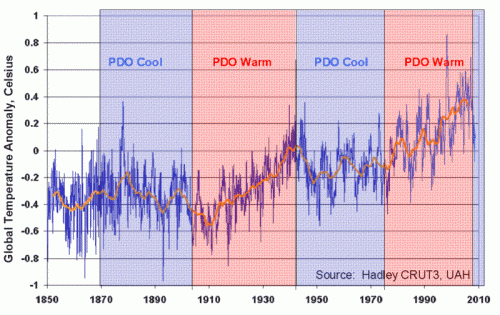
1.  A cyclical variation driven by multi-decade oceanic cycles like the Pacific Decadal Oscillation (PDO):

pdo

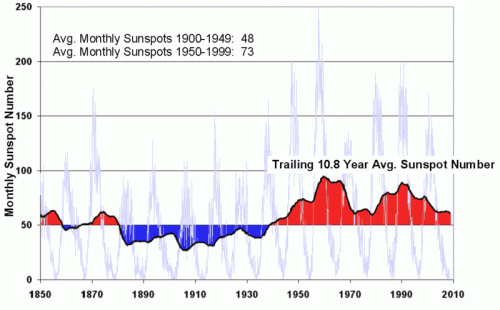
2.  Changes in solar output, either directly as increased heating or indirectly via a variety of theories on things like cosmic rays and cloud formation:

sunspot

3.  A long term trend of up to +0.05C per decade that may include a CO2-warming component.

I am willing to posit a CO2 impact net of feedbacks of perhaps 0.5-1.0C over the next century.  This may appear low, but is the only scale of number reasonably supported by history.  Any higher number would result in temperatures way too high historically.  And even assuming a number this high runs into the following problem:  There was probably a trend of about this magnitude emerging from the little ice age 200+ years ago and extending into the 20th century.  You can see it in the glacier numbers below:  (source)

glacier

Those that want to assign the temperature trend, once the sun and the PDO are removed, post-1950 to CO2, need to explain what effect was causing the nearly exact same trend from 1800-1950, and why that trend conveniently switched off at the exact moment man's CO2 takes over.  In the context of the glacier chart, what was causing the glaciers to retreat in 1880, and why is that effect not the one at work today?

With evidence that the PDO has reversed to its cool phase and that the sun may be shifting into low gear, I think it is reasonable to posit warming no more than 0.5-1.0C over the next century.  For those who have not seen it, Roy Spencer has a new paper on the PDO, clouds and temperature history.   My video on why climate models overstate future warming through absurd assumptions of high positive feedbacks is here.

Denier vs. Skeptic

We all know why Newsweek and many others (like Kevin Drum) choose to use the term "denier" for those of us who are skeptical of catastrophic anthropogenic global warming:  These media folks, who are hesitant to use the word "terrorist" because of its emotional content, want to imply that we skeptics are somehow similar to Holocaust deniers.

But beyond just the issues of false emotional content, the word denier is incorrect as applied to most skeptics, including myself, and helps man-made warming hawks avoid a difficult argument.  I try to be careful to say that I am a skeptic of "catastrophic man-made (or anthropogenic) global warming theory." 

  • So, does that mean I think the world is not warming?  In fact, the evidence is pretty clear that it is warming (though perhaps not by as much as shown in current surface temperature databases).
  • So does this mean that I think that human activities are not causing some warming?  In fact, I do think man-made CO2 is causing some, but not all the current 20th century warming trend.  I also think that man's land use  (urbanization, irrigated agriculture, etc) has effects on climate.

Where I really get skeptical is the next proposition -- that man's burning of fossil fuels is going to cause warming in the next century that will carry catastrophic impacts, and that these negative effects will justify massive current spending and government interventions (that will have their own negative consequences in terms of lost economic growth, increased poverty, and reduction in freedoms). 

Strong supporters of catastrophic man-made global warming theory do not usually want to argue this last point.  It is much easier to argue points 1 and 2, because the science is pretty good that the earth has warmed (though the magnitude is in question) and that CO2 greenhouse effect does cause warming (though the magnitude is in question).  That is why skeptics are called deniers.  It is in effect a straw man that allows greenhouse supporters to stay on 1 and 2 without getting into the real meat of the question.

Here is a quick example to prove my point.  Follow me for three paragraphs, then ask yourself if you have ever heard any of this in the media or on any RealClimate-type site's FAQ.

Anthropogenic global warming hawks admit that the warming solely from the CO2 greenhouse effect will likely NOT rise to catastrophic levels.  So how do they get such big, scary forecasts?  The answer is positive feedback.

Almost every process you can think of in nature operates by negative
feedback, meaning that an input to a system is damped.  Roll a ball, and eventually friction and wind resistance
bring
it to a stop.    Positive feedback means that an input to the system is multiplied and increased.  Negative feedback is a ball in the bottom of a bowl, always returning to the center; positive feedback is a ball perched precariously at the top of a
mountain that will run faster and faster downhill with a tiny push. Positive feedback
breeds instability, and processes that operate by positive feedback are
dangerous, and usually end up in extreme states -- these processes tend
to
"run away" like the ball rolling down the hill.  Nuclear fission, for
example, is a positive feedback process. 

Current catastrophic man-made global warming theory asserts that our climate is dominated
by positive feedback.  The last UN IPCC report posits that a small increase in
temperature from CO2 is multiplied 2,3,4 times or more by positive
feedbacks like humidity and ice albedo.   So a modest degree or degree and a half of warming from the greenhouse effect becomes a scary five or eight degrees of warming in the next century once any number of hypothesized positive feedbacks are applied.  Add to this exaggerated, sometimes over-the-top visions of possible negative consequences, and that is how global warming hawks justify massive government action.

OK, that is a very brief description of what I consider a sophisticated reason to be skeptical:  Most catastrophic warming forecasts depend on positive feedback loops, feedbacks for which we have little or no evidence and which don't tend to dominate in other stable systems.  So how many times have you seen this issue discussed?  Zero?  Yeah, its so much easier just to call us deniers.

If you are interested, here is slightly longer version of my skeptic's point of view.  Here is my much longer version.  Here is the specific chapter that discusses feedback loops.  Here is Roy Spencer discussing problems with studies trying to measure these feedbacks.

Postscript:  By the way, it is in this context that the discussions about restating temperatures and problems with historical surface temperature measurements are important.  Exaggerated historical warming numbers leave more room to posit positive feedback loops.  Lower historical numbers, or evidence past warming is driven by non-man-made sources (e.g. solar activity), leave less room to justify positive feedback loops.

Update:  RealClimate has posted their six steps to explain catastrophic warming from CO2.  Seems have buried the feedback issue.  Note that forcings mentioned here include feedbacks, they are not from CO2 alone but from CO2 + positive feedback.  Strange they didn't mention this.