Posts tagged ‘stimulus’

Number of Private Jobs Created By all Past Presidents Combined: Zero

For eight years, I had to endure articles from the Left about all the jobs Obama had created.  Now that the White House has changed hands, it is all the bloggers on the Right breathlessly reporting job creation by Trump and heralding the February job figures (example).  Though the Left is still trying to credit Obama (example)

  1.  Presidents do not create private jobs.  Period.  Even so-called infrastructure spending and stimulus merely take private money from whatever it was being used for previously and applies it to investment projects that politicians want.  Sure, there are new easy to see infrastructure jobs from these projects, but what is also there, largely unseen, are whatever jobs would have been created (or not lost) had the money used for these projects been left to private individuals to spend or invest as they see fit.
  2. Presidents do have long-term effects on prosperity, but these are usually based on regulatory and tax policy that can take years to play out -- not the span of days from January 20 to February.  The main effect government officials can have is negative, by creating drags on private enterprise.  The best they can achieve is generally removal of past negatives.
  3. To the extent individual companies credit Trump with various job growth steps, this is a function of our corporate crony state, not any underlying economic reality.  I have been at the highest levels of Fortune 50 companies (not as an executive but as a consultant and later as executive staff).  Corporations do not suddenly make changes in business strategy and capital investment plans based on elections.  They do make changes based on real changes, e.g. this tax policy was changed or that regulation was changed, none of which has yet occurred.  Of course, they may credit the new President as responsible for certain investments or changed decisions, but this is generally flattery attached to actions that would have happened anyway, or crass calculations meant to garner higher crony status in the future.

Leveraging Up The World in Good Times -- The Madness of Modern Central Banking

From the WSJ:

The European Central Bank’s corporate-bond-buying program has stirred so much action in credit markets that some investment banks and companies are creating new debt especially for the central bank to buy.

In two instances, the ECB has bought bonds directly from European companies through so-called private placements, in which debt is sold to a tight circle of buyers without the formality of a wider auction.

It is a startling example of how banks and companies are quickly adapting to the extremes of monetary policy in what is an already unconventional age. In the past decade, wide-scale purchases of government bonds—a bid to lower the cost of borrowing in the economy and persuade investors to take more risk—have become commonplace. Central banks more recently have moved to negative interest rates, flipping on their head the ancient customs of money lending. Now, they are all but inviting private actors to concoct specific things for them to buy so they can continue pumping money into the financial system.

The ECB doesn’t directly instruct companies to create specific bonds. But it makes plain that it is an eager purchaser, and it lays out the specifics of its wish list. And the ECB isn’t alone: The Bank of Japan said late last year it would buy exchange-traded funds comprising shares of companies that spend a growing amount on “physical and human capital,” essentially steering fund managers to make such ETFs available to buy.

Note that none of the criteria for the debt purchases is anything like, "the company has sensible plans for investing the money."  It is merely buying debt for debt's sake.  In the US, private companies are using most of their debt issues to buy back stock, a nearly pointless exercise that channels money from central banks to propping up equity valuations.  I wouldn't be surprised if European companies do the same.

Folks, it may not feel like it, but we are at the top of the economic cycle.   We have negative interest rates and central banks buying up every available debt issues in relatively good times, when these were formerly considered tools for the deepest point in a recession.  I am not a big believer in government stimulus, but these folks are.  What are they counting on in the bad times, when nothing will be left in the tank?

But now, we see central banks going one step further, encouraging private companies to lever up at the top of the business cycle.   Historically, this has been a formula for disaster.  The oil industry has been a preview of this.  Take ExxonMobil (XOM).  XOM, given its size, has never been very good at developing certain sorts of plays (e.g. the shale boom).  What it has done historically is use its size and balance sheet to swoop in during inevitable periods of low oil prices and producer losses to buy up developed fields at good prices.  But this time around, XOM has only had limited ability to do this, because it spent the boom years levering up its balance sheet and buying back stock.  Other large oil companies are in even more dire straights, facing real cash flow crises because, again, they levered up to repurchase stock when they should have been cleaning up their balance sheet.

The Fed Wins!

I have observed before that the central bank of every major industrialized country is trying to devalue its currency.  Since in some sense this is a zero sum game, they are all locked into a race to the bottom, a competition to see who can be most successful in hammering their consumers and individual savers in order to boost sales of their domestic companies dependent on export markets.

It looks like the US is winning!  Yay for us, we have destroyed our currency the fastest!  Our government has been most successful in making our domestic consumers relatively poorer vs. those of other nations.  Who says the Obama Administration can't do anything right?

The article goes on to point out something I have been saying for years -- that the unprecedented monetary and fiscal stimulus steps that governments are taking today at the peak of the economic cycle (though admittedly a relatively weak peak) is going to leave the tank completely empty when it comes to the next downturn.

While the ECB’s initial move to cut interest rates into negative territory in June 2014 sparked a sharp plunge in the euro, further cuts last December and last week have had little effect on the currency.

“The ECB’s hand has been played out,” said Alan Ruskin, head of G-10 foreign-exchange strategy at Deutsche Bank AG. “The currency market isn’t as responsive to the ECB anymore.”

Similarly, markets have ignored the Bank of Japan’s hints at its monetary-policy meeting this week of more rate cuts to come. Not only has the mechanism transmitting ultraloose policy into the real economy appeared to be broken, but some unconventional policy tools—such as negative interest rates—have been deleterious to banks and rattled financial markets.

And maybe that's OK - maybe at some point some government starts thinking about fixing structural regulation, taxation, and government resource reallocation policies that are the true source of economic weakness.

Keynesians Have Shot Their Only Bolt -- How Will They Spend Their Way Through The Next Crisis?

Governments have spent so much, to so little effect, to try to stimulate the current economy, I wonder where they will find the resources to spend more the next time?  Because you can be sure that despite the fact that we are likely near the top of a weak cycle, no one is paying back what was spent in the last recession or proposing to reduce central bank balance sheets.

This is a couple of years old, but tells the story pretty well:

The financial crisis that began in late 2007, with its mix of liquidity crunch, decreased tax revenues, huge economic stimulus programs, recapitalizations of banks and so on and so forth, led to a dramatic increase in the public debt for most advanced economies. Public debt as a percent of GDP in OECD countries as a whole went from hovering around 70% throughout the 1990s to almost 110% in 2012. It is now projected to grow to 112.5% of GDP by 2014, possibly rising even higher in the following years. This trend is visible not only in countries with a history of debt problems - such as Japan, Italy, Belgium and Greece - but also in countries where it was relatively low before the crisis - such as the US, UK, France, Portugal and Ireland.

So over a third of the debt that has been built up in all of history by Western nations was added in just a few years from 2007-2012.  At the same time, the central banks of these countries were adding to their balance sheets like crazy, essentially printing money in addition to this deficit spending.  In the US, the Fed's balance sheet as a percent of GDP hovered around 6% until the second half of 2008.   That had tripled to over 18% in 2012 (source).  At the same time, European central bank assets grew from about 7% to over 16% of GDP.

James Taranto has a regular feature named after a reporter named Fox Butterfield.  The feature takes statements such as "Despite Mary getting a PhD in Peruvian gender studies from Harvard, she has struggled to find a job" and argues that the "despite" should be replaced by "because".

This is certainly true of the statement that "despite record stimulus and Fed balance sheet expansion, the economy has remained sluggish".  That "despite" should be "because of".  The government continues to distort the allocation of capital and wonders why investment is sluggish and tends towards bubbles in certain assets.  Japan has stimulated for 25 years to absurd levels of debt and has gotten 25 years of sluggishness in return.

All this reminds me of a story in one of my favorite business books, "Barbarians at the Gate."  Back in the day, tobacco companies had a practice of jamming inventory into the channel just ahead of the semi-annual price increase.   They called this "loading."  The channel liked it because they got cheap product to sell at the new higher prices.  The tobacco companies liked it because it boosted quarterly revenues at the end of the quarter.  But that boost only happens once.  To show growth the next quarter, one must load even more.  Over time, they were jamming huge amounts of inventory into the channel.  I have never been a smoker, but apparently freshness is an issue with cigarettes and they can go stale.  Eventually, the company was loading so much their sales started to drop because everyone was buying stale cigarettes.

In find this a powerful metaphor for government interventions in the economy today.

Postscript:  I will give another example.  In Arizona, we are on a July-June fiscal year.  Years ago, some government yahoo had the bright idea to close a budget hole by passing a law that all businesses had to pre-pay their estimate of sales taxes due in July a month earlier in June.  For that one glorious year, politicians had 13 months of revenue to spend rather than 12.

But to set things aright the next year, they would have to live with just 11 months of revenue.  No way they were going to do that!  So they did the pull-forward thing again to get a full 12 months.  And they have done it every year since.  It has become an institution.  All this costs a ton of money to process, as the state must essentially process a 13th return each year, presumably paying overtime and temp costs to do it.  All for the benefit of one year where they got the use of one month of revenue early, we have been stuck with higher state operating costs forever.

It's Not A Market Failure When People Avoid a Crappy Investment

Environmentalists often claim that people systematically under-invest in energy conservation, something they call a market failure.   This is why Obama and the Left put in a much heralded provision in the stimulus package that used Federal money to subsidize home energy conservation (new windows and insulation and such).

A new study in the NBER looks at the results.  This is the abstract:

Conventional wisdom suggests that energy efficiency (EE) policies are beneficial because they induce investments that pay for themselves and lead to emissions reductions. However, this belief is primarily based on projections from engineering models. This paper reports on the results of an experimental evaluation of the nation’s largest residential EE program conducted on a sample of more than 30,000 households. The findings suggest that the upfront investment costs are about twice the actual energy savings. Further, the model-projected savings are roughly 2.5 times the actual savings. While this might be attributed to the “rebound” effect – when demand for energy end uses increases as a result of greater efficiency – the paper fails to find evidence of significantly higher indoor temperatures at weatherized homes. Even when accounting for the broader societal benefits of energy efficiency investments, the costs still substantially outweigh the benefits; the average rate of return is approximately -9.5% annually.

The only failure here is the government diverting capital from productive uses into money-losing ventures like this one.

Republicans Are Crazy for Wanting Dynamic Scoring at the CBO

Dynamic scoring of budget proposals has been on the Republican wish list for decades.  They have always been frustrated that tax cut proposals look like such budget losers with static scoring.  In their supply-side bones, Republicans know that tax cuts will stimulate economic activity and thus increase future tax revenues.  Taking this second order effect into account is what they mean by dynamic scoring (see: Laffer Curve).

I have some sympathy for this argument, but in making it Republicans are falling for the "this will work great when our guys are in charge" fallacy  (I need to find a name for that).  Democrats fall into this all the time, expanding government power only to be shocked at what their political enemies do with this power once in charge.

Because it is pretty clear what dynamic scoring will mean in a Democratic Congress.  Remember that stimulus bill?  Democrats all thought that expanded the economy, so its costs would, by their Keynesian assumptions, appear much lower under dynamic scoring.  The Left thinks the auto bailout was stimulative.  They even think that Obamacare was stimulative.  Do you really want some BS Keynesian fudge factor obscuring the true cost of such proposals in the future?

Related:  Greg Mankiw discusses why, if I read him right, dynamic scoring is impossible to do correctly


Question for Keynesians: What Are You Doing To Prepare for the Next Cycle?

When I was in school learning macro 101 from Baumol and Blinder, my memory is that the theory of Keynesian stimulus and managing the economic cycle was that deficits should be run in the bottom part of the economic cycle, paid for with surpluses in the top half.   So we are now almost certainly in the top half of the cycle.  But I don't hear any Keynesians seeking to run a surplus, or even to dial back on government deficits or spending.  In fact, our Keynesian-in-chief says he is done with "mindless austerity" and wants to start spending even harder in 2015.

Its enough to make one suspicious that all the stimulus talk is just a Trojan Horse for a desire to increase the size and power of government.

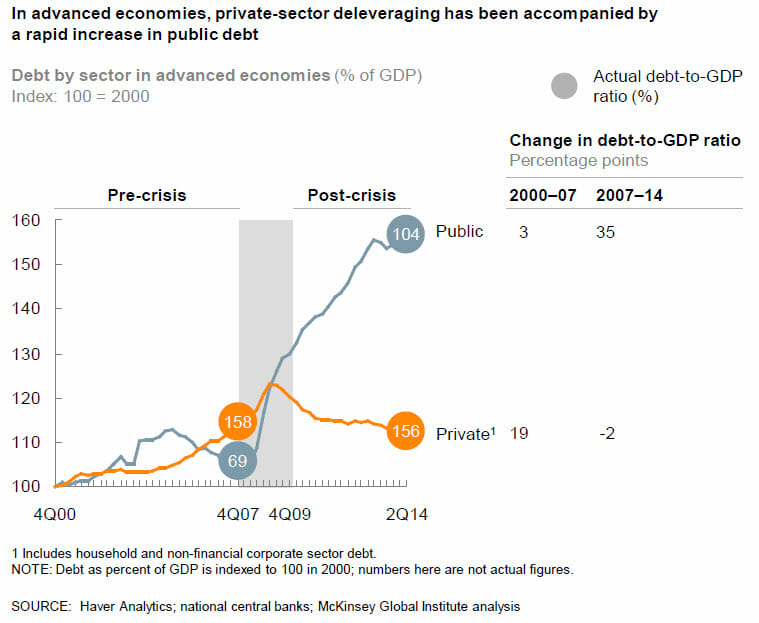
But for Keynesians who really believe what they are saying, that deficit spending somehow saved us from a depression in 2009 and 2010, then I ask you -- what are you going to do next time?  It appears that when we enter the next recession in this country, that US debt as a percentage of GDP is going to be almost twice what it was entering the last recession.  Don't you worry that this limits your flexibility and ability to ramp up deficit spending in the next recession?

The situation in the US is the same as it is worldwide.  While those evil private short-term-focused private actors have used the improving economy to de-leverage back below 2007 levels, governments have increased their debt as a percentage of GDP by just over 50% since just before the last recession.

20150205_debt1


Since 2007, according to my old friends at McKinsey, global government debt has risen by $25 trillion since 2007.  If you really care about Keynesian stimulus in recessions, and not just "mindlessly" (I can use that term too) increase government spending, wouldn't you want to be building up some reserves for next time?

Infrastructure Bait and Switch

President Obama wants to spend something like a half trillion incremental dollars on "infrastructure".  I have found that these initiatives to sell infrastructure tend to be great bait and switch programs.  Infrastructure is generally the one type of government spending that polls well across all parties and demographics.  So it is used by government officials to pass big spending increases, but in fact what really happens is that the government takes a wish-list of stuff that most of the public would not be OK with increasing spending on, then they put a few infrastructure projects on top like a cherry to sell the thing.  They call it an "infrastructure" program when in fact it is no such thing.

Obama would never do that, right?  Hope and change?  In fact, he already has.  The first time around he sold the stimulus bill as mainly an infrastructure spending bill -- remember all that talk of shovel-ready projects?   Only a trivial percentage of that bill was infrastructure.  At most 6% was infrastructure, and in practice a lot less since Obama admitted later there were no shovel-ready projects.   (also here).  The rest of it was mainly stuff like salary support for state government officials.  Do you think he would have as easily sold the "wage support for state government officials" bill in the depth of a recession?  No way, so he called it, falsely, an infrastructure bill.

The other bait and switch that occurs is within the infrastructure category.  We have seen this at the state level in AZ several times.  Politicians love light rail, for some reason I do not understand, perhaps because it increases their personal power in a way that individual driving does not.  Anyway, they always want money for light rail projects, but bills to fund light rail almost always fail.  So they tack on a few highway projects, that people really want, call it a highway bill and pass it that way.  But it turns out most of the money is for non-highway stuff.  That is the other bait and switch that occurs.

Expect to see both of these with the new infrastructure proposal.

By the way, Randal O'Toole has a nice summary of the drawbacks of light rail and trolley spending

For the past two decades or so, however, much of our transportation spending has focused on infrastructure that is slower, more expensive, less convenient, and often more dangerous than before. Too many cities have given up on trying to relieve congestion. Instead, they have allowed it to grow while they spend transportation dollars (nearly all paid by auto users) on other forms of travel such as rail transit. Such transportation is:

  • Slower: Where highway speeds even in congested cities average 35 miles per hour or more, the rail transit lines built with federal dollars mostly average 15 to 20 mph.
  • More expensive: In 2013, Americans auto users spent less than 45 cents per vehicle mile (which means, at average occupanies of 1.67 people per car, about 26 cents per passenger mile), and subsidies to roads average under a penny per passenger mile. By comparison, transit fares are also about 26 cents per passenger mile, but subsidies are 75 cents per passenger mile.
  • Less convenient: Autos can go door to door, while transit requires people to walk or use other forms of travel, often at both ends of the transit trip.
  • Less safe: For every billion passenger miles carried, urban auto accidents kill about 5 people, while light rail kills about 12 people and commuter trains kill 9. Only subways and elevateds are marginally safer than auto travel, at 4.5, but we haven’t built many of those lately.

Keynesian Moving Target on What Constitutes Austerity

The other day I said I was confused by what exactly creates Keynesian stimulus, and in reverse, what constitutes austerity.  I had thought that it was deficit spending that creates the stimulus, but then sometimes it seems to just be spending and in the case of the Kevin Drum post I was discussing, he says it is not the level of spending but only the first derivative of per capita real government spending (with no reference to whether it is debt or tax funded) that matters.

I figured that I was just confused because I had not formally studied economics past my undergrad years, but apparently practicing economists are also confused.  Here is Scott Sumner:

What is the proper measure of austerity?  The textbooks talk about deficits.  But most of the Keynesian bloggers focus on government purchases.  So which is it?  And if it’s purchases, why did these same bloggers claim that austerity would result from big tax increases in the US in 2013, and a big tax increase in Japan in 2014?  And why does the measure chosen (ex post) usually seem to be the one that best supports their argument in that particular case?

As a postscript, I will add that every climate skeptic can totally empathize with this Sumner concern:

A number of Keynesian bloggers have recently expressed dismay that the rest of us don’t buy their model.  Maybe it would help if they’d stop ignoring our criticisms of their model, and respond to our complaints.

The Big Government Trap: Does Stimulus Require Government Spending to Continuously Rise?

There has been a lot of back and forth over the last few years about "austerity".  I have wondered how government spending levels over the last few years that dwarf any peacetime levels in history could be called "austerity", but that is exactly what folks like Paul Krugman have been doing.   Apparently, the new theory is that the level of spending is irrelevant to stimulus, and only the first derivative matters.  In other words, high spending is not stimulative unless it is also increasing year by year.   Kevin Drum provides an explanation of this position:

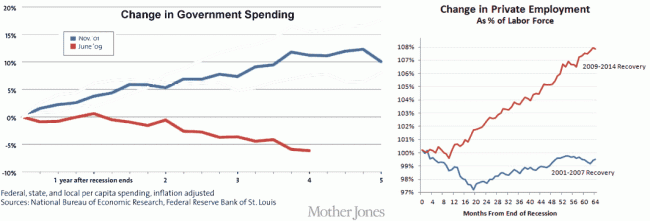
Austerity is all about the trajectory of government spending, and this is what it looks like. You can argue about whether flat spending represents austerity, but a sustained decline counts in anyone's book. The story here is simple: for a little while, in 2009 and 2010, stimulus spending partially offset state and local cuts, but by the end of 2010 the stimulus had run its course. From then on, the drop in government expenditures was steady and significant. It was also unprecedented. If you run this chart back for 50 years you'll never see anything like it. In all previous recessions and their aftermaths, government spending rose.

blog_total_govt_expenditures_per_capita_inflation

So, by this theory of stimulus, the fact that we spent substantially more money in 2010-2014 than in pre-recession years (and are still spending more money) turns out not to be stimulative.  The only way government can stimulate the economy is to increase year-over-year per capital real spending every single year.

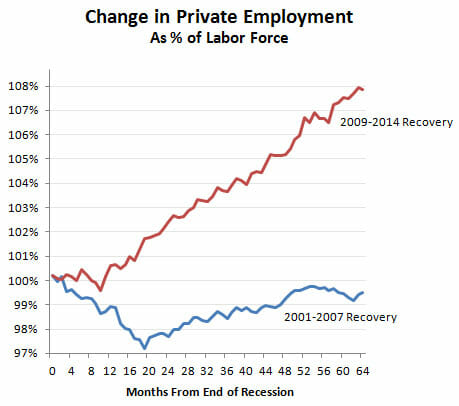
I will leave macro theory (of which I am increasingly skeptical) to the Phd's.  In this case however, Drum's narrative is undermined by his own chart he published a few weeks ago:

blog_private_employment_2001_vs_2010

In his recent austerity article quoted above, he describes a sluggish recovery with a step-change in 2014 only after "austerity" ends.  But his chart from a few weeks earlier shows a steady recovery from 2010-2014, right through his "austerity" period.  In fact, during the Bush recovery he derides, we actually did do exactly what he thinks is stimulative, ie increase government spending per capita steadily year by year.  How do we know this?  From another Drum chart, this one from last year.  I changed the colors (described in this article) and compared his two charts:

click to enlarge


By Drum's austerity theory, the Bush spending was stimulative but the Obama spending was austerity.  But the chart on the right sure makes it look like the Obama recovery is stronger than the Bush recovery.


A better explanation of the data is that a recession driven by the highly-leveraged mis-allocation of too much capital to home real estate was made worse in 2008-2009 by a massive increase in government spending, which is almost by definition a further mis-allocation of capital (government is taking money from where the private sector thinks it should be invested and moves it to where politicians think it should be spent).  The economy has recovered as that increase in government spending has been unwound.

Want to Make Your Reputation in Academia? Here is an Important Class of Problem For Which We Have No Solution Approach

Here is the problem:  There exists a highly dynamic, multi- multi- variable system.  One input is changed.  How much, and in what ways, did that change affect the system?

Here are two examples:

  • The government makes a trillion dollars in deficit spending to try to boost the economy.  Did it do so?  By how much? (This Reason article got me thinking about it)
  • Man's actions increase the amount of CO2 in the atmosphere.  We are fairly confident that this has some warming effect, but how how much?  There are big policy differences between the response to a lot and a little.

The difficulty, of course, is that there is no way to do a controlled study, and while one's studied variable is changing, so are thousands, even millions of others.  These two examples have a number of things in common:

  • We know feedbacks play a large role in the answer, but the system is so hard to pin down that we are not even sure of the sign, much less the magnitude, of the feedback.  Do positive feedbacks such as ice melting and cloud formation multiply CO2 warming many times, or is warming offset by negative feedback from things like cloud formation?  Similarly in the economy, does deficit spending get multiplied many times as the money gets respent over and over, or is it offset by declines in other categories of spending like business investment?
  • In both examples, we have recent cases where the system has not behaved as expected (at least by some).  The economy remained at best flat after the recent stimulus.  We have not seen global temperatures increase for 15-20 years despite a lot of CO2 prodcution.  Are these evidence that the hypothesized relationship between cause and effect does not exist (or is small), or simply evidence that other effects independently drove the system in the opposite direction such that, for example, the economy would have been even worse without the stimulus or the world would have cooled without CO2 additions.
  • In both examples, we use computer models not only to predict the future, but to explain the past.  When the government said that the stimulus had worked, they did so based on a computer model whose core assumptions were that stimulus works.  In both fields, we get this sort of circular proof, with the output of computer models that assume a causal relationship being used to prove the causal relationship

So, for those of you who may think that we are at the end of math (or science), here is a class of problem that is clearly, just from these two examples, enormously important.  And we cannot solve it -- we can't even come close, despite the hubris of Paul Krugman or Michael Mann who may argue differently.    We are explaining fire with Phlogiston.

I have no idea where the solution lies.  Perhaps all we can hope for is a Goedel to tell us the problem is impossible to solve so stop trying.  Perhaps the seeds of a solution exist but they are buried in another discipline (God knows the climate science field often lacks even the most basic connection to math and statistics knowledge).

Maybe I am missing something, but who is even working on this?  By "working on it" I do not mean trying to build incrementally "better" economics or climate models.  Plenty of folks doing that.  But who is working on new approaches to tease out relationships in complex multi-variable systems?

Windows 8 Even Worse Than I Thought

Up to this point, after some initial bad impressions trying Windows 8 briefly, I have avoided it like the plague.  However, my son needed a new laptop and the only ones that really met our requirements only came in Windows 8 flavors, so we bought one.

What an awful mess.  The system boots up into a tiled mess that looks like some cheesy website covered in moving gifs and viagra ads.  To make matters worse, nothing on this tablet-based interface is organized at all logically.  The interface is like the room of an ADD child that dropped all of his toys and books in random spots.  I am sure these tiles have some sort of navigation paradigm, but it is completely different from any used in past windows versions.  I could not, for example, figure out how to easily exit the store except to alt-tab out (there is no exit or quit option and right-click context menus which are one of the great advantages of windows over mac don't seem to work a lot of the time).  Again, I am sure there is some way to do it, but I have no idea what it is and no desire to learn new navigation commands.  Perhaps Microsoft intends that one use a gamepad instead of a mouse -- I would not be surprised at this point.

Unlike older versions of windows, windows update did not run automatically at first bootup.  I knew from past experience there were likely dozens of security patches I needed to install right away.  I hunted for quite a while just to find the windows control panel (so I could run windows update).  It was buried in a sub-menu of a toolbar on the right side of the screen that only pops up if you find a tiny (unmarked) spot in the corner of the screen with your mouse.   It amazes me that anyone thought replacing the start button with an unmarked spot on the screen was a good idea.

Of course, the control panel is called something entirely different now, but I did eventually find windows update and there were, as expected, over 70 security patches that needed to be installed.  But for some reason they would not download immediately, but kept giving me a message that they would be downloaded at some future indeterminate date.  I finally found a way to force them to download.

My next step was to get rid of the stupid application tile interface and get the computer to boot directly to desktop and get the old start button back.  This requires a free upgrade to windows 8.1, but there is no obvious way to do this, even through windows update.  I finally had to search the internet to find the link.  This sent me into the windows 8 app store.  What a total mess that is!  If anything, it is more poorly organized than the Apple app store.  Like the Apple store, it seems aimed at people who want to browse applications virtually at random rather than find something specific.  Incredibly, there is no search function.  Yes, I know, I have to be wrong about that, but I scrolled all over that damn storefront and cannot find a search box.

So I cannot actually find the Windows 8.1 upgrade.  The web site tells me that I should be presented with a prominent option to download it in the store, but I am not.  It is nowhere to be found.  I found an FAQ somewhere that suggested that I would not be offered the 8.1 upgrade if my 8.0 installation is missing certain patches, so I am going back to windows update to see if there is something I am still missing.

I was wrong about windows 8 -- I once wrote it was bad but perhaps not as bad as Vista or ME.  But it is.  This is the worst thing I have ever seen come out of Microsoft.  It is inexplicable that this company with such a strong market share in the business world could saddle its flagship OS with an interface more appropriate to an XBOX.

In the past, I have said that I would not want a desktop with a tablet interface.  But at the end of the day, I would not want a tablet with this interface.  Perhaps with hours of work, I will make this computer usable.  Who would have ever thought I would have longed for the day when I had to spend an hour with a new computer removing bloatware.  Now I have to spend a day trying to emulate the windows 7 experience on windows 8.

People have developed many hypotheses for the lingering recession.  Some say it was too small a stimulus.  Some blame the sequester.  I blame the Windows 8 launch, which I think has a lot to do with suppressing PC sales and thus much of the electronics and retailing sector.

Trading $1 in Debt for 85 cents of Economic Activity

UPDATE:  Mea culpa.  One point in the original post was dead wrong.  It is possible, contrary to what I wrote below, to get something like a 0.7%  difference in annual growth rates with the assumptions he has in the chart below (Drum still exaggerated when he called it 1%).  I don't know if the model is valid (I have little faith in any macro models) but I was wrong on this claim.  Using the 0.7% and working more carefully by quarter we get a cumulative GDP addition a bit lower than the cumulative debt addition.  There is still obviously a reasonable question even at a multiplier near 1 whether $1 of economic activity today is worth $1 of debt repayment plus interest in the future.  

I am not a believer, obviously, in cyclical tweaking of the economy by the Feds.  To my thinking, the last recession was caused by a massive government-driven mis-allocation of capital so further heavy-handed government allocation of capital seems like a poor solution.  But what really drives me crazy is that most folks on the Left will seductively argue that now is not the time to reduce debt levels, implying sometime in the future when the economy is better will be the appropriate time.  But when, in any expansion, have you heard anyone on the Left say, "hey, its time to reduce spending and cut debt because we need the fiscal flexibility next time the economy goes wrong."

I will leave the stuff in error below in the post because I don't think it is right to disappear mistakes.  For transparency, my spreadsheet reconstruction both confirming the 0.7% and with the updated numbers below is here:   reconstruction.xls.


Kevin Drum is flogging the austerity horse again

I see that Macroecomic Advisors has produced a comprehensive estimate of the total effect of bad fiscal policies. Their conclusion: austerity policies since the start of 2011 have cut GDP growth by about 1 percentage point per year.

Something seemed odd to me -- when I opened up the linked study, it said the "lost" government discretionary spending is about 2% of GDP.  Is Drum really arguing that we should be spending 2% of GDP to increase GDP by 1%?

Of course, the math does not work quite this way given compounding and such, but it did cause me to check things out.  The first thing I learned is that Drum partook of some creative rounding.  The study actually said reductions in discretionary spending as a percent of GDP reduced GDP growth rates since the beginning of 2011 by 0.7% a year, not 1% (the study does mention a 1% number but this includes other effects as well).

But it is weirder than that, because here is the chart in the study that is supposed to support the 0.7% number:

click to enlarge

Note that in the quarterly data, only 2 quarters appear to show a 0.7% difference and all the others are less.  I understand that compounding can do weird things, but how can the string of numbers represented by the green bars net to 0.7%?  What it looks like they did is just read off the last bar, which would be appropriate if they were doing some sort of cumulative model, but that is not how the chart is built.  If we interpolate actual values and are relatively careful about getting the compounding right, the difference is actually about 0.45%.  So now we are down to less than half the number Drum quoted see update above (I sent an email to the study author for clarification but have not heard back.  Update:  he was nice enough to send me a quick email).

So let's accept this 0.45% 0.7% number for a moment.  If GDP started somewhere around 16 trillion in 2010, if we apply a 0.45% the quarterly growth numbers from his chart, we get an incremental economic activity from 2011 through 2013:Q2 of about $333 billion.

So now look at the spending side.  The source says that discretionary spending fell by about 2% of GDP over this period.  From the graph above, it seems to bite pretty early, but we will assume it fell 1/12 of this 2% figure each quarter, so that by the end of 2013 or beginning of 2014 we get a fall in spending by 2% of GDP.  Cumulatively, this would be a reduction in spending over the 2.5 years vs. some "non-austere" benchmark of $388 billion.

Thus, in exchange for running up $677 billion $388 billion in additional debt, we would have had $445 billion $333 billion in incremental economic activity.  A couple of reactions:

  1. Having the government borrow money and spend it definitely increases near-term GDP.  No one disputes that.  It is not even in question.  Those of us who favor reigning in government spending acknowledge this.  The question is, at what cost in terms of future obligations.  In fact, this very study Drum is quoting says

    Economists agree that failure to shrink prospective deficits and debt will bestow significant economic consequences and risks on future generations. Federal deficits drive up interest rates, “crowding out” private investment. If government borrowing supports consumption (e.g., through Social Security and major health programs) rather than public investment, the nation’s overall capital stock declines, undermining our standard of living. The process is slow but the eventual impact is large.2 In addition, accumulating debt raises the risk of a fiscal crisis. No one can say when this might occur but, unlike crowding out, a debt crisis could develop unexpectedly once debt reached high levels.

    High deficits and debt also undermine the efficacy of macroeconomic policies and reduce policymakers’ flexibility to respond to unexpected events. For example, in a recession, it would be harder to provide fiscal stimulus if deficits and debt already were high. Furthermore, fiscal stimulus might be less effective then. Additional deficit spending could be seen as pushing the nation closer to crisis, thereby forcing up interest rates and undercutting the effects of the stimulus. With fiscal policy hamstrung, the burden of counter-cyclical policy is thrust on the Federal Open Market Committee (FOMC) but, particularly in a low interest-rate environment, the FOMC may be unable (or unwilling) to provide additional monetary
    stimulus.

  2. I guess we have pretty much given up on the >1 multiplier, huh?  Beggaring our children for incremental economic growth today is a risky enough strategy, but particularly so with the implied .66 .85 multiplier here.

This is not the first time Drum has taken, uh, creative data approaches to cry "austerity" during a mad spending spree. 

Keynesian Multiplier of 0.05

So much for that Keynesian stimulus notion (emphasis in the original)

With everyone focused on the 5th anniversary of the Lehman failure, we are taking a quick look at how the world's developed (G7) nations have fared since 2008, and just what the cost to restore "stability" has been. In a nutshell: the G7 have added around $18tn of consolidated debt to a record $140 trillion, relative to only $1tn of nominal GDP activity and nearly $5tn of G7 central bank balance sheet expansion (Fed+BoJ+BoE+ECB). In other words, over the past five years in the developed world, it took $18 dollars of debt (of which 28% was provided by central banks) to generate $1 of growth. For all talk of "deleveraging" G7 consolidated debt has been at a record high 440% for the past four years.

The theory of stimulus -- taking money out of the productive economy, where it is spent based on the information of hundreds of millions of people as to the relative value of millions of potential investments, and handing it to the government to spend based on political calculus -- never made a lick of sense to me.  I guess I would have assumed the multiplier in the short term was fractional but at least close to one, indicating in the short run that if we borrow and dump the money into the economy we would get some short-term growth, only to have to pay the piper later.  But we are not even seeing this.

European Auster-Yeti

There are people who will swear to this day that, despite all evidence to the contrary, Bigfoot exists and they have seen it.  Paul Krugman similarly is just sure he has seen European austerity.  The rest of us are left scratching our heads for the evidence -- he doesn't even have a blurry photo or footprint.  Just tales from a friend of a friend, who is not only sure there has been austerity, but that it caused an old lady to dry her cat in a microwave and that if you swim 20 minutes after eating you will get cramps.

The official Keynesian story is that the PIIGS of Europe (Portugal, Italy, Ireland, Greece and Spain) have been devastated by cutbacks in public spending. Austerity has made things worse rather than better – clear proof that Keynesian stimulus is the answer. Keynesians claim the lack of stimulus (of course paid for by someone else) has spawned costly recessions which threaten to spread.  In other words, watch out Germany and Scandinavia: If you don’t pony up, you’ll be next.

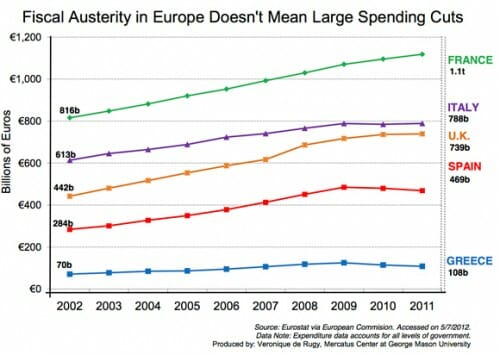
Erber finds fault with this Keynesian narrative. The official figures show that PIIGS governments embarked on massive spending sprees between 2000 and 2008. During this period, their combined general government expenditures rose from 775 billion Euros to 1.3 trillion – a 75 percent increase. Ireland had the largest percentage increase (130 percent), and Italy the smallest (40 percent). These spending binges gave public sector workers generous salaries and benefits, paid for bridges to nowhere, and financed a gold-plated transfer state. What the state gave has proven hard to take away as the riots in Southern Europe show.

Then in 2008, the financial crisis hit. No one wanted to lend to the insolvent PIIGS, and, according to the Keynesian narrative, the PIIGS were forced into extreme austerity by their miserly neighbors to the north. Instead of the stimulus they desperately needed, the PIIGS economies were wrecked by austerity.

Not so according to the official European statistics. Between the onset of the crisis in 2008 and 2011, PIIGS government spending increased by six percent from an already high plateau.  Eurostat’sprojections (which make the unlikely assumption that the PIIGS will honor the fiscal discipline promised their creditors) still show the PIIGS spending more in 2014 than at the end of their spending binge in 2008.

As  Erber wryly notes: “Austerity is everywhere but in the statistics.”

Where Did the Last Batch Go?

Obama and the Left want a big new infrastructure spending bill, based on twin theories that it would be a) stimulative and b) a bargain, as needed infrastructure could be built more cheaply with construction industry over-capacity.

Since this is exactly the same theory of the stimulus four years ago, it seems a reasonable question to ask:  What happened to the damn money we spent last time?  We were sold a 3/4 of a trillion dollar stimulus on it being mostly infrastructure.  So where is it?  Show us pictures, success stories.  Show us how the cost of construction of these projects were so much lower than expected because of construction industry over-capacity.  Show us the projects selected, to demonstrate how well thought-out the investment prioritization was.  If their arguments today have merit, all these things must be demonstrable from the last infrastructure bill.  So where is the evidence?

Of course, absolutely no one who wants to sell stimulus 2 (or 3?) wants to go down the path of investigating how well stimulus 1 was spent.  Instead, here is the argument presented:

Much of the Republican opposition to infrastructure spending has been rooted in a conviction that all government spending is a boondoggle, taxing hard-working Americans to give benefits to a favored few, and exceeding any reasonable cost estimate in the process. That's always a risk with new spending on infrastructure: that instead of the Hoover Dam and the interstate highway system, you end up with the Bridge to Nowhere and the Big Dig.

In that sense, this is a great test of whether divided democracy can work, and whether Republicans can come to the table to govern. One can easily imagine a deal: Democrats get their new infrastructure spending, and Republicans insist on a structure that requires private sector lenders to be co-investors in any projects, deploying money based on its potential return rather than where the political winds are tilting.

This is bizarre for a number of reasons.  First, he implies the problem is that Republicans are not "coming to the table to govern"  In essence  then, it is up to those who criticize government incremental infrastructure spending (with a lot of good evidence for believing so) as wasteful to come up with a solution.  Huh?

Second, he talks about requiring private lenders to be co-investors in the project.  This is a Trojan horse.   Absurd projects like California High Speed Rail are sold based on the myth that private investors will step in along side the government.  When they don't, because the project is stupid, the government claims to be in too deep already and that it must complete it with all public funds.

Third, to the extent that the government can sweeten the deal sufficiently to make private investors happy, the danger of Cronyism looms large.  You get the government pouring money into windmills, for example, that benefits private investors with a sliver of equity and large manufacturers like GE, who practically have a hotline to the folks who run programs like this.

Fourth, almost all of these projects are sure to be local in impact - ie a bridge that helps New Orleans or a street paving project that aids Los Angeles.  So why are the Feds doing this at all?  If the prices are so cheap out there, and the need for these improvements so pressing, then surely it makes more sense to do them locally.  After all, the need for them, the cost they impose, and the condition of the local construction market are all more obvious locally than back in DC.  Further, the accountability for money spent at the Federal level is terrible.  There are probably countless projects I should be pissed off about having my tax money fund, but since I don't see them every day, I don't scream.  The most accountability exists for local money spent on local projects.

Bizarre Alternate Reality

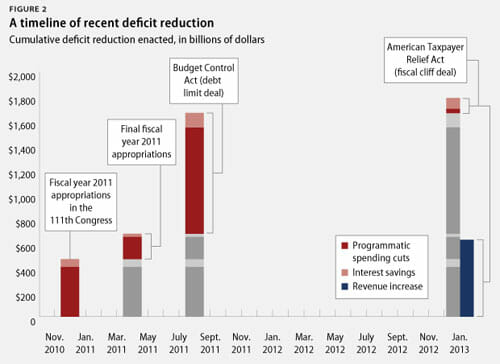
Kevin Drum is claiming that the government has already done much fine work on deficit reduction, reducing spending by $1.8 trillion and increasing taxes by $600 billion.

This is fantasy, pure and simple, and perhaps why the term "reality-based community" has fallen out of favor among Progressives.   There has been and will likely be no reduction in spending -- these "spending cuts" are merely reductions in spending growth rates from the Administration's initial wet dream spending proposals. I am sure the tax increases are probably real, but Obama and the Congress were already proposing to spend most of those in new stimulus and other boondoggles right in the end of year tax legislation.

The tax numbers are characteristic of the stupid budget games played by both parties.   For example, the recent tax law represents a tax increase over law in place on 12/31/2012, but represents a massive tax cut vs. law set to be in place on 1/1/2013.  This gives the administration cover to call it both!  When it wants to portray itself as a deficit hawk, as in this case, it was a tax increase.  When it wants to portray itself as being populist, it was a tax cut.

Charts like this are absolutely worthless.  We will likely get deficit reduction over the next few years, but it will be entirely due to rising tax revenues from an improving economy.

And here we are back to my constant theme -- if you want to posit a trend, then show the trend.

The Perfect Keynesian Stimulus

Hardcore Keynesian theory says that even paying someone to dig a hole one day and fill it in the next is stimulative.  This has always seemed insane to me -- how could it possibly be a net gain in growth and wealth to shift resources from productive activities to unproductive ones?  But in line with this theory, the Keynesians in the Obama Administration have hit on the perfect stimulus:

A cargo train filled with biofuels crossed the border between the US and Canada 24 times between the 15th of June and the 28th of June 2010; not once did it unload its cargo, yet it still earned millions of dollars... The companies “made several million dollars importing and exporting the fuel to exploit a loophole in a U.S. green energy program.” Each time the loaded train crossed the border the cargo earned its owner a certain amount of Renewable Identification Numbers (RINs), which were awarded by the US EPA to “promote and track production and importation of renewable fuels such as ethanol and biodiesel.”

Whole thing here

Words That Have Been Stripped of Any Meaning: "Spending Cuts" and "Austerity"

I have already written that the supposed European austerity (e.g. in the UK) is no such thing, and "austerity" in these cases is being used to describe what is merely a slowing in spending growth.

Apparently the same Newspeak is being applied to spending cuts in the US.  How else  can one match this data:

With these words from President Obama (my emphasis added)

"If we're going to raise revenues that are sufficient to balance with the very tough cuts that we've already made and the further reforms in entitlements that I’m prepared to make, then we’re going to have to see the rates on the top two percent go up"

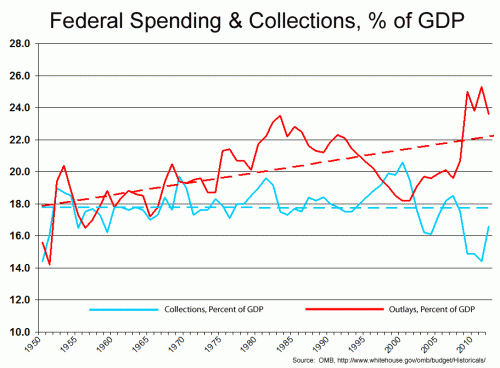
Seriously?  The only small reductions in the budget were because some supposedly one-time expenses (like TARP bailouts, war costs, and stimulus spending) were not repeated.  Allowing one-time costs to be, uh, one-time does not constitute "tough cuts."

Tough cuts are when we knock government spending back down to 19-20 percent of GDP.  Clinton level spending in exchange for Clinton tax rates.   That's my proposed deal.

On Private Job Creation, Obama and Reagan are Tied

Obama claims to have created more jobs than Reagan.  Republicans fire back with charts that say otherwise.

Here are the true numbers for private jobs created by these Presidents in office:

  • Reagan:    zero
  • Obama:     zero

Just once I would like to see a Presidential candidate answer:

"Why, I didn't create a single private job in office.  Anyone I hire is by definition a public employee.  The best I can do is to keep government out of the way, as much as possible, of the private individuals who do create new businesses and new products and new technologies that tend to lead to more private employment.  The worst thing I can do is to try to be investment-banker-in-chief.  Every dollar I hand to some company I like is money taken out of the hands of 300 million private individuals, who collectively know a hell of a lot more than I as to what makes for a better business investment  (and by the way they have far better incentives that I as well, since they are investing their own hard-earned money, and should I develop the hubris to play the stimulus game, I would be investing your hard-earned money."


"Abnormal" Events -- Droughts and Perfect Games

Most folks, and I would include myself in this, have terrible intuitions about probabilities and in particular the frequency and patterns of occurance in the tail ends of the normal distribution, what we might call "abnormal" events.  This strikes me as a particularly relevant topic as the severity of the current drought and high temperatures in the US is being used as absolute evidence of catastrophic global warming.

I am not going to get into the global warming bits in this post (though a longer post is coming).  Suffice it to say that if it is hard to accurately directly measure shifts in the mean of climate patterns given all the natural variability and noise in the weather system, it is virtually impossible to infer shifts in the mean from individual occurances of unusual events.  Events in the tails of the normal distribution are infrequent, but not impossible or even unexpected over enough samples.

What got me to thinking about this was the third perfect game pitched this year in the MLB.  Until this year, only 20 perfect games had been pitched in over 130 years of history, meaning that one is expected every 7 years or so  (we would actually expect them more frequently today given that there are more teams and more games, but even correcting for this we might have an expected value of one every 3-4 years).  Yet three perfect games happened, without any evidence or even any theoretical basis for arguing that the mean is somehow shifting.  In rigorous statistical parlance, sometimes shit happens.  Were baseball more of a political issue, I have no doubt that writers from Paul Krugman on down would be writing about how three perfect games this year is such an unlikely statistical fluke that it can't be natural, and must have been caused by [fill in behavior of which author disapproves].  If only the Republican Congress had passed the second stimulus, we wouldn't be faced with all these perfect games....

Postscript:  We like to think that perfect games are the ultimate measure of a great pitcher.  This is half right.  In fact, we should expect entirely average pitchers to get perfect games every so often.  A perfect game is when the pitcher faces 27 hitters and none of them get on base.  So let's take the average hitter facing the average pitcher.  The league average on base percentage this year is about .320 or 32%.  This means that for each average batter, there is a 68% chance for the average pitcher in any given at bat to keep the batter off the base.  All the average pitcher has to do is roll these dice correctly 27 times in a row.

The odds against that are .68^27 or about one in 33,000.  But this means that once in every 33,000 pitcher starts  (there are two pitcher starts per game played in the MLB), the average pitcher should get a perfect game.  Since there are about 4,860 regular season starts per year (30 teams x 162 games) then average pitcher should get a perfect game every 7 years or so.  Through history, there have been about 364,000 starts in the MLB, so this would point to about 11 perfect games by average pitchers.  About half the actual total.

Now, there is a powerful statistical argument for demonstrating that great pitchers should be over-weighted in perfect games stats:  the probabilities are VERY sensitive to small changes in on-base percentage.  Let's assume a really good pitcher has an on-base percentage against him that is 30 points less than the league average, and a bad pitcher has one 30 points worse.   The better pitcher would then expect a perfect game every 10,000 starts, while the worse pitcher would expect a perfect game every 113,000 starts.  I can't find the stats on individual pitchers, but my guess is the spread between best and worst pitchers on on-base percentage against has more than a 60 point spread, since the team batting average against stats (not individual but team averages, which should be less variable) have a 60 point spread from best to worst. [update:  a reader points to this, which says there is actually a 125-point spread from best to worst.  That is a different in expected perfect games from one in 2,000 for Jared Weaver to one in 300,000 for Derek Lowe.  Thanks Jonathan]

Update:  There have been 278 no-hitters in MLB history, or 12 times the number of perfect games.  The odds of getting through 27 batters based on a .320 on-base percentage is one in 33,000.  The odds of getting through the same batters based on a .255 batting average (which is hits but not other ways on base, exactly parallel with the definition of no-hitter) the odds are just one in 2,830.  The difference between these odds is a ratio of 11.7 to one, nearly perfectly explaining the ratio of no-hitters to perfect games on pure stochastics.

My Favorite Line of the Day

In a report from the DOE Inspector General, which said that $500,000 of equipment bought with stimulus money was missing at a battery company:

 “It would not be appropriate to release the name of stimulus-money recipient where the $500,000 worth of equipment could not be located.”

But it is A-OK to excoriate by name any number of corporations that create value legally if doing so advances this Administration's re-election prospects.

If You Disagree With My Economic Policies, It Must Be Because You Are Trying to Wreck the Economy

Kevin Drum is back on his "because Republicans won't agree to more massive deficit spending, they must be purposefully trying to destroy the economy."   Literally.  He translates Republican opposition to Obama's proposed stimulus packages as being explained by this strategy:

Basically, the Republican strategy for the past three years has been this:

  1. Do everything humanly possible to prevent the economy from recovering.
  2. Wait for 2012.
  3. Run a campaign focused on the fact that the economy is lousy.

This is such a shabby bit of false logic it is amazing anyone even attempts this any more, or more accurately, it's amazing that folks continue to buy it.  Is it really so impossible to believe that there are actually people of goodwill who wish to see the economy improve but disagree with Drum and Obama as to the correct course to achieve that?  Apparently not  (I suppose the last stimulus was so wildly succesful that it is impossible to doubt the success of another trillion or so of deficit spending?)

The irony is that for some reason I simply cannot fathom, from a political tactics point of view, he points to this chart when talking about Truman and his "do-nothing" Congress:


He's is trying to make some political tactical point, but he is so blinded by his own assumptions that he misses the real point -- that the American economy grew at records rates through a "do-nothing" Congress.  Now, I suppose Drum might argue that this was an accident of timing, but in fact Truman inherited what should have been, by Drum's Keynesian thinking, the worst economic situation ever since an enormous amount of government spending was going away after the war and new workers were simultaneously flooding back into the job market.  If any time in recent history should have demanded Keynesian stimulus, this was it, and yet a do-nothing Congress led to a massive expansion.  Hmmmm.

Thinking About Greece

Mike Rizzo writes:

A typical sovereign government can secure funds from three “legitimate” places.*What are these sources?

  1. Taxes today.
  2. Taxes tomorrow. In other words we can borrow money today in order to build our bridge and then use future tax revenues to pay for the debt tomorrow. By the way, if the government is in the business of actually producing valuable “public goods” then you can easily think of this as value enhancing.
  3. Printing money. It’s not generally done this way, but in effect the monetary authorities can monetize the borrowing of a sovereign entity (how they do it is beyond the scope of this post). For simplicity, imagine instead that a central bank prints new bank notes from scratch, hands them to the Treasury, and then the Treasury spends them on goods and services. This is just another form of a tax, again beyond the scope of this post.

So, this is what the government budget identity looks like for “normal” countries:

G = T + the change in debt + the change in base money

I think this is a useful simplification, but I wanted to add a couple other refinements  (refinements by the way he did not neglect in his text, just did not put in the formula).  One other source of funds we have seen in Greece is what I would call Aid, which used to be humanitarian aid (think India in the 1970s) but today tends to be bailout money and debt forgiveness.  So we will write the equation

G = Taxes + ΔDebt  + Money Printing + Aid

But due to the Keynesian orientation of many commenters on the Greek and European situation, it becomes useful to expand the "taxes" term into some sort of base income, which I will just call GDP for simplicity, and some sort of tax rate t.  So then we get:

G = GDP x t + ΔDebt  + Money Printing + Aid

The Greeks can't print money (unless the EU does it for them) and at the moment no one in their right mind will lend to them without guarantees from stronger European countries (e.g. Germany).  If we call EU money printing for Greece or EU loan guarantee programs Aid, we get

G = GDP x t + Aid

As Rizzo noted, aid is drying up and Greek tax revenues are going down rather than up, so basically they are screwed.  The only out seems to be for Greece to exit the Euro and then, once on the drachma again, print money like crazy and inflate their way out of the debt.

But expanding the tax term reveals one more policy alternative that is being suggested.   Keynesians seem to believe there is a path out of this situation in Greece (or if Greece is too far gone, certainly in Italy and Spain) where money from some source  (aid, borrowing, whatever) is spent in the economy by the government in some way that is stimulative, thus increasing GDP and therefore taxes and allowing Greece to increase the money available to the government.  Since Aid is currently only be granted tied to "austerity" programs rather than stimulative spending, they feel Germany et al are following exactly the wrong course.

I am incredibly skeptical of this for two reasons, beyond just my general skepticism of Keynesian stimulus.  First, I have heard something akin to this in my personal experience.  For a short time in my life, during the Internet crazy period, I was brought in by some investors to look at their portfolio of languishing Internet plays (e.g. discountshoelaces.com)* and decide if they should keep pouring money in or shut down.  The plan I got from management was always - always - this stimulus approach.  They suggested that rather than cut back, the investors should give them a bunch of new money to really blow out the marketing effort, which would kick start their growth, etc. etc.

The problem was that they never, ever had a lick of evidence beyond just hope that the next $1 million would suddenly do what the last $10 million failed to do.  So we shut most of these efforts down.  Your first loss is your best loss, as they say.

Similarly, I don't think Keynesians can point to any example in history where this actually worked.   A country is drowning in debt, but suddenly a Hail Mary play of adding a huge chunk more to the debt and spending it on civil service worker salaries suddenly turned the tide.  Seriously, do people honestly think this will work?  Or are they just frustrated because they grew up with an assumption that there is always a public policy answer for everything and there just does not seem to be one here.

I have an emerging hypothesis, not backed by any evidence at this point, that the value of the Keynesian multiplier shifts as debt to total GDP increases.  I am not sure in actual practice it is ever above one, but if it were to be above 1 at 20% debt to GDP, it certainly is not going to be the same at, say, 150%.
OMG, Austerity!

via here

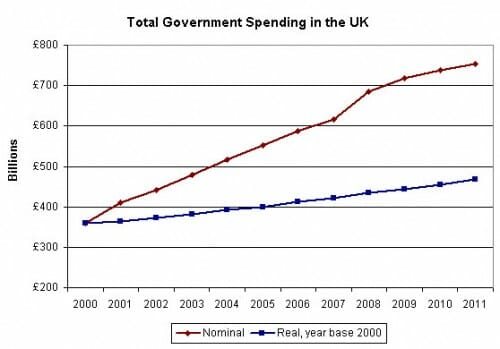
The UK line is particularly interesting, since that is the country that Krugman has declared is austerity-izing itself into a depression. As I have pointed out before, real government spending in UK has been and is still rising.  The percent of GDP of this spending has fallen a bit, but there is nothing about Keynesian stimulus theory that says changes in the percentage of government spending is stimulative, only its absolute value.

Here is one thing I would love to here Krugman et. al. opine on -- at what percentage of government debt to GDP does additional deficit spending become counter-stimulative.   I imagine there is an inverse relationship for deficit-funded stimulus, such that it has a larger effect at lower debt levels with a zero to negative effect at higher interest levels.

Update:  From another source, here is the UK in real $