Kevin Drum Undermines His Own Cover Story and Refutes His Own Keynesian Assumptions
Update: I have posted an update with a side by side chart comparison here.
Last year, Kevin Drum wrote what I believe was the cover story of the September / October issue of Mother Jones (I read the online edition so exactly how the print version is laid out is opaque to me). That article, entitled "It's the Austerity, Stupid: How We Were Sold an Economy-Killing Lie" features this analysis:

He described the chart as follows:
In the end, for reasons both political and ideological, Obama decided that he needed to demonstrate that he took the deficit seriously, and in his 2010 State of the Union address he did just that. "Families across the country are tightening their belts," he said, and the federal government should do the same. To that end, he announced a three-year spending freeze and the formation of a bipartisan committee to address the long-term deficit.
The Beltway establishment may have applauded Obama's pivot to the deficit, but much of the economic community saw it as nothing short of a debacle. Sure, there were still a few economists who believed that even in a deep recession government spending merely crowded out private spending and thus did no good, but they were a distinct minority. Most economists acknowledged that deficit spending was appropriate at a time like this. Paul Krugman fumed that Obama was cravenly trying to score political points by doing a "deficit peacock-strut" that would be destructive in the wake of the financial crisis. Mark Zandi, a centrist economist who has advised leaders of both parties, used more judicious language, but likewise warned that spending cuts might "cost the economy significantly in the longer run."...
Taken as a whole, these measures have cut the deficit by $3.9 trillion over the next 10 years. And that doesn't even count the expiration of desperately needed stimulus measures like the payroll tax holiday and extended unemployment benefits.
This was unprecedented, as the chart above shows. After every other recent recession, government spending has continued rising steadily throughout the recovery, providing a backstop that prevented the economy from sliding backward. It happened under Ronald Reagan after the recession of 1981, under George H.W. Bush after the recession of 1990, and under George W. Bush after the recession of 2001. But this time, even though the 2008 recession was deeper than any of those previous ones, it didn't.
I thought the choice of baseline dates for his charts was deceptive, but never-the-less for the moment lets accept this at face value. Make sure to take a note of the red line, which is the current recession, and the brown line, which was the recovery from the recession in the late Clinton / early Bush years. By Mr. Drum's earlier analysis, the earlier 1990 recession was better handled than the current one (against his Keynesian assumptions) by the government continuing to increase spending after the recession to keep the recovery going. The point of Drum's earlier article was to say that Republicans in Congress were sinking the current economy by not increasing spending as was done after these earlier recessions.
So this is what Drum published the other day, I think based on a Paul Krugman article.
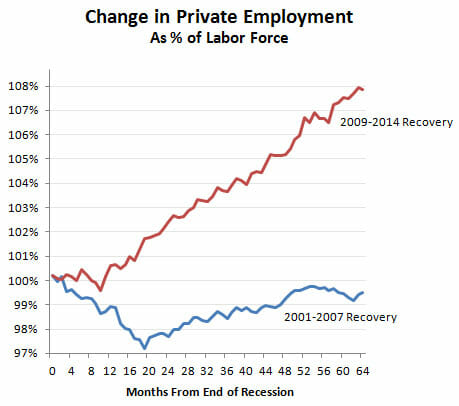
But I think Krugman undersells his case. He shows that the current recovery has created more private sector jobs than the 2001-2007 recovery, and that's true. But in fairness to the Bush years, the labor force was smaller back then and Bush was working from a smaller base. So of course fewer jobs were created. What you really want to look at is jobs as a percent of the total labor force. And here's what you get:
The Obama recovery isn't just a little bit better than the Bush recovery. It's miles better. But here's the interesting thing. This chart looks only at private sector employment. If you want to make Bush look better, you can look at total employment instead. It's still not a great picture, but it's a little better:
Awesome, Kevin! So I guess that austerity you were complaining about was the right thing to do, yes?
Seriously, in his article a year ago Drum argued that the Republicans in Congress were sinking the economy vis a vis the 1990 recession by not continuing to boost spending in the years after the recession. Now, he admits (though since he does not refer back to the original article I guess it is not an admission per se) that this "austerity" led to a stronger recovery than the spending-fueled 1990 version. All hail smaller government, the solution to growing employment!
PS- I wonder how much of this change in private employment since the last recession came in the oil and gas industry, whose expansion the Left generally opposes? Well, they'll bash on oil tomorrow but today, they will take credit for the jobs added.
Update: Here are the two charts combined, with other recessions removed and the colors on the data series set to match (click to enlarge)

That % of labor force sounds like it's one of statistical lies like if you have 2 rapes and theN next year you had 4 you could say you had a 100% increase in rapes making it sound much worse than it is
The thing
about rates is that they include numerators and denominators and neither tells
you anything about the jobs themselves.
The blu line on the above chart could very well reflect a recovery with a labor force that’s rising faster than the population and with new jobs paying more than lost or existing jobs. That’s certainly not what we have now.
What we have now is a US population about 50 million higher than it was in 2008 but a labor force that has stayed about the same. Ergo, the labor force participation rate has plummeted to its lowest since 1978. Also, there are more part time workers vs. full time workers than there were in 2008 and generally the quality of new jobs since 2008 has been lower than that of jobs lost. The largest employer in America right now is Wall-Mart and the second largest is Kelly Services – a temp agency.
Other than that this recovery is knocking it out of the park.
Drum and his fellow travelers on both the left and right have little interest in teasing out reality. Their job is to create narratives which fit and advance a particular political persuasion. Chiding them for inconsistency is as consequential to them as the proverbial water on a duck's back.
The fact is that this was the slowest recovery of any post war recovery and it was associated with less spending increase and less public sector hiring. The other fact is once again the republicans lead us to a cosmic crash and the democratic party dug us out slowly but steadily and with no help from the republicans. Drum shows that the )1 recovery was HELPED by increased public hiring and the Obama recovery was hurt by the lack of public hiring. Likewise the 82 and 91 recession recoveries with higher rates of spending and public hiring were much quicker than the recent recovery. At best austerity lost 2 out of 3 cases. Add in Europe where you had many more examples with much greater austerity almost all doing far worse and you guys loss and Keynes wins again because Keynes is right.
muirgeo seems unaware that in the huge escalation of housing prices, there was a huge escalation in revenue to the state and local governments and they hired people they could not support when tax revenues went down. It was the overspending by governments that forced the release of government employees. The Obama administration tried to get stimulus money to governments to support their payrolls, but that ultimately failed and, in fact, was just a saste of the stimulus money.
The democratic party did not dig out. In fact, they prolonged it by saving bankrupt auto companies and banking institutions who are now doing the same things that got them in trouble in 2008.
We have never had any austerity since Eisenhower. To argue it has failed is nonsense. When was the last time the actual government spending went down?
Again you republicans crash the economy in Great Depressions and Great Recessions and then rather than taking responsibility for the massive failure of your policy and your actions you blame democrats for taking so long to clean up your mess... that's not a way to win over people who are actually paying attention and free-thinking type of individuals. .
You clearly have little understanding of history, business, or finance. It was FDR who first got the government into the housing market. It was Jimmy Carter who first got a hold of the idea of CRA and subprime mortgages. It was Clinton who extended the CRA as part of the Glass-Steagall repeal. It was Raines at Fannie May who was the leader in MBS when the banks who had been forced to write these sub prime mortgages needed a way to get them off their books. Then it was Greenspan (encouraged by Krugman) at the Fed who lowered interest rates to create another bubble. It was Bush who tried to get control of Fannie and Freddie, but was stopped by Chris Dodd and Barney Frank.
Anyone who attempts to argue that it is all a problem of Republican policy is neither paying attention nor free thinking. The word you should have been using to describe yourself is "ideologue".
" led to a stronger recovery than the spending-fueled 1990 version"
Uh, the comparison is not with the 1990's. It's with the 2000's. The significant expansion of government spending during the Bush administration. Is there too much cognitive dissonance in your brain to read the chart.
Dems had BOTH houses of congress in 2007 and 2008 so Bush could not have done anything without support from the democrats.
Also, the chart only shows spending and in the other recoveries, a better economy led to better GDP growth and tax revenues, thus the ability to support higher spending. Also, the chart is per capita and includes state and local which significantly muddies the comparison.
Muirgeo is leftist filth. He's a doctor...a Marxist doctor that embraces all of the failed policies and murder that his ideology has caused in the last century. He also single-handedly got open comments shut down on Cafe Hayek due to his trolling. He is as obtuse and obstinate as our own Zachariah, Larry G., and a few others. Nothing will be learned or gained from any interaction with this dooshbag.
Thx for the heads up
Evidence of his destructive tendencies and ideology aren't that difficult to find, but here's the post at Cafe Hayek where Russ Roberts (a very level-headed guy) discusses the mayhem that filthy Muirgeo caused there. It was 6 years ago, but he hasn't changed. No telling how much damage to society he's done in the interim:
http://cafehayek.com/2008/11/muirgeo.html
Just noticed that his avatar is the tyrannical FDR...typical of assclown Marxists such as he is.
Data mining by Sumner, by only comparing the latest recovery to the post 2001 recovery. The definitive source is the World Economic Outlook yearly edition, which discussed austerity, see below. What it shows is that as the advanced economies age, the recoveries have become more feeble and so has stimulus; compare to developing countries. BTW just to be clear: I am against bailouts, against stimulus of any form, for a return to decentralized banking. But these are the historic facts.- RL
World Economic Outlook yearly edition, April 2013 (page 33)
Figure 1.1.2. Government Expenditures during Global Recessions and Recoveries 1 (Years from global recession on x-axis; indices = 100 in the year before the global recession)
With regard to fiscal policy, the current and projected paths of government expenditures in the advanced economies are quite different than during past recoveries, when policy was decisively expansion-ary, with increases in real primary government expen-ditures. In some advanced economies, especially in the United States, the fiscal stimulus introduced at the outset of the financial crisis was far larger than during earlier recessions. However, the stimulus was unwound early in the ensuing recovery. Specifically, expenditures fell during the first two years of this global recovery and are projected to continue to decline modestly in the coming years (Figure 1.1.2).
This pattern also holds across the major advanced economies, with the euro area and the United King-dom showing sharp departures from the typical paths of government expenditures in the past. 3 In contrast, in the emerging market economies the ongoing recov-ery has been accompanied by a more expansionary fiscal policy stance than during past episodes. This was possible because these economies had stronger fiscal
positions this time around than in the past.