Posts tagged ‘normal distribution’

Global Temperature Update

I just updated my climate presentation with data through December of 2016, so given "hottest year evah" claims, I thought I would give a brief update with the data that the media seldom ever provides.  This is only a small part of my presentation, which I will reproduce for Youtube soon (though you can see it here at Claremont-McKenna).  In this post I will address four questions:

  • Is the world still warming?
  • Is global warming accelerating?
  • Is global warming "worse than expected"?
  • Coyote, How Is Your Temperature Prediction Model Doing?

Is the world still warming:  Yes

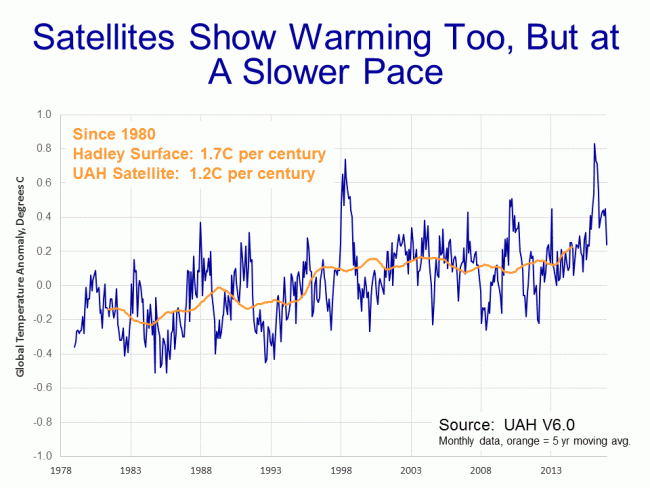
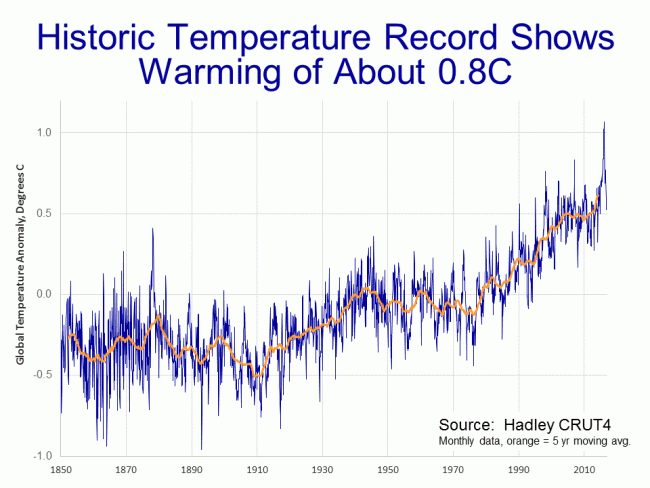
We will use two data sets.  The first is the land surface data set from the Hadley Center in England, the primary data set used by the IPCC.  Rather than average world absolute temperature, all these charts show the variation or "anomaly" of that absolute temperature from some historical average (the zero point of which is arbitrary).  The theory is that it is easier and more accurate to aggregate anomalies across the globe than it is to average the absolute temperature.  In all my temperature charts, unless otherwise noted, the dark blue is the monthly data and the orange is a centered 5-year moving average.

You can see the El Nino / PDO-driven spike last year.  Ocean cycles like El Nino are complicated, but in short, oceans hold an order of magnitude or two more heat than the atmosphere.  There are decadal cycles where oceans will liberate heat from their depths into the atmosphere, creating surface warming, and cycles where oceans bury more heat, cooling the surface.

The other major method for aggregating global temperatures is using satellites.  I use the data from University of Alabama, Huntsville.

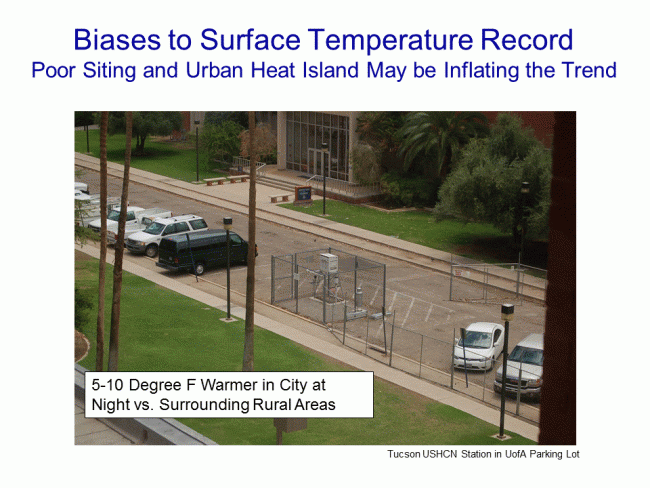
On this scale, the el nino peaks in 1999 and 2017 are quite obvious.  Which method, surface or satellites, gets a better result is a matter of debate.  Satellites are able to measure a larger area, but are not actually measuring the surface, they are measuring temperatures in the lower tropospehere (the troposphere's depth varies but ranges from the surface to 5-12 miles above the surface).  However, since most climate models and the IPCC show man-made warming being greatest in the lower troposphere, it seems a good place to measure.  Surface temperature records, on the other hand, are measuring exactly where we live, but can be widely spaced and are subject to a variety of biases, such as the urban heat island effect.  The station below in Tucson, located in a parking lot and surrounded by buildings, was an official part of the global warming record until my picture became widely circulated and embarrassed them in to closing it.

This argument about dueling data sets goes on constantly, and I have not even mentioned the issues of manual adjustments in the surface data set that are nearly the size of the entire global warming signal.  But we will leave these all aside with the observation that all data sources show a global warming trend.

Is Global Warming Accelerating?  No

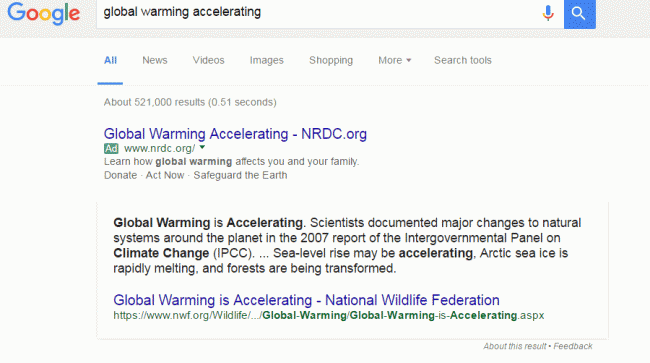
Go into google and search "global warming accelerating".  Or just click that link.  There are a half-million results about global warming accelerating.  Heck, Google even has one of those "fact" boxes at the top that say it is:

It is interesting by the way that Google is using political advocacy groups for its "facts" nowadays.

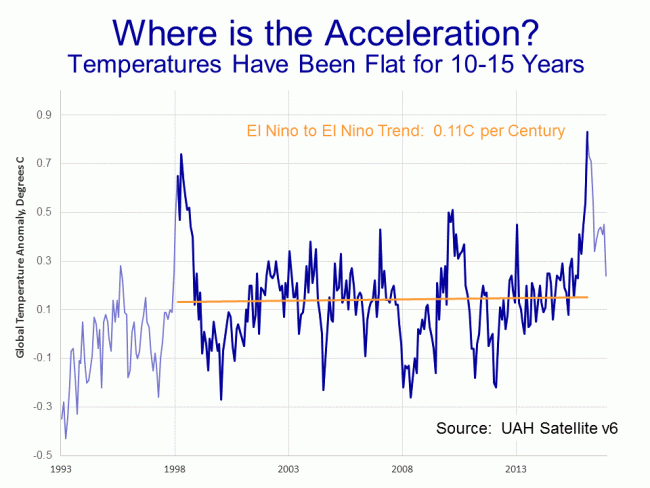
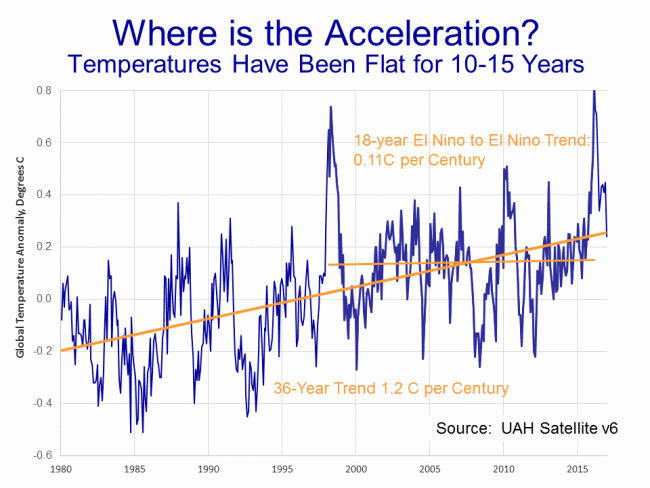
Anyway, if global warming is so obviously accelerating that Google can list it as a fact at the top of its search page, it should be obvious from the data, right?  Well let's look.  First, here is the satellite data since I honestly believe it to be of higher quality than the surface records:

This is what I call the cherry-picking chart.  Everyone can find a peak for one end of their time scale and a valley for the other and create whatever story they want.  In economic analysis, to deal with the noise and cyclicality, one will sometimes see economic growth measured peak-to-peak, meaning from cyclical peak to the next cyclical peak, as a simple way to filter out some of the cyclicality.  I have done the same here, taking my time period as about 18 years from the peak of the 1999 El Nino to 2017 and the peak of the recent El Nino.  The exact data used for the trend is show in darker blue.  You can decide if I have been fair.

The result for this time period is a Nino to Nino warming trend of 0.11C.  Now let's look at the years before this

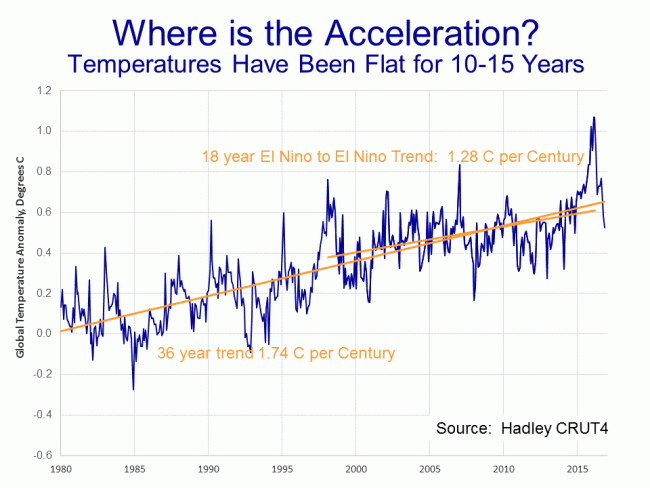
So the trend for 36 years is 1.2C per century but the trend for the last half of this is just 0.11C.  That does not look like acceleration to me.  One might argue that it may again accelerate in the future, but I cannot see how so many people blithely treat it as a fact that global warming has been accelerating when it clearly has not.  But maybe its just because I picked those darn satellites.  Maybe the surface temperatures show acceleration?

Nope.  Though the slow down is less dramatic, the surface temperature data never-the-less shows the same total lack of acceleration.

Is Global Warming "Worse Than Expected"?  No

The other meme one hears a lot is that global warming is "worse than expected".  Again, try the google search I linked.  Even more results, over a million this time.

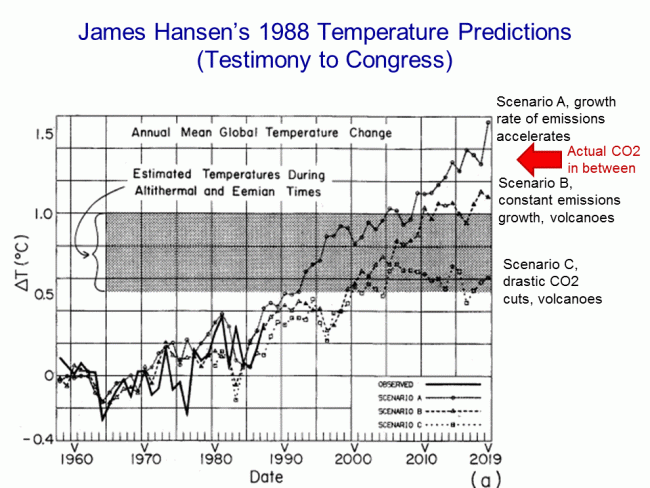
To tackle this one, we have to figure out what was "expected".  Al Gore had his crazy forecasts in his movie.  One sees all kinds of apocalyptic forecasts in the media.  The IPCC has forecasts, but it tends to change them every five years and seldom goes back and revisits them, so those are hard to use.  But we have one from James Hansen, often called the father of global warming and Al Gore's mentor, from way back in 1988.  His seminal testimony in that year in front of Congress really put man-made global warming on the political map.  Here is the forecast he presented:

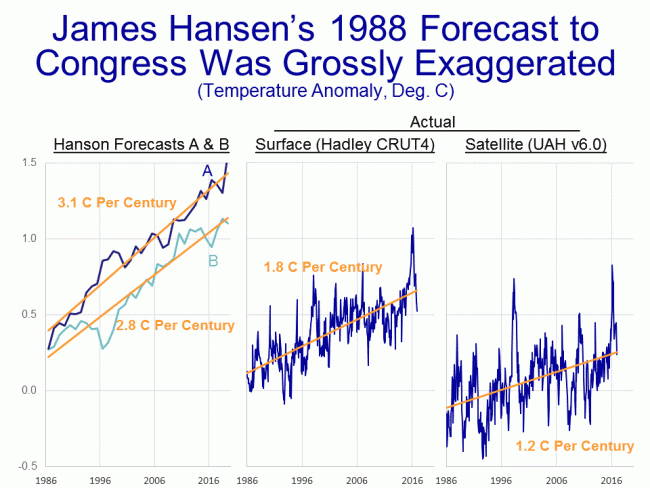
Unfortunately, in his scenarios, he was moving two different variables (CO2 levels and volcanoes) so it is hard to tell which one applies best to the actual history since then, but we are almost certainly between his A and B forecasts.  A lot of folks have spent time trying to compare actual temperatures to these lines, but it is very hard.  The historical temperature record Hansen was using has been manually adjusted several times since, so the historical data does not match, and it is hard to get the right zero point.  But we can eliminate the centering issues altogether if we just look at slopes -- that is all we really care about anyway.  So I have reproduced Hanson's data in the chart on the left and calculated the warming slopes in his forecast:

As it turns out, it really does not matter whether we choose the A or B scenario from Hansen, because both have about the same slope -- between 2.8C and 3.1C per century of warming from 1986 (which appears to be the actual zero date of Hansen's forecast) and today.  Compare this to 1.8C of actual warming in the surface temperature record for this same period, and 1.2C in the satellite record.  While we have seen warming, it is well under the rates predicted by Hansen.

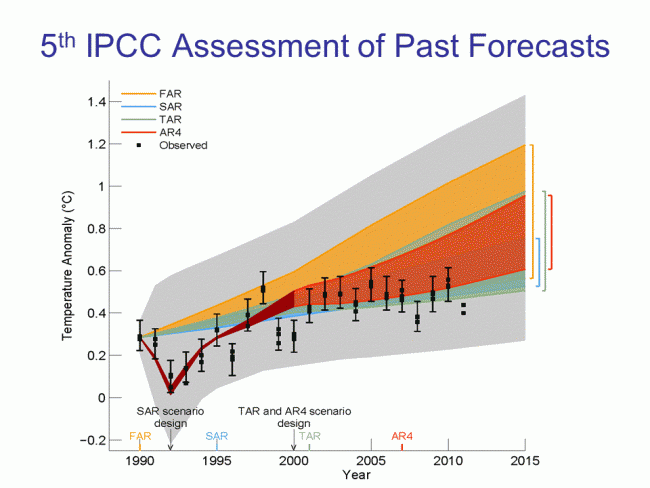
This is a consistent result to what the IPCC found in their last assessment when they evaluated past forecasts.  The colored areas are the IPCC forecast ranges from past forecasts, the grey area was the error bar (the IPCC is a bit inconsistent when it shows error bars, including error bands seemingly only when it helps their case).  The IPCC came to the same result as I did above:   that warming had continued but was well under the pace that was "expected" form past forecasts.

By the way, the reason that many people may think that global warming is accelerating is because media mentions of global warming and severe weather events has been accelerating, leaving the impression that things are changing faster than they truly are.  I wrote an article about this effect here at Forbes.  In that I began:

The media has two bad habits that make it virtually impossible for consumers of, say, television news to get a good understanding of trends

  1. They highlight events in the tail ends of the normal distribution and authoritatively declare that these data points represent some sort of trend or shift in the mean
  2. They mistake increases in their own coverage of certain phenomenon for an increase in the frequency of the phenomenon itself.

Coyote, How Is Your Temperature Prediction Model Doing?  Great, thanks for asking

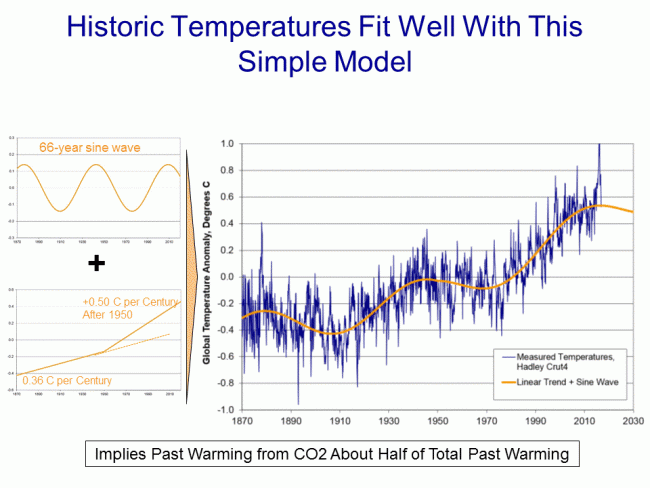
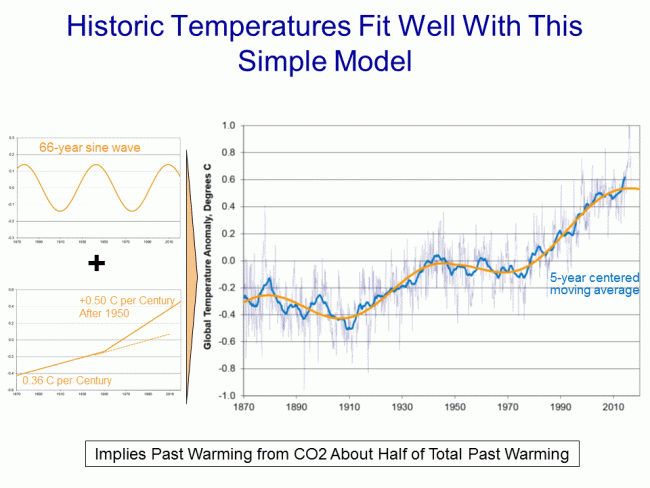
Ten years ago, purely for fun, I attempted to model past temperatures using only three inputs:  A decadal cyclical sin wave, a long-term natural warming trend out of the little ice age (of 0.36 C per century), and a man-made warming trend really kicking in around 1950 (of 0.5C per century).  I used this regression as an attribution model, to see how much of past warming might be due to man (I concluded about half of 20th century warming may be due to manmade effects).  But I keep running it to test its accuracy, again just for fun, as a predictive tool.  Here is where we are as of December of 2016 (in this case the orange line is my forecast line):

Still hanging in there:  Despite the "hottest year evah" news, temperatures in December were exactly on my prediction line.  Here is the same forecast with the 5-year centered moving average added in light blue:
"Abnormal" Events -- Droughts and Perfect Games

Most folks, and I would include myself in this, have terrible intuitions about probabilities and in particular the frequency and patterns of occurance in the tail ends of the normal distribution, what we might call "abnormal" events.  This strikes me as a particularly relevant topic as the severity of the current drought and high temperatures in the US is being used as absolute evidence of catastrophic global warming.

I am not going to get into the global warming bits in this post (though a longer post is coming).  Suffice it to say that if it is hard to accurately directly measure shifts in the mean of climate patterns given all the natural variability and noise in the weather system, it is virtually impossible to infer shifts in the mean from individual occurances of unusual events.  Events in the tails of the normal distribution are infrequent, but not impossible or even unexpected over enough samples.

What got me to thinking about this was the third perfect game pitched this year in the MLB.  Until this year, only 20 perfect games had been pitched in over 130 years of history, meaning that one is expected every 7 years or so  (we would actually expect them more frequently today given that there are more teams and more games, but even correcting for this we might have an expected value of one every 3-4 years).  Yet three perfect games happened, without any evidence or even any theoretical basis for arguing that the mean is somehow shifting.  In rigorous statistical parlance, sometimes shit happens.  Were baseball more of a political issue, I have no doubt that writers from Paul Krugman on down would be writing about how three perfect games this year is such an unlikely statistical fluke that it can't be natural, and must have been caused by [fill in behavior of which author disapproves].  If only the Republican Congress had passed the second stimulus, we wouldn't be faced with all these perfect games....

Postscript:  We like to think that perfect games are the ultimate measure of a great pitcher.  This is half right.  In fact, we should expect entirely average pitchers to get perfect games every so often.  A perfect game is when the pitcher faces 27 hitters and none of them get on base.  So let's take the average hitter facing the average pitcher.  The league average on base percentage this year is about .320 or 32%.  This means that for each average batter, there is a 68% chance for the average pitcher in any given at bat to keep the batter off the base.  All the average pitcher has to do is roll these dice correctly 27 times in a row.

The odds against that are .68^27 or about one in 33,000.  But this means that once in every 33,000 pitcher starts  (there are two pitcher starts per game played in the MLB), the average pitcher should get a perfect game.  Since there are about 4,860 regular season starts per year (30 teams x 162 games) then average pitcher should get a perfect game every 7 years or so.  Through history, there have been about 364,000 starts in the MLB, so this would point to about 11 perfect games by average pitchers.  About half the actual total.

Now, there is a powerful statistical argument for demonstrating that great pitchers should be over-weighted in perfect games stats:  the probabilities are VERY sensitive to small changes in on-base percentage.  Let's assume a really good pitcher has an on-base percentage against him that is 30 points less than the league average, and a bad pitcher has one 30 points worse.   The better pitcher would then expect a perfect game every 10,000 starts, while the worse pitcher would expect a perfect game every 113,000 starts.  I can't find the stats on individual pitchers, but my guess is the spread between best and worst pitchers on on-base percentage against has more than a 60 point spread, since the team batting average against stats (not individual but team averages, which should be less variable) have a 60 point spread from best to worst. [update:  a reader points to this, which says there is actually a 125-point spread from best to worst.  That is a different in expected perfect games from one in 2,000 for Jared Weaver to one in 300,000 for Derek Lowe.  Thanks Jonathan]

Update:  There have been 278 no-hitters in MLB history, or 12 times the number of perfect games.  The odds of getting through 27 batters based on a .320 on-base percentage is one in 33,000.  The odds of getting through the same batters based on a .255 batting average (which is hits but not other ways on base, exactly parallel with the definition of no-hitter) the odds are just one in 2,830.  The difference between these odds is a ratio of 11.7 to one, nearly perfectly explaining the ratio of no-hitters to perfect games on pure stochastics.

Global Warming Hype Process

Here is the current global warming hype process as it exists today:

  1. Identify a 2 or 3 sigma weather event.  Since there are 365 days in the year and hundreds of different regions in the world, the laws of probability say that some event in the tail of the normal distribution (local high, local low, local flood, local drought, local snow, local tornado, local hurricane, etc) should be regularly occurring somewhere.
  2. Play weather event all over press, closely linked as often as possible with supposition that this is due to manmade CO2.  If the connection to global warming is too outlandish to make with a straight face (e.g. cold weather) use term "climate change" or "climate disruption" instead of global warming.
  3. Skeptics will point to actual data that this event is not part of a long term trend, e.g. there is no rise in tornado activity correlated with 20th century rise in temperatures so blaming one year of high tornadoes on global warming makes no sense.    Ignore this.
  4. Peer reviewed literature will emerge 6-12 months later demonstrating that the event was not likely due to man-made global warming.  Ignore this as well.  Never, ever go back and revisit failed catastrophic predictions.
  5. Repeat

Last year's Russian heat wave is a classic example.  Here is an example of the hype and the tie to man-made global warming in Time.  And here, 12 months later, is the study saying that weather was just weather:

Reference
Dole, R., Hoerling, M., Perlwitz, J., Eischeid, J., Pegion, P., Zhang, T., Quan, X.-W., Xu, T. and Murray, D. 2011. Was there a basis for anticipating the 2010 Russian heat wave? Geophysical Research Letters38: 10.1029/2010GL046582.

Background
The authors write that "the 2010 summer heat wave in western Russia was extraordinary, with the region experiencing the warmest July since at least 1880 and numerous locations setting all-time maximum temperature records." And as a result, they say that "questions of vital societal interest are whether the 2010 Russian heat wave might have been anticipated, and to what extent human-caused greenhouse gas emissions played a role."

What was learned
The nine U.S. researchers determined that "analysis of forced model simulations indicates that neither human influences nor other slowly evolving ocean boundary conditions contributed substantially to the magnitude of the heat wave." In fact, they say that the model simulations provided "evidence that such an intense event could be produced through natural variability alone." Similarly, on the observation front, they state that "July surface temperatures for the region impacted by the 2010 Russian heat wave show no significant warming trend over the prior 130-year period from 1880-2009," noting, in fact, that "a linear trend calculation yields a total temperature change over the 130 years of -0.1°C." In addition, they indicate that "no significant difference exists between July temperatures over western Russia averaged for the last 65 years (1945-2009) versus the prior 65 years (1880-1944)," and they state that "there is also no clear indication of a trend toward increasing warm extremes." Last of all, they say that although there was a slightly higher variability in temperature in the latter period, the increase was "not statistically significant."

Not sure I find the computer model work comforting one way or the other but the complete lack of any observational trend seems compelling.

Science That Is Run Like a Soviet Election

News from the United Nations:

Robert Orr, UN under secretary general for planning, said the next Intergovernmental Panel on Climate Change report on global warming will be much worse than the last one.

Hmm, that kind of confirms what critics have been saying for years, that the IPCC has nothing to do with science.  Because, you see, to my knowledge the scientists of the next IPCC have not even started their work, but the UN leadership has already determined what the report will say.  Which is consistent with their process in the last go around, where the UN political guys crafted the management summary first, and then circulated it to the scientific teams with instructions to adjust their sections of the report to fit the pre-existing conclusion.

In the same article, we get more of the "accelerating" nonsense:

He said UN Secretary General Ban Ki-moon would make it clear to world leaders in Cancun "that we should not take any comfort in the climate deniers' siren call."

"The evidence shows us quite the opposite-- that we can't rest easy at all" as scientists agree that climate change "is happening in an accelerated way."

Its not even clear what the value of the first derivative is for climate change, or even if such a metric has any meaning in the complex climate system where regional trends can easily be going in opposite directions.  But anyone who can tell you that we know the second derivative, or even its sign, is totally full of crap.

Never (except perhaps with shark attack scares which come and go) have I seen such a classic case of observer bias.   Certain events occur in the tail ends of the normal distribution.  Suddenly everyone claims that these events are happening with more frequency, mainly because they get reported with more frequency. I reported on a great example of this from a supposedly scientific government report here, where researchers mistook improved measurement of certain events as a real underlying increase in the number of such events.  Another example here.

Of course, 95 percentile events can't be, by definition, happening more frequently.  The only thing that can happen is the normal distribution can have its standard deviation increase.  Similar to the second derivitive argument above, I am not a statistician, but my sense is that the odds that we could detect a standard deviation shift in the distribution of weather events using just a few years of highly imperfect data, even if such an underlying shift existed, is really  really low.

Two Americas

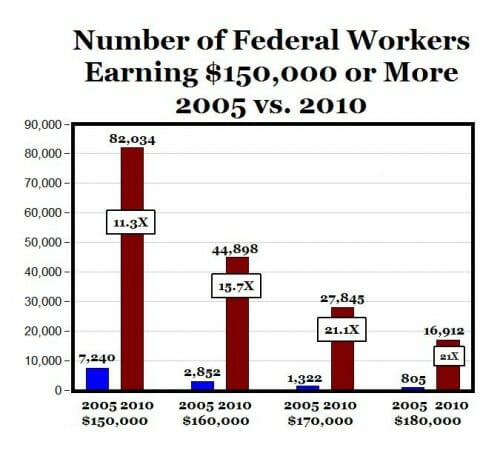
Two Americas:  Those who use the coersive power of the government to take money for themselves, and those who have to earn it by giving value for money in non-coerced , arms-length transactions.

Via Carpe Diem, which has more thoughts on the trend

Note:  I have seen folks defend this type of chart by saying it is just the function of  the inflection point of a normal distribution creeping by inflation across a dividing line.  But look the $180K+ in 2010 vs. the $150K+ in 2005.  By inflation, a $150,000 salary should not have increased to more than $165,000, but we see more than twice as many people making $180K plus today than made $150K plus five years ago.

Chicken Little: The Supposed Arizona Immigrant-Led Crime Wave

Conservatives often attack global warming alarmists for using individual outlier events at the tails of the normal distribution (e.g. Katrina) to fan panic about climate change.  So it is interesting to see them doing the same thing themselves on immigrants and crime in Arizona.  [sorry, forgot the link to Expresso Pundit]

Of course, the whole story fell apart when Wagner had to introduce this fact.

While smugglers have become more aggressive in their encounters with authorities, as evidenced by the shooting of a Pinal County deputy on Friday, allegedly by illegal-immigrant drug runners, they do not routinely target residents of border towns.

Sure, that's the ticket, violence hasn't increased in actual border towns...of course, roving drug smugglers just used an AK 47 to gun down a deputy in PINAL County a hundred miles north of the border.  But other than that...and the rancher they killed last month...the border towns themselves are pretty calm.

Excuse me, but has anyone on any side of the immigration debate ever claimed that immigrants have never committed a crime?  Forget for a minute that the guilty parties in these two cases are mere supposition without any charges filed yet -- particularly the case of the rancher last month.  In 2008 there were about 407 killings in the state.  So, like, one a month were maybe by immigrant gangs and this is a crisis?

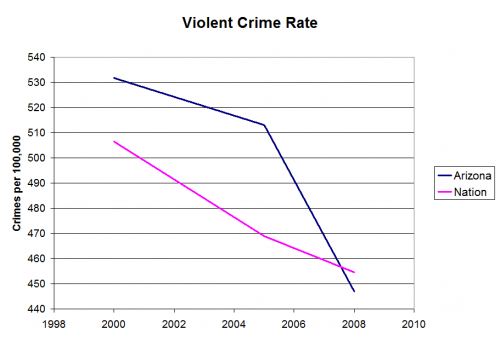
From the link above, I looked up AZ and US crime states in 2000, 2005, and 2008.  I was too lazy to do every year and 2009 state stats don't appear to be online yet.  Here is the crisis in Arizona in violent crime rates:

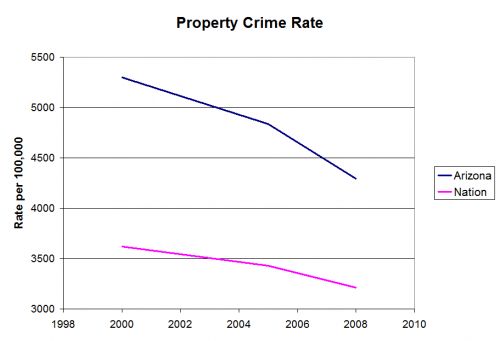
Oh Noz, we seem not only to have drastically reduced our violent crime rate right in the teeth of this immigrant "invasion" but we also have reduced it below the US average.  This actually understates the achievement, since Arizona is more highly urbanized than the average state  (yeah, I know this is counter-intuitive, but it was true even 20 years ago and is more true today).  Urban areas have higher crime rates than rural areas, particularly in property crime as below:

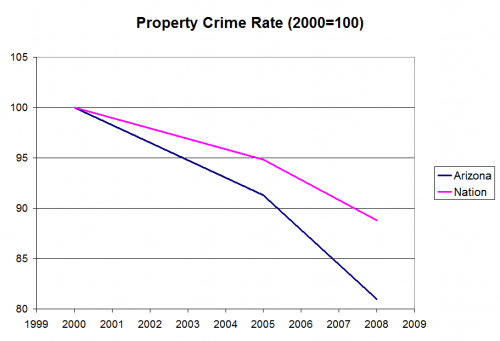
So our property crime rate is high, but not totally out of line from other highly urban areas.  But the real key here is that during this supposed immigrant invasion, again Arizona has improved faster than the national average.  This is seen more clearly when we index both lines to 2000.

One may wonder why climate change alarmists only wave around anecdotes rather than averages.  If we really are seeing more drought or floods, show us the averages.  The problem is that their story can't be seen in the averages, so they are forced to rely on anecdotes to inflame the population.   The same appears to be true of our Arizona immigration panic.

Update: Some doubts emerge about Pinal County deputy shooting update: or perhaps not

The Zero Effect

Ties occur at the end of regulation in NBA basketball games way more frequently than one might expect from a normal distribution of scores.    The distribution of point differential at the end of regulation looks really weird:

histograminbantime

Why this is, and the role of strategy, is here (via the sports economist).

Oh My God! 40% of Sick Days Taken on Monday or Friday!

I thought this was kind of funny, from the false hysteria department.  The Arizona Republic begins ominously:

If you're already mad about gas prices, prepare to get madder.  Besides paying prices at the pump that were unthinkable a few months
ago, many consumers also are getting ripped off by the pump itself.

Uh, Oh.  I can see it coming.  The AZ Republic has smoked out more evil doings from the oil industry.  I shudder to think what horrors await.

About 9 percent, or about 2,000, of the 20,400 gas pumps inspected this
fiscal year by the Arizona Department of Weights and Measures since
July 1, 2007, failed to pass muster.

Oh my freaking God!  Every fill up, I have a one in 11 chance of my gas being measured wrong.  I just bet those oil companies are coming out in the night to tweak the pump so I get hosed. 

Half of those were malfunctioning to the detriment of customers.

See!  There you go!  Half are to the detriment of customers! 

Oh.  Wait a minute.  Doesn't that mean the other half are to the benefit of customers?  Why would those oil guys be doing that?  This sure isn't a bunch of very smart conspirators.  Could it be that this is just the result of random drift in a measurement device, with the direction of drift equally distributed between "reads high" and "reads low"?

As it turns out, I worked for a very large flow measurement instrument maker for several years.  For a variety of reasons, flow measurement devices can drift or can be mis-calibrated.  To fail the state standard, the meter has to be off about 2.5%, which is about 6 tablespoons to the gallon.  State governments have taken on the task of making sure commercial weights and measures are accurate, and though I think this could be done privately, I don't find it a terribly offensive government task.  Having taken this task on, it is reasonable to question whether it is doing its oversight job well.  But let's not try to turn this into a consumer nightmare by only discussing one half of the normal distribution of outcomes.

Post title stolen from an old Dilbert cartoon.

False Sense of Certainty

Over at Climate Skeptic, I dissect the UK Met office's forecast a year ago for 2007 that the mean global temperature anomaly would be .54C and that we were 60% certain to exceed the 1998 record of .52C.  These two points allow me to infer a normal distribution for their forecast, and I find that the actual temperature anomaly for 2007 was in the bottom 0.00003% of the Met office's implied range of outcomes.

Tall People Rule!

This makes perfect sense to me.  The fact that I am 6'-4" tall has nothing to do with it:

Economists have long been irritated by the weird fact that tall people
have better jobs and earn more money. Many explanations have been
offered, various forms of social and individual discrimination first
among them. But two Princeton economists disagree: "In this paper, we offer a simpler explanation: On average, taller people earn more because they are smarter."

Update: I am amazed that I even have to say this, but of course I am having fun with this and don't take it seriously (I can't believe all the emails this has generated).  Besides, just think about the math for a minute.  There is a broad normal distribution of intelligence for both short and tall people.  The study says the averages of these two distributions diverge a bit.  But even if they do, the distributions themselves are much, much wider than this divergence.  This means in practice, even if true, this study has no predictive power for individuals you meet.  Short and tall people will be both smart and dumb.  It only means that if you somehow met all 300 million people in the US, you might notice you met a few more smart-tall people than smart-short people, but that is all it would mean.  Now, I do believe tall people might make more money.  There is good evidence that tall people get disproportionately favored in hiring and promotions than equally qualified folks who are altitude challenged.

Now, if you said short people were touchier and more over-sensitive than tall people, I would have a hard time disproving it from my email.