Denying the Climate Catastrophe: 2. Greenhouse Gas Theory
Other parts of the series are here:
- Introduction
- Greenhouse Gas Theory (this article)
- Feedbacks
- A) Actual Temperature Data; B) Problems with the Surface Temperature Record
- Attribution of Past Warming; A) Arguments for it being Man-Made; B) Natural Attribution
- Climate Models vs. Actual Temperatures
- Are We Already Seeing Climate Change
- The Lukewarmer Middle Ground
- A Low-Cost Insurance Policy
We continue our multi-part series on the theory of catastrophic man-made global warming by returning to our framework we introduced in the last chapter.
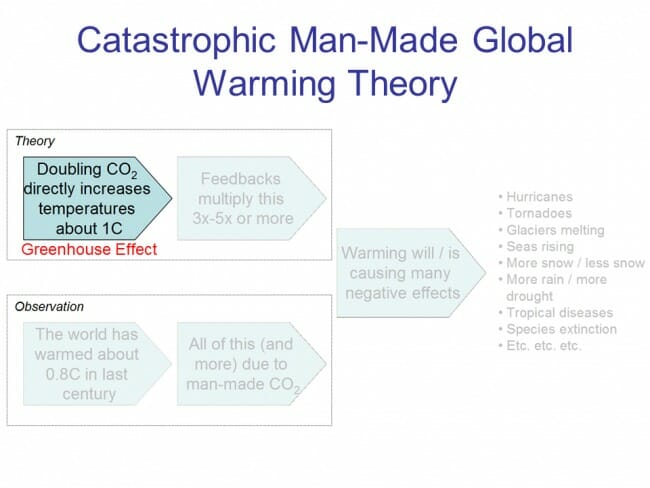
In the introduction, we discussed how catastrophic man-made global warming theory was actually made up of two independent parts. In this section, we will discuss the first of these two parts, the greenhouse gas effect, which is the box in the upper left of our framework.
For those unfamiliar with exactly what the greenhouse effect is, I encourage you to check out this very short primer. Essentially, certain gasses in the atmosphere can absorb some of the heat the Earth is radiating into space, and re-radiate some of this heat back to Earth. These are called greenhouse gasses. Water vapor is a relatively strong greenhouse gas, while CO2 is actually a relatively weak greenhouse gas.
It may come as a surprise to those who only know of skeptics' arguments from reading their opponents (rather than the skeptics themselves), but most prominent skeptics accept the theory of greenhouse gas warming. Of course there are exceptions, including a couple of trolls who like to get attention in the comments section of this and other blogs, and including a few prominent politicians and talk-show hosts. But there are also environmental alarmists on the other side who have signed petitions to ban dihydrogen monoxide. It is always tempting, but seldom intellectually rewarding, to judge a particular position by its least capable defenders.
There is simply too much evidence both from our and other planets (as well as simple experiments in a laboratory) to deny that greenhouse gasses in the atmosphere have a warming effect on planets, and that CO2 is such a greenhouse gas. What follows in the rest of this section represents something of a consensus of people on both sides of the debate.
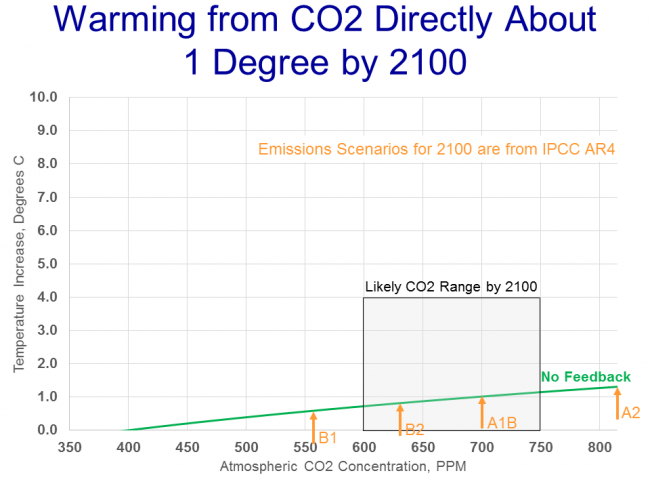
To investigate the effect of CO2 on Earth's temperature, we are going to use this chart:
On the X axis is the atmospheric concentration of CO2 in parts-per-million (ppm). Frequently, forecasts of CO2 warming are shown as a relationship over time. I prefer this view, because it separates the assumption of CO2 emissions rates from assumptions about the sensitivity of temperatures to CO2.
Note that the concentrations we are talking about are remarkably small. Currently the Earth is just over 400 ppm, which is 0.04%. Only one in 2500 molecules in air is CO2.
On the Y-axis we then have the incremental warming we might see, on average, across the surface of the Earth from increased concentrations of CO2. Unless I point it out explicitly, we will use Celsius throughout this and later chapters.
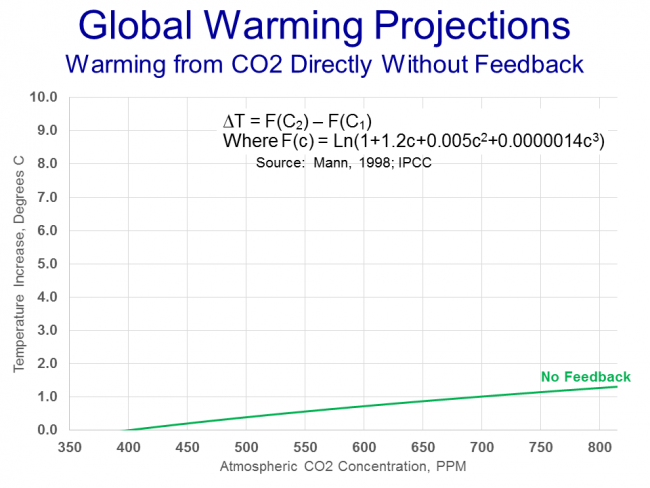
What we now want to do is graph the relationship between the concentrations of CO2 in the atmosphere and the temperature increase of the Earth. We will use 400 ppm and 0C increase as our starting points. For now (and we will come back to this assumption) we will look at just the direct effect of warming from the greenhouse gas effect of CO2 and leave out any other complicated, 2nd order interactions with the Earth and its climate.
The estimate I will use comes from Dr. Michael Mann and was first cited in the early IPCC reports. A quick note on the IPCC -- the IPCC is a body that meets every 5 years or so under the auspices of the United Nations to try to summarize the current state of climate science. Many skeptics, including myself, would argue that the IPCC process is flawed and overly politicized, but as much as possible in this series I will try to use the IPCC position, making it explicit when I differ. But what follows is very much IPCC canon. In fact, I like using Michael Mann's work here because, as author of the hockey stick, he is a vocal and prominent advocate on the alarmist end of the debate and certain not in the tank for the skeptic side.
The relationship is shown in the equation at the top (where delta T is the temperature increase and c is the atmospheric concentration in ppm). I have graphed the equation in green because most of us do not have a good intuition for what this equation might look like.
The first thing you might note is that the line is curved, and represents a diminishing return relationship, which means that each incremental molecule of CO2 in the atmosphere has less warming effect than the last (see my short presentation on the greenhouse gas effect here). Thus a constant rate of growth in CO2 concentrations would yield a slowing growth rate in temperatures. This is a well-understood relationship, so much so that the sensitivity of temperature to CO2 is generally written not as degrees per ppm but as degrees per doubling of CO2 levels. This means that the increase from 400-800 ppm would be expected to have about the same impact on temperature as the increase from 800 to 1600 ppm.
Of course, without any sense of CO2 growth rates, it's hard to relate this line to our lives. So as a next step, we will overly some CO2 forecasts for the atmospheric levels of CO2 by 2100. [As an aside, there is a group of skeptics that think that most CO2 increases are coming from warming itself, flipping the arrow of causality, rather than from man. There is some evidence for this proposition in ice core analysis, but I will leave it aside and for our purposes assume most CO2 increases in this century are coming from hydrocarbon combustion].
Though I think that their forecasts are exaggerated, I have taken the UN IPCC's 4 most likely CO2 cases for the year 2100 and overlayed them on the chart below:
Taking the midpoint of these forecasts, we arrive at about 1C of warming between now and the end of the century.
So now, if you are paying attention, you may be ready to call bullsh*t on me. Coyote, you say, every catastrophic forecast I have ever seen in the media is for WAY more than 1C of warming! Bill McKibbon says its going to be 10 degrees of warming (and if you can't trust Harvard journalism majors on scientific issues, who can you trust?) You are obviously lying, you evil denier.
Actually, not. Everything in this chapter has been pretty much canon in the global warming world. The direct, first order contribution of CO2 via the greenhouse effect is expected to be around a degree over the next century. So whence comes the catastrophe? As mentioned in the introduction, the catastrophe comes from a second, independent theory that the Earth's climate system is dominated by strong positive feedbacks that multiply greenhouse warming many times into a catastrophe.
If you have never heard of this second theory, don't be surprised. In many years of reading press articles on global warming, I can't remember one that adequately explained the two-part nature of the theory that is embedded in most global warming forecasts and climate models. But, perhaps not coincidentally, it is this second theory with which we skeptics have the most issues. We will take this up in our next installment.
No fair, introducing science into a global warming debate.
There is solid scientific evidence that the positive feedbacks know that they are only supposed to kick in when the warming is due to human induced CO2 warming. Positive feedbacks have a unique inherit ability to differentiate between the different causes of warming. In fact the positive feedbacks have demonstrated that ability by remaining dormant during any of the prior warming periods, yet knowing they will emerge to wreck havoc during any human caused co2 warming.
That observed 'diminished return' on CO2 is the hardest item for AGW to overcome when they are pushing for more carbon regulation, I heard the argument that CO2 'stacks up' higher and higher in the atmosphere. This supposedly overcomes their problem with CO2's absorption range. However I haven't been able to find any proof that actually is occurring. I tend to doubt it since CO2 is a relatively 'heavy' molecule.
In the meantime, the sun's output diminishes and the odds favor another major or minor ice age. While we put our money and resources on the wrong end result.
I do not believe that anyone knows, or has ever known the temperature of the earth to even the nearest 10 degrees, much less the 1/10 degree we need to discuss this issue. I work in engineering, and I would have a hard time finding out the correct, verifiable temperature of the warehouse I work in, much less the entire planet. Sticking a thermometer in the air is NOT the temp of the warehouse, only that of the air around the thermometer. When you look at temps before 1900, you are in the land of make believe. Also, water vapor (clouds, for instance) is way more heat absorbing than co2, yet somehow it isn't ever included in the models? Really? And ANY issue where the believers falsify records, lie, harass questioners, deny access to their data, and control billions or trillions of dollars is automatically suspect. As Jerry Pournelle says, in the last 1500 years, the earth has been both colder and warmer than it is currently, The crossing of the frozen Thames for colder (the little iceage) and the growing of grapes in Greenland for the warmer. It behooves us to spend money finding out the truth before we bankrupt the world economy to make a bunch of elites richer.
"There is simply too much evidence both from our and other planets (as well as simple experiments in a laboratory) to deny that greenhouse gasses in the atmosphere have a warming effect on planets, and that CO2 is such a greenhouse gas."
I be happy to examine this "too much evidence".
Thanks, in advance.
The atmosphere isn't in a greenhouse, and can expand and contract depending on the amount of energy it receives. I believe there's a research paper out there from some Germans expanding on this subject, as well as the madness of referring to a 'greenhouse effect', but it is difficult to rediscover it via search.
Water vapor most definitely is included in planetary greenhouse gas models, even the simple one used in my planetary astronomy class 25 years ago. (Clouds are not water vapor; they're liquid water.) But this author appears not to have included it, which would explain why he gets lower numbers. This rather destroys the credibility of what he says, as it's pretty rudimentary. He has separated discussion of greenhouse gases from feedbacks, but water vapor straddles both. It is a strong greenhouse gas (many small gaseous molecules are due to rotational and vibrational bands in the infrared), and its concentration depends largely on temperature. Thus, if temperature rises due to increased CO2 (or other greenhouse gas), then the concentration of gaseous H2O increases, thus the temperature rises an additional amount due to the additional greenhouse effect of the H2O.
Temperature measurement is largely by remote sensing (satellites, etc.), by which one can indeed measure the temperature of every location. Nothing pushing the envelope too hard there; basic meteorology sensing.
The temperature of the Earth has been quite a bit warmer than it is now, during the thermal maximum roughly fifty million years ago, well beyond even the alarmist predictions. (The middle of America was an inland sea, though, in part due to sea levels from the warmth.) In the 25 years since my planetary astronomy class in which we calculated the temperatures of the planets from first principle, including greenhouse gas effects, I've not read anything denying anthropogenic global warming that held up to five minutes of scrutiny, sadly, and much that supported it that seemed solid (and some that didn't). The amount of warming doesn't seem as well determined; it's too bad that this article seems to make such a hash of the topic as it's a topic worthy of serious exploration for the lay public. The question of what, if anything, to spend to slow CO2 release is also worthy of discussion, but leads to more heat than light, and questionable policy like forcing Canada to ship its tar to China rather than south Texas. The rapid advances of photovoltaic solar and batteries in recent years appear to be on track to make them cheaper outright than most conventional energy within years, far faster than governments can act. The best policy might be to get out of the way of solar.
I realize that your starting point, ln(1+1.2c+...), is supposed to be a neutral "scientific" fact on which all can agree. But it derives from a model, and that model includes certain assumptions. Like, the CO2 is perfectly mixed into the atmosphere, which consists of N2, with no H2O, and is stratified according to some rule or other. If you are going to make a model, you will need to have some such assumptions. But the thing is, those assumptions, whatever they may be, are demonstrably false. There is no "neutral" model from which to start. Your model may be "the consensus of both sides of the debate", but that does not make it science.
In fact, no one knows whether climate is even predictable. It is quite possible, on mathematical grounds, that climate is chaotic. This would mean that two sets of initial conditions which are arbitrarily close together, will ultimately diverge into very different outcomes.
What this would mean, is that it is easy to predict the weather for one minute, less so for five minutes, even harder for a week ... sound familiar?
If this strikes you as absurd -- how could there be anything Science can't predict -- imagine an island in the middle of a wide river. The river has twists, and turns, and narrow places. You are twenty miles upstream from the island. Put a drop of ink in the river. By the time it goes twenty miles, it will be thoroughly mixed. Half the molecules will go left of the island, and the other half will go right. Label one side of the island Glacial, and the other side Interglacial. Pick a molecule in the drop of ink. Make a model that can predict which side of the island it will pass. Show your work, the exercise will be graded.
It's a doubling from 280ppm that causes ~1.5C warming... not 400ppm.
If you REALLY want to see the evidence, check out the following:
[1] https://en.wikipedia.org/wiki/Greenhouse_effect
[2] http://www.skepticalscience.com/does-greenhouse-effect-exist-basic.htm
[3] http://www.realclimate.org/index.php/archives/2004/12/index/#Greenhouse
In Coyote's 'Basics' post s/he wrote: "...these gasses only absorb some but not all frequencies of radiation, there is a diminishing return effect. Each additional measure of a greenhouse gas added to the atmosphere absorbs less heat than the previous measure added." This is not true as there are more effects than are captured in the simplistic Mann equation Coyote used in "Greenhouse Gas Theory". Check out the Advanced tab at [1].
[1] http://www.skepticalscience.com/saturated-co2-effect-basic.htm
BTW: If "the sun's output diminishes and the odds favor another major or minor ice age" why is global temperature rising? Because of human greenhouse gas emissions & land–use changes.
An engineer should know that it is possible both to measure an average temperature for a building. E.g., HVAC engineers develop models for buildings before they're even built — and their models get better over time as they see how the resulting buildings perform and they tweak their models.
"...ANY issue where the believers ... control billions or trillions of dollars is automatically suspect." That describes fossil fuel interests better than it does climate scientists. Moreover, temperature data ARE available, e.g., the Berkeley Earth Surface Temperature project [1] (ramrodded by Nobel Physicist Richard Muller — not a climate scientist). They collected raw data from over 39,000 stations and did their own fresh analysis. Their results replicated climatologists'. [2]
Jerry's out of date. The idea that the world was globally warmer during the Medieval Warm Period and cooler than the Little Ice Age has been debunked by recent data. Previous work was biased by an overrepresentation of European data. More recent research shows the MWP was local to the N hemisphere & the remainder of the Earth had lower temps. Overall, the temps matched the mid–20th cent, lower than the 21st cent.. [3] Research suggests both the MWP & LIA were due to fluctuations in solar activity (hi in MWP, Maunder Minimum during LIA), number of volcanic eruptions (few during MWP, more during LIA), and orbital cycles. When these factors are incorporated into climate models, they replicate the regional and global effects. [3]
[1] http://berkeleyearth.org/
[2] http://berkeleyearth.org/summary-of-findings/
[3] http://www.skepticalscience.com/greenland-used-to-be-green.htm
https://en.wikipedia.org/wiki/Little_Ice_Age
https://en.wikipedia.org/wiki/Medieval_Warm_Period
Just as much of science contradicts 'common sense', chaotic doesn't mean totally random or unpredictable —even chaotic systems can show oscillations around 'strange attractors' and show spontaneous order. [1]
In fact, chaos is well established in climate models — in fact, Edward Lorenz 'discovered' chaotic behavior in an early atmospheric model. Climate modelers know there is a certain amount of chaos in the climate system — it generates oscillations like El Niño Southern Oscillation, the Atlantic Multidecadal Oscillation, etc. In fact it's easier to model long–term trends (climate) than it is to predict the weather more than a few days ahead. Check out [2] below.
Your river–ink–island analogy is not a good one; it assumes the island is in the middle, the flow on either side is equal, etc. State the topology & roughness of the riverbed, the volume of flow, and the position of the island and the location of the ink insertion, a hydrodynamicist could model the flow and estimate the probability distribution of where the ink particles would go. Predicting the behavior of a single particle (or water droplet in a cloud) is not necessary for developing a useful model.
[1] https://en.wikipedia.org/wiki/Lorenz_system
[2] http://www.realclimate.org/index.php/archives/2005/11/chaos-and-climate/