Denying the Climate Catastrophe: 5b. Natural Attribution
This is part B of Chapter 5 of an ongoing series. Other parts of the series are here:
- Introduction
- Greenhouse Gas Theory
- Feedbacks
- A) Actual Temperature Data; B) Problems with the Surface Temperature Record
- Attribution of Past Warming: A) Arguments for it being Man-Made; B) Natural Attribution (this article)
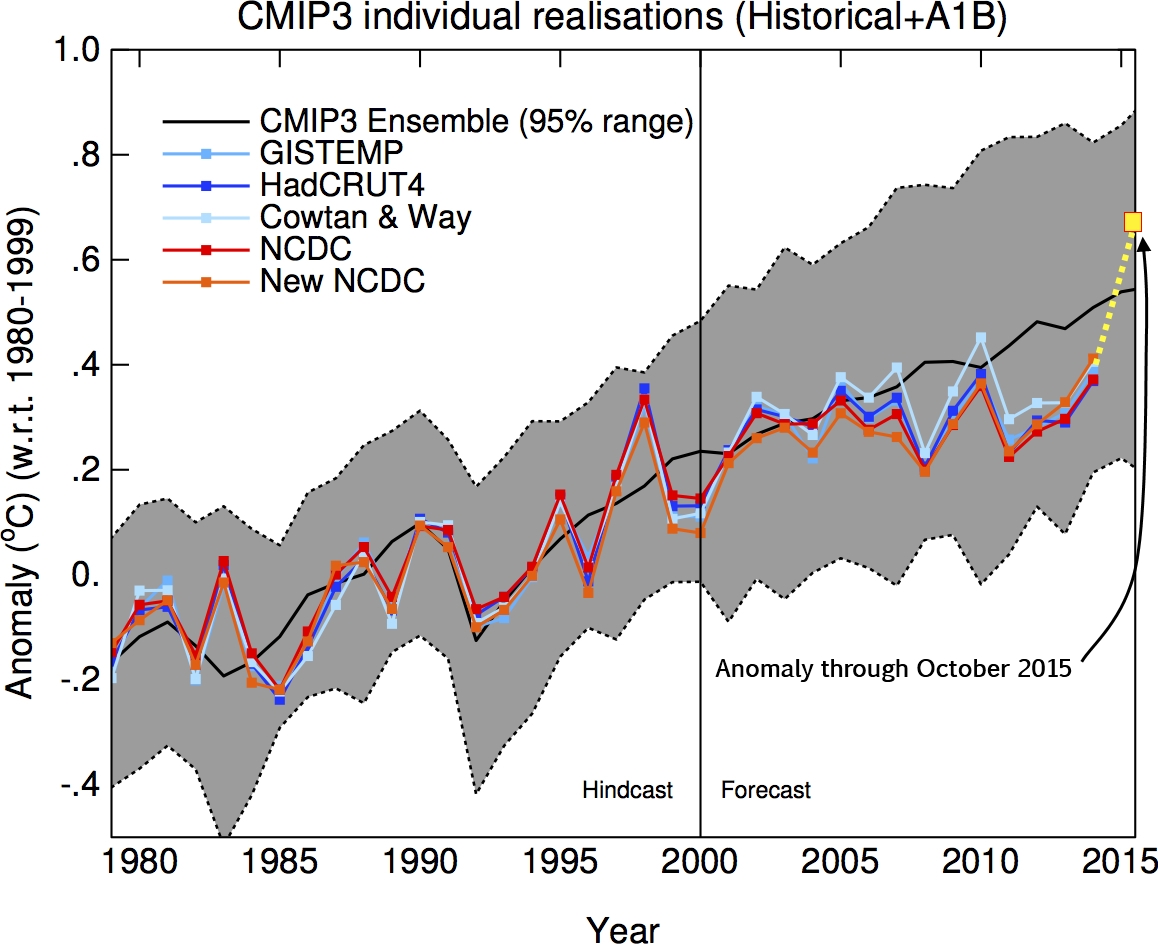
- Climate Models vs. Actual Temperatures
- Are We Already Seeing Climate Change
- The Lukewarmer Middle Ground
- A Low-Cost Insurance Policy
In part A, we discussed the main line of argument for attributing past warming to man-made CO2. In essence, scientists have built computer models to simulate the climate (and global temperatures). When these models were unable to simulate the amount of warming that occurred in the two decades between 1978 and 1998 using only what they thought were the major natural climate drivers, scientists concluded that this warming could not have been natural and could only have happened if the climate has a high sensitivity to man-made CO2.
This argument only works, of course, if the climate models are actually a correct representation of the climate. And that can only be proven over time, by comparing climate model output to actual weather. Back in chapter 4A, we briefly discussed how actual temperatures are in fact not tracking very well with climate model predictions, which should throw a substantial amount of doubt on the current quality of climate models (though the media still tends to treat model predictions as authoritative).
In this section, we will focus on some of the natural factors that are missing from most climate models. Obviously, if important natural drivers have been left out of the models, then one cannot conclude from the inability of the models to match historical warming that the historical warming couldn't have been natural. After discussing some of these factors, I will take my owns swing at the attribution problem.
Long-term Climate Shifts
We will begin with long-term climate variations. These are most certainly left out of the models, because no one really understands why they occur (though theories abound, of course). Mann's hockey stick not-withstanding, the consensus picture of past climate continues to include a strong warming period in the Middle Ages and a cool period, called the Little Ice Age, in the 16th and 17th centuries.

Imagine you were a climate modeler in 1600. Your model would probably have under-predicted temperatures over the next 200 years, because you were trying to model starting at the bottom of a long-term cyclical trend. So clearly leaving this trend out in 1600 would get the wrong answer. Wouldn't leaving it out in the year 2000 also get the wrong answer? All too often scientists tend to assume (though not always explicitly) that this long-term natural recovery of temperatures ended around 1950, at the same time they believe man-made warming started. A metaphorical hand-off occurred from natural to man-made factors. But there is no evidence for this whatsoever. We don't know what caused the Little Ice Age, so we don't know how long it can last or when it ends.
Changes in the Sun
Since we have mentioned it, let's discuss the sun. The sun is the dynamo that, along with a few smaller effects like the rotation of the Earth, drives the climate. We have known for some time that the Sun experiences cycles of variation, and one of the ways one can observe this variation is by looking at sunspots. We have more sophisticated ways of measuring the sun today, but we still count the spots.

Sunspots are cyclical in nature, and follow an eleven or so year cycle (you can see this in the spikes in the monthly light blue data above). But when one take this cycle out of the picture, as was done with the 10.8 year moving average above, there also appears to be longer cyclical trends. Since it is generally thought that more sunspots correlate with higher solar activity and output, one might expect that there could be some correlation between this solar trend and temperatures. As we can see above, by the sunspot metric the sun was more active in the second half of the last century than in the first half.
Today, we don't have to relay on just the spots, we can look at the actual energy output of the sun. And it turns out that the types of variations we have seen over recent decades in sunspots do not translate to very large changes in solar output on a percentage basis. Yes, there is more solar output but the extra amount is small, too small to explain much temperature variation. There is, though, an emerging new theory that a complex interaction of the sun with cosmic rays may affect cloud formation, acting as a multiplier effect on changes in solar output. A lot of skeptics, eager to support the natural causation argument, jumped on this theory. However, though the theory is intriguing and could turn out to be correct, I think folks are getting well ahead of the evidence in giving it too much credence at this point.
Ocean Cycles
At the end of the day, while solar variation may explain very long-cycle climate variations, it does not do much to explain our 1978-1998 warming period, so we will move on to another natural factor that does appear to have some explanatory power and which is also not in most climate models -- ocean cycles.
This is a complicated topic and I am far from an expert. In short: As mentioned in an earlier chapter, the oceans have far more heat carrying capacity than the atmosphere. It turns out that oceans have cycles, that are decades long, where they can exchange more or less heat with the atmosphere. In their "warm" periods, these cycles tend to leave more heat in the atmosphere, and in their "cold" periods they bury more heat in their depths. Once such cycle is called the Pacific Decadal Oscillation (PDO), which will be familiar to most Americans because "El Nino"and "La Nina" climate patterns are part of this PDO cycle. If one plots global temperatures against the PDO cycles, there is a good deal of correlation:

When the PDO has been in its warm phases (the red periods in the chart above), global temperatures rise. When it is in its cool phases (the blue zones), temperatures are flat to down. As you can see, the PDO was in a warm phase in our 1978-1998 period. Surely some of that steep rise in temperature may have come from the effect of this ocean cycle, yet this cycle was not included in the climate models that supposedly ruled out the possibility of natural causes for warming in this period.
A number of scientific studies have tried to remove these (and other) cyclical and event-based drivers from the historical temperature record. Here is one such attempt (ENSO and AMO are ocean cycles, large volcanoes tend to have a global cooling effect for a few years after their eruption)

With these natural effects removed, much of the cyclical variation from the Hadley CRUT4 data are gone, and we are left with a pretty constant linear trend. Aha! There is the warming signal, right? Well, yes, but there is a problem here for the effort to attribute most or all of this warming to man -- specifically, this is not at all the trend one would expect if the long-term trend were primarily from man-made CO2. Note the very linear trend starts around 1900, long before we began burning fossil fuels in earnest, and the trend is really quite flat, while man-made CO2 production has been growing exponentially. Supporters of man-made attribution are left in the uncomfortable position of arguing that there must have been natural warming until about 1950 which stopped just in time for man-made warming to take over.
My Attribution Solution
A number of years ago I decided to take a shot at the attribution problem, largely just for fun, but it turned out so well I still keep it up to date. I decided to assume just three factors: 1. A long term linear trend starting even before the 20th century, presumably natural; 2. A new added linear trend, presumably from man-made effects; and 3. A decadal cyclical factor, from things like ocean cycles. I let the optimization program control everything -- the slope of the linear trends, the amplitude and period of the cyclical factor, the start date of the second modern trend, etc, to get the best fit with historic temperatures. As before, I used monthly Hadley CRUT4 data.
This is what we ended up with. A 66-year sine wave:

Plus a long-term linear trend of 0.36C per century and a new linear trend beginning around 1950 that adds another 0.5C per century (for a total linear trend after 1950 of 0.86C per century).

The result was a pretty good fit 8 years ago and more importantly, still continues to be a good fit up to today (unlike much more complicated climate models)

Though the optimization was based on monthly data, you can see the fit even better if we add on a 5-year moving average to the chart:

That is, then, my solution to the attribution problem. Take the 0.5C per century since 1950 that this model has as a modern linear trend, and we will for argument sake attribute it all to man. From 1950-2016 (66 years, coincidentally my sin wave period) that is 0.33C of historic warming due to man-made CO2.
In the next chapter, we return to the climate forecasts we discussed in chapters 2 and 3 and ask ourselves whether these make sense in the context of past warming.
Chapter 6 on climate forecasts vs. actual temperatures is here.
Ok - so your model agrees with the IPCC - 0.86C past warming, 1.5C linear trend for CO2 doubling with no feedbacks (NB: IPCC actually estimates 1.2C). You've essentially came up with the exact same historical attribution as the IPCC.
Now, what about the future? You don't include feedbacks in your model, nor do you test against ice age and interglacial data (hint: you likely can't without feedbacks). Presumably, once you have a model that can get into and out of an ice age, explain large volcanic eruptions, etc. you're essentially going to end up where the IPCC is today. Will you change your mind then, or will you go back to the surface-temperature-data-is-crap argument (or one of the many others)?
I think you are missing the point that climate modeling is a crapshoot and climate factors are poorly understood. As Warren states, he made a simplistic model just for fun. He would certainly be the first to agree that it cannot possibly account for all variables. In fact, that was actually the point, to try and see how a overly simplistic model does.
I also recommend you read his previous articles and take down your straw man ("the surface-temperature-data-is-crap" is at best a distortion of his opinions).
All he did is find a model that fit the observed data. Of course it doesn't end with +4 celcius warming in 2100, so of course your response boils down to basically Denier!!'
I also like how you put words in his mouth regarding surface temp numbers and also how you assume massive positive feedback will happen any day now.
What about the future? Wait for it to happen, and see how well his model performs. The same as with any other model projection.
Warren, don't get me wrong here, it is always interesting and fun to visit your blog, which really great, but I think this climate-catastrophe-series is kind of misplaced; it is far too long in each of its parts and as a whole for this format and too uncomfortable to read (especially on a tablet). I understand that you want to get your message heard, but as much as I am concerned, I would be much more inclined to read it as
whole in a PDF-document than in different parts in a browser. Maybe there is a way of delivering the key points in your blog and to reference to an external document? You know, I always feel kind of lost without seeing the paper as a whole and with page-numbers…
Greetings from Germany!
This from 2011 also suggests a 66 year cycle
http://motls.blogspot.co.uk/2011/03/is-there-66-year-cycle-in-temperatures.html
Don't know if it is based on something Warren has said before or whether it is independently arrived at or whether Warren is aware of it. But worth considering, especially if independently arrived at.
The AMO/PDO cycles highlight the incompetence of the climate scientists or highlights the dishonesty of the climate scientists.
The AMO/PDO cycles have been known since the mid 1980's (they may not have known what they were until the late 1990's ) but they have definitely shown up in the temp reconstructions. To have omitted the effects of the cycles from the models shows that either A) the climate scientists had no clue that the existed even though they were prominent in the historical temp records or B) the climate scientists were trying to blow s**t by everyone.
The subsequent climate science cover story aptly highlights the continued incompetency and deception of the climate scientists where very few have acknowledged that the warming side of the cycles may have contributed to warming whereas the typical climate scientists espouse that the cooling cycle is the reason for the pause but deny the warming side of the cycle contributed to the warming. See Mann study from 2005 as an example of the typical climate scientist explanation.
> What about the future? Wait for it to happen, and see how well his model performs. The same as with any other model projection.
You misunderstand the goal. The goal is scenario planning, which requires a model that can be fed different assumptions.
Without modeling the variables, the best you can say is "if things in the future look like things in the past, we expect current trends to continue". Of course, we know that things in the future will decidedly *not* look like things in the past...so that's not very useful.
> I also like how you put words in his mouth regarding surface temp numbers
First - learn some reading comprehension before accusing someone of something. Particularly, note the difference between (and I'll highlight it for you, since you're evidently still new at this): "*THE* surface-temperature-data-is-crap argument" and "*YOUR* surface-temperature-data-is-crap argument".
Second, yes, it is a paraphrase - but I don't think it's a particularly objectionable one. Post 4b of this series is literally entitled "Problems With The Surface Temperature Record" and goes into quite a bit of detail of potential issues.
Third, though Warren is usually careful to ascribe most arguments to "skeptics" and couch his words in "potential" and "may", he does occasionally explicitly state his own views. For instance, from Warren's own postings (see, here's how I quote someone):
"This is one other reason why I tend to favor the satellite measurements...the satellite temperature metric had about 2/3 the trend of the surface temperature reading, or almost exactly what the surface readings would be if this siting bias were eliminated."
"they are not eliminating the urban bias...they are just spreading it around to other stations in the region."
> also how you assume massive positive feedback will happen any day now
I did no such thing. I did assume that he would need to model feedbacks to account for paleoclimate data (since that's what other researchers have had to do) and that once he did so, that his model would then come up with similar results for future scenarios as well. I don't see how that's objectionable - that's just math.
> climate modeling is a crapshoot and climate factors are poorly understood
Unsupported assertion.
> He would certainly be the first to agree that it cannot possibly account for all variables.
Well, since his model agrees with others that *can* account for more variables (not necessarily, or even likely, all variables - but that's irrelevant) - why don't we use one of them?
> In fact, that was actually the point, to try and see how a overly simplistic model does.
I support that line of questioning. My question is that now that he's validated the IPCC models, what next? Does he have a plan for invalidating them? Does he accept them? Were we not really testing anything?
> I also recommend you read his previous articles.
Luckily, I already did.
> take down your straw man ("the surface-temperature-data-is-crap" is at best a distortion of his opinions).
Not really a strawman, since I didn't attack it. Inflammatory? Yeah, probably. Distortion? Well (see above), I wasn't explicitly referencing his own arguments. And though it's devoid of nuance, I don't think it's much of a distortion of the larger skeptic communities arguments.
I also think it's an important question to consider - if his model ends up repeating the IPCC predictions, is he leaving the criticisms of the surface record alone? Or is he falling back on them as a way of invalidating his model? If the latter, then I don't really see a point in going through this modelling exercise - just attack the surface record.
We have no idea if the future will look like the past until it gets here. Warren's projection could turn out to be far more accurate than more complex models.
> Warren's projection could turn out to be far more accurate than more complex models.
Which would be evidence of what, exactly? That the global temperature anomaly is wholly dependent on time and time since 1940? Maybe there's a clock somewhere doubling as a thermostat....
Warren's "model" is useless, because his only independent variable is time (which we can't control). He also used the entire dataset to train it, which makes validating it historically impossible. It hasn't told us anything new, it simply summarized the existing dataset with temperature = f(time).
We could certainly wait and see if it's accurate, but that doesn't do us too much good right now - does it? On the other hand, IPCC models that come up with the same result as Warren's are more akin to temperature = f(CO2%, NO2%, Solar, Ice%, Land%) which means we can actually use it to model a possible future.
It's obviously possible the IPCC models are wrong for various reasons, but they've actually been tested against a range of scenarios, are consistent with other known observations, and can adequately describe other phenomena that Warren's model can't (which was my original comment - the simple f(time) function can't get you out of an ice age and then back in).
People who are interested in the truth do not go on like this defending a complicated model based on authority.
They begin with humility, skepticism and self-doubt.
One does not have to read thousands of papers to understand that all complex systems are chaotic. Models of them fail completely at predicting inflection points. Unfortunately, it is precisely the inflection points we want the models to predict.
In its essence, CAGW is a bet against skepticism, against the complexity of the reality contradicting the model. Obviously, all the scientists funded by public money in the world cannot prove that the model will not fail. Arguing its the best model available is no argument at all. Better models have failed in the past. What makes your model more failure-proof? Why can't it fail?
If you want to persuade people more intelligent than you are you will have to show how your model is more like other models of complex phenomena that have been successful in the past (if any) and less like the very impressive models that repeatedly have crashed into the ground. Can you do that?
Models are only useful if they make accurate predictions. You can't verify any model until you wait and see if they do. The predictions made by the various IPCC models have been consistently high compared to actual measurements, therefore relying on them as your source for policy recommendations is worse than wrong, it's counterproductive.
The predictions made by the various IPCC models have been consistently high
Aside from the fact GCMs don't predict, you are incorrect.
HTH
Best,
D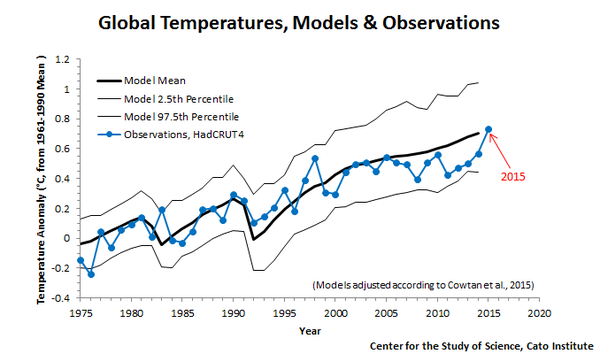

While the IPCC expresses confidence in their models, they have
included the following statements, compatible with Diane Merriam’s comment, in Chapter
9 of their Working Group One AR5 report (http://www.climatechange2013.org/images/report/WG1AR5_Chapter09_FINAL.pdf):
On prediction:
Climate models are the primary tools available for investigating
the response of the climate system to various forcings, for making climate
predictions on seasonal to decadal time scales and for making projections of
future climate over the coming century and beyond. - P6 746
On models running hot:
“However, an analysis of the full suite of CMIP5 historical
simulations… reveals that 111 out of 114 realizations show a GMST trend over
1998–2012 that is higher than the entire HadCRUT4 trend ensemble… This
difference between simulated and observed trends could be caused by some
combination of (a) internal climate variability, (b) missing or incorrect
radiative forcing and (c) model response error.” – Pg. 769
On verifying models against observations:
“An important consideration is that model performance can be
evaluated only relative to past observations, taking into account natural
internal variability.” – Pg. 824
Thanks, nothing in those texts refutes the charts I showed.
HTH
Best,
D
"nothing in those texts refutes the charts I showed"
You're right. Were you trying to make a point with those charts?
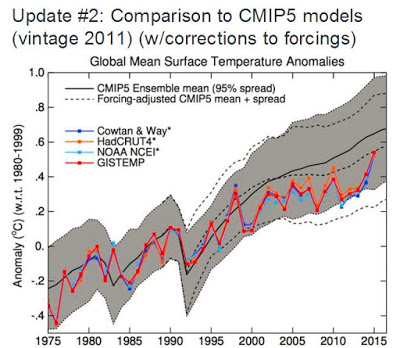
Yes, that the temps are back to being in line with the models. Easy to see.
Best,
D
Thanks. I like your first chart. The model used is from
Cowtan, K., et al., 2015, (Robust comparison of climate models with observations using blended land air and ocean sea surface temperatures. Geophysical Research Letters, 42). The authors of the paper ADJUSTED the model to match the method used to compile observation data. This is a good thing, they were able to account “for 38% of the discrepancy in trend between models and observations over the period 1975-2014.” However, that leaves 62% unaccounted for meaning the model still runs hot.
Interestingly enough, the person who produced your first chart also compared Cowtan et al’s model trends with HadCRUT4 observations, further demonstrating the warming bias: http://www.cato.org/publications/working-paper/climate-models-climate-reality-closer-look-lukewarming-world
The spike labeled 2015 corresponds with an el Nino event,
but it is also an estimate not an actual HadCRUT4 data point - see the thread under the first comment here https://climateaudit.org/2016/01/05/update-of-model-observation-comparisons/#more-21593
I like how you go to Cato and ClimateAudit for your science.
Cute.
best,
D
Your the one that posted the Cato chart.
I know - even the Catos of the world know about temps and models! Praise be!
Best,
D