Update on Climate Temperature Sensitivity (Good News, the Numbers are Falling)
I have not had the time to write much about climate of late, but after several years of arguing over emails (an activity with which I quickly grew bored), the field is heating up again, as it were.
As I have said many times, the key missing science in the whole climate debate centers around climate sensitivity, or the expected temperature increase from a doubling of CO2 concentrations in the atmosphere (as reference, CO2 in the industrial age has increased from about 270 ppm to close to 400 ppm, or about half a doubling).
In my many speeches and this video (soon to be updated, if I can just find the time to finish it), I have argued that climate computer models have exaggerated climate sensitivity. This Wikipedia page is a pretty good rehash of the alarmist position on climate sensitivity. According to this standard alarmist position, here is the distribution of studies which represent the potential values for sensitivity - note that virtually none are below 2°C.
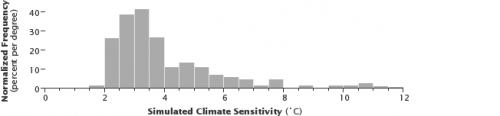
The problem is that these are all made with computer models. They are not based on observational data. Yes, all these models nominally backcast history reasonably correctly (look at that chart above and think about that statement for a minute, see if you can spot the problem). But many an investor has been bankrupted by models that correctly backcast history. The guys putting together tranches of mortgages for securities all had models. What has been missing is any validation of these numbers with actual, you know, observations of nature.
Way back 6 or 7 years ago I began taking these numbers and projecting them backwards. In other words, if climate sensitivity is really, say, at 4°C, then what should that imply about historical temperature increases since the pre-industrial age? Let's do a back of the envelope with the 4°C example. We are at just about half of a doubling of CO2 concentrations, but since sensitivity is a logarithmic curve, this implies we should have seen about 57% of the temperature increase that we would expect from a full doubling of CO2. Applied to the 4°C sensitivity figure, this means that if sensitivity really is 4°C, we should have seen a 2.3°C global temperature increase over the last 150 years or so. Which we certainly have not -- instead we have seen 0.8°C from all causes, only one of which is CO2.
So these high sensitivity models are over-predicting history. Even a 2°C sensitivity over-predicts the amount of warming we have seen historically. So how do they make the numbers fit? The models are tuned and tweaked with a number of assumptions. Time delays are one -- the oceans act as a huge flywheel on world temperatures and tend to add large lags to getting to the ultimate sensitivity figure. But even this was not enough for high sensitivity models to back-cast accurately. To make their models accurately predict history, their authors have had to ignore every other source of warming (which is why they have been so vociferous in downplaying the sun and ocean cycles, at least until they needed these to explain the lack of warming over the last decade). Further, they have added man-made cooling factors, particularly from sulfate aerosols, that offset some of the man-made warming with man-made cooling.
Which brings us back to the problem I hinted at with the chart above and its distribution of sensitivities. Did you spot the problem? All these models claim to accurately back-cast history, but how can a model with a 2°C sensitivity and an 11°C sensitivity both accurately model the last 100 years? One way they do it is by using a plug variable, and many models use aerosol cooling as the plug. Why? Well, unlike natural cooling factors, it is anthropogenic, so they can still claim catastrophe once we clean up the aerosols. Also, for years the values of aerosol cooling were really uncertain, so ironically the lack of good science on them allowed scientists to assume a wide range of values. Below is from a selection of climate models, and shows that the higher the climate sensitivity in the model, the higher the negative forcing (cooling) effect assumed from aerosols. This has to be, or the models would not back-cast.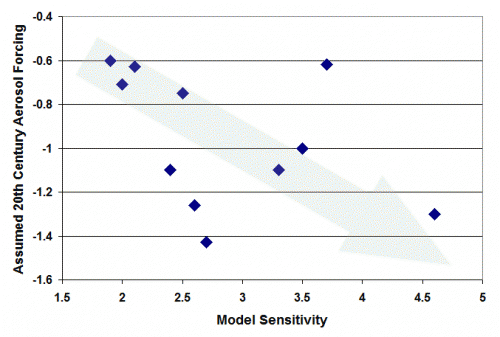
The reasons that these models had such high sensitivities is that they assumed the climate was dominated by net positive feedback, meaning there were processes in the climate system that would take small amounts of initial warming from CO2 and multiply them many times. The generally accepted value for sensitivity without these feedbacks is 1.2°C or 1.3°C (via work by Michael Mann over a decade ago). So all the rest of the warming, in fact the entire catastrophe that is predicted, comes not from CO2 but from this positive feedback that multiplies this modest 1.2°C many times.
I have argued, as have many other skeptics, that this assumption of net positive feedback is not based on good science, and in fact most long-term stable natural systems are dominated by negative feedback (note that you can certainly identify individual processes, like ice albedo, that are certainly a positive feedback, but we are talking about the net effect of all such processes combined). Based on a skepticism about strong positive feedback, and the magnitude of past warming in relation to CO2 increases, I have always argued that the climate sensitivity is perhaps 1.2°C and maybe less, but that we should not expect more than a degree of warming from CO2 in the next century, hardly catastrophic.
One of the interesting things you might notice from the Wikipedia page is that they do not reference any sensitivity study more recent than 2007 (except for a literature review in 2008). One reason might be that over the last 5 years there have been a series of studies that have begun to lower the expected value of the sensitivity number. What many of these studies have in common is that they are based on actual observational data over the last 100 years, rather than computer models (by the way, for those of you who like to fool with Wikipedia, don't bother on climate pages -- the editors of these pages will reverse any change attempting to bring balance to their articles in a matter of minutes). These studies include a wide range of natural effects, such as ocean cycles, left out of the earlier models. And, as real numbers have been put on aerosol concentrations and their effects, much lower values have been assigned to aerosol cooling, thus reducing the amount of warming that could be coming from CO2.
Recent studies based on observational approaches are coming up with much lower numbers. ECS, or equilibrium climate sensitivity numbers (what we would expect in temperature increases if we waited hundreds or thousands of years for all time delays to be overcome) has been coming in between 1.6°C and 2.0°C. Values for TCS, or transient climate sensitivity, or what we might expect to see in our lifetimes, has been coming in around 1.3°C per doubling of CO2 concentrations.
Matt Ridley has the layman's explanation
Yesterday saw the publication of a paper in a prestigious journal,Nature Geoscience, from a high-profile international team led by Oxford scientists. The contributors include 14 lead authors of the forthcoming Intergovernmental Panel on Climate Change scientific report; two are lead authors of the crucial chapter 10: professors Myles Allen and Gabriele Hegerl.
So this study is about as authoritative as you can get. It uses the most robust method, of analysing the Earth’s heat budget over the past hundred years or so, to estimate a “transient climate response†— the amount of warming that, with rising emissions, the world is likely to experience by the time carbon dioxide levels have doubled since pre-industrial times.
The most likely estimate is 1.3C. Even if we reach doubled carbon dioxide in just 50 years, we can expect the world to be about two-thirds of a degree warmer than it is now, maybe a bit more if other greenhouse gases increase too….
Judith Currey discusses these new findings
Discussion of Otto, one of the recent studies
Nic Lewis discusses several of these results
This is still tough work, likely with a lot of necessary improvement, because it is really hard to dis-aggregate multiple drivers in such a complex system. There may, for example, be causative variables we don't even know about so by definition were not included in the study. However, it is nice to see that folks are out there trying to solve the problem with real observations of Nature, and not via computer auto-eroticism.
Postscript: Alarmists have certainly not quit the field. The current emerging hypothesis to defend high sensitivities is to say that the heat is going directly into the deep oceans. At some level this is sensible -- the vast majority of the heat carrying capacity (80-90%) of the Earth's surface is in the oceans, not in the atmosphere, and so they are the best place to measure warming. Skeptics have said this for years. But in the top 700 meters or so of the ocean, as measured by ARGO floats, ocean heating over the last 10 years (since these more advanced measuring devices were launched) has been only about 15% of what we might predict with high sensitivity models. So when alarmists say today that the heat is going into the oceans, they say the deep oceans -- ie that the heat from global warming is not going into the air or the first 700 meters of ocean but directly into ocean layers beneath that. Again, this is marginally possible by some funky dynamics, but just like the aerosol defense that has fallen apart of late, this defense of high sensitivity forecasts is completely unproven. But the science is settled, of course.