Global Warming Updates
I have not been blogging climate much because none of the debates ever change. So here are some quick updates
- 67% to 90% of all warming in climate forecasts still from assumptions of strong positive feedback in the climate system, rather than from CO2 warming per se (ie models still assuming about 1 degree in CO2 warming is multiplied 3-10 times by positive feedbacks)
- Studies are still mixed about the direction of feedbacks, with as many showing negative as positive feedback. No study that I have seen supports positive feedbacks as large as those used in many climate models
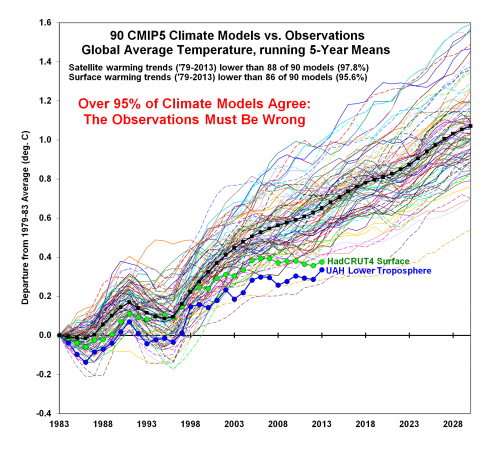
- As a result, climate models are systematically exaggerating warming (from Roy Spenser, click to enlarge). Note that the conformance through 1998 is nothing to get excited about -- most models were rewritten after that date and likely had plugs and adjustments to force the historical match.
- To defend the forecasts, modellers are increasingly blaming natural effects like solar cycles on the miss, natural effects that the same modellers insisted were inherently trivial contributions when skeptics used them to explain part of the temperature rise from 1978-1998.
- By the way, 1978-1998 is still the only period since 1940 when temperatures actually rose, such that increasingly all catastrophic forecasts rely on extrapolations from this one 20-year period. Seriously, look for yourself.
- Alarmists are still blaming every two or three sigma weather pattern on CO2 on global warming (polar vortex, sigh).
- Even when weather is moderate, media hyping of weather events has everyone convinced weather is more extreme, when it is not. (effect explained in context of Summer of the Shark)
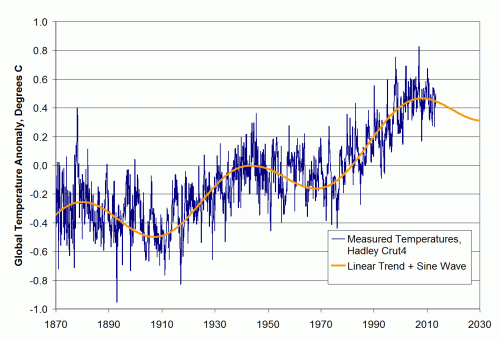
- My temperature forecast from 2007 still is doing well. Back in '07 I regressed temperature history to a linear trend plus a sine wave.


I've seen a number of charts that have a ~ 60 year sine wave over a linear increase, but I can't think of a 60 year cycle of natural phenomena, any ideas?
Ocean oscillations have been on a 64 year cycle for all of measured data.
The two primary drivers of average global temperatures explain the reported
up and down measurements since before 1900 with 90% accuracy and provide
credible estimates back to the low temperatures of the Little Ice Age (1610).
CO2 change is NOT one of the drivers.
The drivers are given at
http://agwunveiled.blogspot.com/
which includes eye opening graphs and a plethora of links and sub-links to
the credible data sources that were used.