Denying the Climate Catastrophe: 4b. Problems With The Surface Temperature Record
This is the part B of the fourth chapter of an ongoing series. Other parts of the series are here:
- Introduction
- Greenhouse Gas Theory
- Feedbacks
- A) Actual Temperature Data; B) Problems with the Surface Temperature Record (this article)
- Attribution of Past Warming; A) Arguments for it being Man-Made; B) Natural Attribution
- Climate Models vs. Actual Temperatures
- Are We Already Seeing Climate Change
- The Lukewarmer Middle Ground
- A Low-Cost Insurance Policy
In part A of this chapter, we showed that the world had indeed warmed over the past 30-100 years, whether you looked at the surface temperature record or the satellite record. Using either of these metrics, though, we did not see global warming accelerating, nor did we see warming rates that were faster than predicted. In fact, we saw the opposite.
One story I left out of part A, because it did not affect the basic conclusions we drew, is the criticisms of the surface temperature record. In this part B, we will discuss some of these criticisms, and see why many skeptics believe the 0.8C warming number for the past century is exaggerated. We will also gain some insights as to why the satellite measured warming rates may be closer to the mark than rates determined by surface temperature stations.
Uncorrected Urban Biases
Years ago a guy named Steve McIntyre published a graphical portrayal of warming rates across the US. This is a common chart nowadays. Anyway, this chart (almost 10 years old) drew from temperature measurement stations whose locations are shows with the crosses on the map:
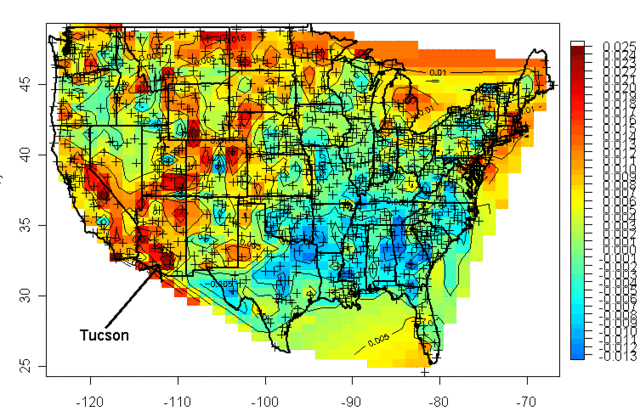
I was living in Arizona at the time and I was interested to learn that the highest warming rate was being recorded at the USHCN station in Tucson (remember, just because Arizona is hot is no reason to necessarily expect it to have high warming rates, they are two different things). At the time, Anthony Watt was just kicking off an initiative to develop quality control data for USHCN stations by having amateurs photograph the sites and upload them to a central data base. I decided I would go down to the Tucson site to experience the highest warming rate myself. This is what I found when I tracked down the station, and took this picture (which has been reproduced all over the place at this point):

That is the temperature station, around that fenced in white box (the uproar over this picture eventually caused this location to be closed). It was in the middle of a parking lot in the middle of a major university in the middle of a growing city. 100 years ago this temperature station was in the countryside, in essentially the open desert - no paving, no buildings, no cars. So we are getting the highest warming rates in the country by comparing a temperature today in an asphalt parking lot in the middle of a city to a temperature a hundred years ago in the open desert.
The problem with this is what's called the urban heat island effect. Buildings and concrete absorb heat from the sun during the day, more than would typically be absorbed by raw land in its natural state. This heat is reradiated at night, causing nights to be warmer in cities than in the areas surrounding them. If you live in a city, you will likely hear weather reports that predict colder temperatures in outlying areas, or warn of freezes in the countryside but not in the city itself.
It turns out that this urban heat island effect is easily measured -- it even makes a great science fair project!

My son and I did this project years ago, attaching a small GPS and temperature probe to a car. We then drove out of the city center into the country and back in the early evening, when the urban heat island effect should be largest. We drove out and then back to average out any effects of overall cooling during our testing. One of the trips is shown above, with around 6 degrees F of temperature change. We, and most others who have done this in other cities, found between 5 and 10 degrees of warming as one drives into a city at night.
If this effect were constant over time, it would not pose too many problems for our purposes here, because we are looking at changes in average temperatures over time, not absolute values. But the urban heat island warming of a city (and particular temperature stations) increases as the urban area grows larger. Because this urban warming is many times the global warming signal we are trying to measure, and since most temperature stations are located near growing urban locations, it introduces an important potential bias into measurement.
A number of studies have found that, in fact, we do indeed see more warming historically in thermometers located in urban areas than in those located in rural areas. Two studies in California have shown much lower warming rates at rural thermometers than at urban ones:


Anthony Watt has been working for years to do this same analysis for the entire US. In fact, the pictures taken above of the temperature station in Tucson were part of the first phase of his project to document each USHCN site used in the global warming statistics with pictures. Once he had pictures, he compared the details of the siting with a classification system scientists use to measure the quality of a temperature sites, from the best (class 1) to the worst with the most biases (class 5). He found that perhaps a third of the warming in the official NOAA numbers may come from the introduction of siting biases from bad sites. Or put another way, the warming at well-sited temperature stations was only about 2/3 in the official metric.

By the way, this is one other reason why I tend to favor the satellite measurements. Going back to the numbers we showed in part A, the satellite temperature metric had about 2/3 the trend of the surface temperature reading, or almost exactly what the surface readings would be if this siting bias were eliminated (the absolute values of the trends don't match, because they are for different time periods and different geographies).

There is one other aspect of this chart that might have caught your eye -- if some temperature stations are showing 2 degrees of warming and some 3.2 degrees of warming, why is the total 3.2 degrees of warming. Shouldn't it be somewhere in the middle?
One explanation is that the NOAA and other bodies take the data from these stations and perform a number of data manipulation steps in addition to a straight spatial averaging. One such step is that they will use a computer process to try to correct temperature stations based on the values from neighboring stations. The folks that run these indices argue that this computational process overcomes the site bias problem. Skeptics will argue that this approach is utter madness -- why work to correct a known bad temperature point, why not just eliminate it? If you have a good compass and a bad compass, you don't somehow mathematically average the results to find north, you throw out the bad one and use the good one. In short, skeptics argue that this approach does not eliminate the error, it just spreads the error around to all the good stations, smearing the error like peanut butter. Here is an example from the GISS, using station data that has only been adjusted for Time of Observation changes (TOBS).

This is exactly what we might expect - little warming out in undeveloped nature in Grand Canyon National Park, lots of warming in a large and rapidly growing modern city (yes, the Tucson data is from our favorite temperature station we featured above). Now, here is the same data after the GISS has adjusted it:

You can see that Tucson has been adjusted down a degree or two, but Grand Canyon has been adjusted up a degree or two (with the earlier mid-century spike adjusted down). OK, so it makes sense that Tucson has been adjusted down, though there is a very good argument to be made that it should be been adjusted down more, say by at least 3 degrees. But why does the Grand Canyon need to be adjusted up by about a degree and a half? What is currently biasing it colder by 1.5 degrees, which is a lot? One suspects the GISS is doing some sort of averaging, which is bringing the Grand Canyon and Tucson from each end closer to a mean -- they are not eliminating the urban bias from Tucson, they are just spreading it around to other stations in the region.
Temperature Adjustments and Signal-To-Noise Ratio
Nothing is less productive, to my mind, than when skeptics yell the word "fraud!" on the issue of temperature adjustments. All temperature databases include manual adjustments, even the satellite indices that many skeptics favor. As mentioned above, satellite measurements have to be adjusted for orbital decay of the satellites just as surface temperature measurements have to be adjusted for changes in the daily time of observation. We may argue that adjustment methodologies are wrong (as we did above with urban biases). We may argue that there are serious confirmation biases (nearly every single adjustment to every temperature and sea level and ocean heat database tends to cool the past and warm the present, perhaps reinforced by preconceived notions that we should be seeing a warming signal.) But I find that charges of fraud just cheapen the debate.
Even if the adjustments are all made the the best of intentions, we are still left with an enormous problem of signal to noise ratio. It turns out that the signal we are trying to measure -- warming over time -- is roughly equal to the magnitude of the manual adjustments. In other words, the raw temperature data does not show warming, only the manually adjusted data show warming. This does not mean the adjusted data is wrong, but it should make us substantially less confident that we are truly measuring the signal in all this noise of adjustment. Here are two examples, for an individual temperature station and for the entire database as a whole:

In this first example, we show the raw data (with Time of Observation adjustments only) in orange, and the final official adjusted version in blue. The adjustments triple the warming rate for the last century.

We can see something similar for the whole US, as raw temperature measurements (this time before time of observation adjustments) actually shows a declining temperature trend in the US. In this case, the entirety of the global warming signal, and more, comes from the manual adjustments. Do these adjustments (literally thousands and thousands of them) make sense when taken in whole? Does it make sense that there was some sort of warming bias in the 1920's that does not exist today? This is certainly an odd conclusion given that it implies a bias exactly opposite of the urban heat island effect.
We could go into much more detail, but this gives one an idea of why skeptics prefer the satellite measurements to the surface temperature record. Rather than endlessly working to try to get these public agencies to release their adjustment details and methodology for third party validation to the public that pays them (an ongoing task that still has not been entirely successful), skeptics have simply moved on to a better approach where the adjustments (to a few satellites) are much easier to manage.
Ultimately, both approaches for seeking a global warming signal are a bit daft. Why? Because, according to the IPCC, of all the extra warming absorbed by the surface of the Earth from the greenhouse effect, only about 1% goes into the atmosphere:

Basically, water has a MUCH higher heat carrying capacity than air, and over 90% of any warming should be going into oceans. We are just starting to get some new tools for measuring the changes to ocean heat content, though the task is hard because we are talking about changes in the thousandths of a degree in the deep oceans.
After this brief digression into the surface temperature records, it is now time to get back to our main line of discussion. In the next chapter, we will begin to address the all-important attribution question: Of the warming we have seen in the past, how much is man-made?
Chapter 5, Part A on the question of attributing past warming to man is here.
Am I missing something. Aren't there other greenhouse gases such as CH4, N2O, or CFCs? I understand they are in much lower percentages but they have much larger warming impacts. If I remember correctly, N2O absorbs about 300 times more heat than CO2. Why is all the talk about C2O and not the other man made gases?
According to the EPA website, CO2 accounts for 82% of total greenhouse gases, with 94% of that coming from electricity generation, transportation, industry and residential/commercial sources. For N2O, the percentages are 5% total, and 16% of that from corresponding sources.
WAG- CO2 presents a larger target for the control freaks.
Exactly. You can regulate nearly everything through CO2, not so with other greenhouse gasses.
Clearly they left out the most important and most common GHG, water vapor.
4b problems? What is this hexadecimal? Why not just say 59 problems? Oh. Yeah. Right. Sorry. Reasons not to look at web pages at work #47.
You may feel constrained by the need to not offend true believers but it is hard to believe there is not fraud going on in much of this. Are we to believe that weather scientists did not recognize the urban heat island effect until it was forced upon them? Are we to believe that the scientific community does not understand that satellite measurements exist when they choose to always cite flawed (and adjusted) surface records when stating their case? Are we to believe that these same climate scientists don't know that the IPCC's mainline predictions are for almost all the warming to occur at night in high latitudes in the winter and through ignoring this choose to highlight and exaggerate their predictions of doom in the mid latitudes?
I find this all so unbelievable that, without accounting for fraud, I cannot believe they have just erred! This, to me, is the most worrisome thing about the whole AGW scam. If and when the majority of the public comes to understand how corrupted the scientific community has become in the pursuit of $$ and prestige how will they ever regain trust? Not believing scientific findings is not a good place to be but after seeing how long and how pervasive the fraud seems to be what is an intelligent layman to believe?
The biggest takeaway from the mess of the temperature data is what it tells us about the lack of competence and failure of climate science to have any quality control.
I have to agree with you. The old saying is "do not ascribe to deceit what can be reasonably ascribed to incompetence." That word "reasonably" is the sticking point. In the case of CAGW, the so-called adjustments have gone (in my opinion) far beyond what can reasonably be ascribed to incompetence. If it were merely incompetence, we would expect that there would not be such an overwhelming bias toward warming the trends, and such a rare occurrence of adjustments making the trends cooler.
See, this is why climate skeptics aren't taken seriously. You act like you're doing science, but you're really just Monday morning quarterbacking.
What you have here is nothing more than a bunch of (mostly implied) *hypotheses*, and you're trying to overturn a *theory* based on that. On your side, you have a few questions and things that don't quite add up (to you). On the other side, we have thousands(?) of scientists with decades(?) of research and generally concurrent independent evidence pointing to the same thing. Even if you were to find a gaping error in USHCN data or adjustments, there are literally thousands of other data points you'd need to call into question or offer a more compelling theory for - otherwise, the body of evidence still weights against you.
Oddly, the ones calling it a conspiracy are actually in a slightly more rational position - since a conspiracy is, by definition, almost impossible to prove. By making an unprovable claim, they've removed science altogether. You're trying to use "science", but don't want your claims subject to scientific scrutiny - instead of scientific review, you publish for a popular audience (who self select to largely agree with you). By doing so, you get away with making unsubstantiated and implied claims with very little evidence, and get a pass on having an incomplete theory.
I think the major sin in most of these pieces is conflating your hypotheses (eg., USHCN data shows an inaccurate warming bias due to poor siting) with your theory (eg., that global warming is the product of mass and systemic errors). I realize the end game is to replace the over arching global warming theory, but you have to start by chipping away at the foundations with simple, understandable and repeatable hypotheses. A post with 50 different implicitly stated hypotheses, assumptions, and conclusions isn't worth the effort to dissect - the fact no one has adequately responded to your points isn't necessarily evidence that no one knows or wishes to debate, instead of that your argument is just sloppily stated.
To pick just one example out of many, the siting issues with USHCN have been reviewed and found reliable to the seeming satisfaction of others. If you wish to reopen the hypotheses that placement skews the results upwards, then you're going to need to offer some additional evidence of that *and* dispute the evidence already gathered that shows otherwise. You don't even cite the evidence already gathered - whether that's out of ignorance, malice, or laziness doesn't really matter, but it's unreasonable to expect someone who does know of that evidence to take you seriously on the matter.
Same thing if you wish to cite other's research as evidence for your own, such as LaDochy's 2007 paper. Though LaDochy did find a difference in urban vs. rural trends, you now wish to extend that as evidence for siting bias. However, since 2007, multiple researchers have considered and tested other hypotheses to explain LaDochy's findings - so you'll need to offer some further evidence that can explain their findings as well. You can't cherry pick from thousands of papers for just the findings that support your hypotheses and then expect to use them as solid evidence for your theory.
None of the above should be construed as me claiming you're "wrong" or the consensus is "right" in some sort of existential way. Anything is possible, and it is *possible* that everything you laid out is the ultimate "truth". But you have presented a poor argument with little evidence, so you'd be right for the wrong reasons. For those of us that understand that, we don't actually "care" if what you speak is the "truth" - because we have no logical basis to conclude that, so it'd be irrational to believe you anyway.
TL;DR version - I can't expect to disprove the theory of gravity because I found what looks to me like some inconsistencies in 500 year old research papers.
One reason some of us don't believe because, surprise, it allegedly requires a government solution that consist of raping me of more taxes and giving money to the government. If GW were that serious, the elite would take the lead and never fly again, and demolish their mansions consuming much of the resources. Don't forget the bankrupting renewable energy scam.
GW is right up there with the ozone hole BS being caused by freon.
There are other environmental issues the money could have been spent.
I helped set up ambient air monitoring sites for ozone. If one were trying to follow the some of the siting guidelines, it is difficult to get an ideal site. An ideal site is a patch of grass relatively far from too many high buildings and other structures. You certainly do not want an air temperature sensor located above a block of rock or concrete. There is also issue of whether a 'site operating procedure' was written and followed; again human beings are involved so things get lost sometimes.
> One reason some of us don't believe because, surprise, it allegedly requires a government solution that consist of raping me of more taxes and giving money to the government.
Then you don't need this article dressed up as "science" to make your argument, nor should it influence your opinion. If you reject the premise, then the science doesn't really matter.
The problem here is Coyote (and others) thinking that because he's spent a considerable amount of time on this treatise, and has some understanding of the processes involved, that it rises to the level of science - it doesn't.
Unfortunately, some otherwise not conspiracy-minded folks see these types of posts and think there's an actual scientific debate here. They use this scientific "debate" as evidence for the conspiracy - but they don't understand that a guy yelling "The End Is Near" on the street corner isn't debating the Catholic Church. He's just crazy.
First virtually all skeptics acknowledge the earth has been on a warming trend since circa 1850, with pause in the cooling trend circa mid 1700's, along with recognizing that the greenhouse gases play some role in the warming.
So why do skeptics not believe the AGW theory - M
maybe - because the "climate scientists get caught lying so often -
for example
1) Basing the models on a continuation of the rate of warming during the warming cycle of the AMO, even though the climate scientist knew it was the warming cycle of the amo
2) Mann's claim that the pause is due to cooling cycle of the amo but that non of the warming was due to the amo
3) failing the acknowlege the amo until they gat caught
4) denying the warm and / or warmer mwp
5 ) using the 20-30 proxies used in the HS temp reconstruction which were neutral was to whether the MWP was warmer or cooler
6) omitting the 20-30 proxies that showed a warmer MWP,
7) creating the "theory of a 400 year weather event" to explain the regional nature of the MWP as if a single meteorologist would believe such an event could occur.
These are just a few examples,
The agw scientists would help the science if they did a better job policing the bad scientists
I'll try this with an analogy that I hope should be easily understandable, considering the audience.
Scientific knowledge is, at its core, a free market of ideas. Those ideas that get "consensus" while being actively researched, are similar to the stock market with high volume of trade and low volatility of price - we assume that we are near the "truth" (either idea or price). Pointing out previous fluctuations in the price doesn't invalidate the current conclusion; in fact, it just shows evidence of the market working to correct misinformation.
It sounds like you wish to make a claim that the market itself is corrupt, no longer free, and so it's conclusions cannot be trusted. If that's your position, then you need to work outside the market itself - as conspiracy theorists do. You can't use the conclusions of the market to show the market was incorrect prior - that's not a bug, that's the essential feature. Nor can you point to individual market participants that were on the wrong side of the price previously (for whatever reason) as evidence the current price is incorrect.
If you wish to play in the market, as Coyote evidently does, then you need to adhere to the rules of the market - otherwise, you're actually playing in a completely different market (which he is). That's fine as far as it goes - there's plenty of markets to be had - but not everybody realizes Coyote and eg., Mann are in different markets, so when they think they're looking at the price for the NYSE, they're really looking at the price of Coyote Stock Exchange *pretending* to be the NYSE. If done purposefully, that's fraud - I don't think Coyote believes he's in a different market, so it's just ignorance - but it still leads to bad decisions all around.
If Coyote thinks he has a better market than science for ideas, then present one - I'm not convinced that dueling dense and wandering blog posts with no original research or citations *is* a better market, but maybe I'm wrong and we'll start studying gravitational waves this way too.
Besides, I don't particularly care if you don't believe the AGW theory - I don't believe Apple is worth anywhere near $600B, either. That doesn't make me right and the NYSE wrong, though.
"It sounds like you wish to make a claim that the market itself is corrupt, no longer free, and so it's conclusions cannot be trusted"
Would you consider trusting all the science when so much of what is portrayed as settled is pure crap
such as denying the amo played a role in the warming of the 80's & 90's but that the cause of the pause was due to the amo - see mann's 2014/2015 study
the regional nature to the mwp - ie a 300-400 year "weather event"
Marcott's study - pure crap
the positive feedback even though it never occurred in prior warmings
the projected arctic methane explosion due to co2 induced warming even though it never occurred in prior warmings
At some point - the scientists need to police themselves.
Steve McIntyre has embarrassed a few of the scientist, along with numerous withdrawn studies as a result of his critique of their work, though the activists continue to berate him and his work instead of recognizing crappy work.
> Would you consider trusting all the science when so much of what is portrayed as settled is pure crap?
Pretty much, yeah. Mainly because I have no better alternative. I also recommend trusting the NYSE that Apple is worth $600B (instead of my ~$200B estimate) - even though the stock exchange has been "wrong" before and Bernie Madoff, etc.
Last point, and then I'll leave you alone in peace (I appreciate the civil discourse - though recognize we can likely only agree to disagree on this topic).
In my mind, there's really only two ways to prove global warming "false" (I keep using quotes as to make a distinction between logical truths and our current, best estimates of physical truths - which is what science is concerned with):
- Use the existing scientific framework to show repeatable, verifiable, unexpected, and unexplained results that require a new or modified theory to explain
- Show the existing scientific framework as inadequate, easily corruptible, or otherwise consisting of such systemic problems that it must be torn down and replaced. This may happen due to #1 (if, after being proven false, such matters come to light calling into question the reliability of the process). It could also happen due to politicking - in which case the evidence need only be enough to convince a portion of powerful interests (government, funding agencies, prominent scientists, the public, etc.).
Coyote and others think they are doing #1, but because he's not actually using the existing framework of research, peer-review, etc. - he will have no effect there. At most, he will bring some information to light that someone else will bring into the framework to study. This path will also likely take years if not decades of research, absent some bombshell revelation.
You and others think they are doing #2 (and so is Coyote, though I don't think he understands that). Though I find most of the evidence here less than compelling, there does seem to be some traction gaining. I'm not sure, however, that you recognize what you're actually claiming and the likely results if what you claim are believed to be true. With claims of malfeasance, you're actually fighting our current *institution* of science - not global warming.
If you're "right" - in the best case, science will be restricted from anything that could be controversial so as to ease corruption concerns; and of course, any findings can be retroactively classified as controversial. In the worst case, we'll just upend the framework all together, which will lead to a decades or longer pause of effective research.
We're seeing a small preview of that in social sciences with Baumeister's ego depletion theory. Though that's been brought on from within the framework, it's starting to raise questions about the framework itself. I don't know what the long term implications of that will be (and I think it's sufficiently isolated from the physical sciences that we won't be impacted much), but it's yet another chink in the foundations (which social sciences have always had a bit of a reproduciblity problem) that may cause a rethink of the process.
stevewfromford: Are we to believe that weather scientists did not recognize the urban heat island effect until it was forced upon them?
No. Scientists have been aware of, and analyzed, the heat island effect on global temperature trends.
stevewfromford: Are we to believe that the scientific community does not understand that satellite measurements exist when they choose to always cite flawed (and adjusted) surface records when stating their case?
No. The scientific community understands and uses satellite measurements in their research.
stevewfromford: Are we to believe that these same climate scientists don't know that the IPCC's mainline predictions are for almost all the warming to occur at night in high latitudes in the winter and through ignoring this choose to highlight and exaggerate their predictions of doom in the mid latitudes?
No. Climate scientists were integral to the IPCC's mainline predictions, and believe that changes in the high latitudes will have profound climate effects on the mid latitudes.
You are still giving the benefit of the doubt and not acknowledging the outright fraud. NASA and NOAA have pumped up the temperatures by 1/2 degree just because in addition to the urban heat island effect.
http://principia-scientific.org/corrupt-government-scientists-caught-hiding-data-proving-global-cooling/
This shows how a study in 1974 showing a temperature increase from about 1880 to 1942 and a drop in to 1974, has the drop almost completely erased, in modern NASA temperature charts.
http://principia-scientific.org/corrupt-government-scientists-caught-hiding-data-proving-global-cooling/
In 5 or 6 years we will freeze to death, while having the worlds "record" temperature by 2/100 of a degree, again. At some point the disconnect between the glaciers encroaching our homes and the hottest temperatures on record will be so great the whole thing will collapse (or be carefully wiped away)
As far as satellite records, they actually switch back and forth between measurements from satellite to terrestrial, depending on which is showing the data they want to show. In the late 90's and early ots the satellite was king, now we see reports that - satellites shouldn't be trusted, lets look at the ground data instead.
Also there is the cherry picking of the data. 1974 is when we started getting good satellite data on temps, and sea ice, and snow ground cover. 1979 was chosen, because it was a maximum. If 1974 were chosen our current sea ice levels in the northern hemisphere would look normal.
And then there is the sad fact that they are only using satellite data from 1979 to present.
BTW your third comment to steve is a non-sequitur having nothing to do with his statement, which is a true statement.
No, they have been faking the data and changing data to make it more AGW friendly for many years. It isn't just about accidentally missing heat islands. Temperature sources not showing the correct results are routinely adjusted upward. Areas of the earth that are warming are routinely given more statistical significance than areas that are cooling (Like Peru a few years ago, where it was decided their temp stations really should represent a much greater area, while cooler stations should be diminished Viola! another 2/100 of a degree temp record)
If GW were serious, people on their own would take the lead and find affordable solutions to the problem. You are correct AGW is just a way of milking the government for grants for research positions at our overly large university system, and the government goes along because governments love crisis, it allows them to regulate, tax and control.
marque2: As far as satellite records, they actually switch back and forth between measurements from satellite to terrestrial
So you disagree with stevewfromford, who claimed that satellite data is ignored.
marque2: In the late 90's and early ots the satellite was king, now we see reports that - satellites shouldn't be trusted, lets look at the ground data instead.
That is incorrect. Both data-sets are used, as can be seen with even a cursory look at the scientific literature.
marque2: 1979 was chosen, because it was a maximum. If 1974 were chosen our current sea ice levels in the northern hemisphere would look normal.
Oh?
http://neven1.typepad.com/.a/6a0133f03a1e37970b01b7c809c471970b-pi
marque2: BTW your third comment to steve is a non-sequitur having nothing to do with his statement, which is a true statement.
Climate scientists don't ignore the fact that higher latitudes are expected to have more warming. It's integral to climate projections.
Blaming carbon and only carbon gives the 'Powers that Be' the hook to control industry and the people. Period.
So it must be carbon.
Zach - you make several comments that " the scientists and scientific community Understands " (paraphrased)
A) warren points out that the adjustments all biased to showing greater warming instead of being adjusted to reflect the more scientific logical adjustment
B) the scientific treatment of the amo / pdo is another excellent example of the lack of integrity in the climate science community
1) The AMO/PDO cycles have been known since the mid 1990's yet they were not incorporated in the climate models
2) the AMO/PDO cycles have been known since the mid 1990's yet the climate scientists seem to want to attribute all the warming of the 80's90's to co2 caused warming
3) Manns' study from late 2014/early 2015 attributing the pause to the cooling cycle of the amo/pdo, yet attributing none of the warming to the warming side of pdo/amo cycle
C) the world was on a long term cooling trend until it stopped circa 1750, had another very short cooling period, then began the long term warming trend circa 1850. This was during a period when CO2 went from 280ppm to approx 281 or 282 ppm.
The more important question is why the cooling trend stopped - Answer that question and you greater knowledge of why the earth is warming. Yet the scientific community ignores this question.
So MB, if you truly believe in GW, what changes in your life have you made? Every GW supporter is always a joke. If it is that bad, please off your self and save some resources for the rest of us who know GW is for morons. There are way more important environmental issues to tackle like cleaner water.
Coyote and others and have done some great work exposing the crap data collected to justify the idiocy of GW. You might look up the water pan data sometime; no evidence of warming there either. Models are tools, not guides. Even the IPCC report acknowledged limitations of their work. And look at the all the spring storms this year; some years are different than others of course.
Nova had a nice special a few years ago about global dimming and another one about the satellite data collected. No way modelers can account for everything and then tell me the end is near. The peer review process is an f__ing joke and has been for years. It is a place for those in an echo chamber to promote the 'correct idea' so they can get funding. Nothing more.
And thank you Zachriel for helping to make my point for me. Kind of you to do so.
Yes, we all understand that scientists have been aware of and using the "heat island effect" in their calculations but we also recognize that this is almost always scientists on the skeptic side of the aisle. When we see any mention of the temperatures in AGW enthusiasts reports they almost never mention this debasement of the records they use.
And yes the skeptic side of things is aware of the satellite record but if you read the breathless reports issued by the IPCC, EPA, Micheal Mann et al there is, so far as one might know, only surface records available.
In regards "climate scientists" believing that the predicted high latitude night time warming will be where most of the warming occurs, one sure wouldn't know this from the written record! I do not recall ever seeing an article or study from an AGW enthusiast that made this point and then linked it to possible mid latitudes issues. On the contrary these awful predictions always just make the point that the populated areas will be the center of the problems.
All you, Zachriel, are doing is claiming an evenhandedness on the AGW fanatic side that just doesn't exist.
You find an issue with these critiques simply because you do not understand the problems (there are multiple problems).
Take a moment, clear your mind, and imagine 4 station sites, each more distant from an urban center. Now in our thought experiment we will only ever have TWO stations. One site, will be a well cited station so far from the center that it never suffers from UHI. The other station keeps moving between the other three locations. It begins near the city and keeps moving farther out each time as urbanization gets worse.
For the sake of simplicity, this world has no weather or seasons. Every day is basically a carbon copy of the other. There is however...UHI. Over the years the site nearest the city becomes warmer and warmer. Eventually it is moved to another location farther out...has a drop in temperature to roughly the level of the good one. A decade later that new station is also overcome by UHI and there is another move.
Now already know that this world does not actually suffer from global warming, just UHI. HOWEVER, if one were to try to stitch the records into a continuous record (which is what they actually do), they would notice that the moving station temperature ramps up over the years, drops as it is moved, ramps up again, and drops again.
BUT...the homogenization routines that are actually used...don't understand anything about the world. They just blindly bungle through, aligning all the breakpoints, turning the moving station from what looks like a saw-tooth pattern (ramp up, drop, ramp up, drop) into a continuous slope...when we know for a fact that the temperature of the world in this thought experiment is completely stable. And not only do they adjust the UHI contaminated stations...frequently they actually adjust the well sited stations to fit the others. This REALLY happens. This is what skeptics are talking about (although to be fair, many don't understand why it's a problem).
It is actually impossible to remove the UHI signal because we don't know the underlying temperature trend within the mass of undulating stations. And the process of stitching the records together like this creates a false sense of accuracy. Each break-point should actually decrease certainty.
What they should probably be doing is calculating the temperature for each day independently. But that would likely result in a wider spread of temperatures...which is inconvenient, even though it's closer to reality.
stevewfromford: Yes, we all understand that scientists have been aware of and using the "heat island effect" in their calculations but we also recognize that this is almost always scientists on the skeptic side of the aisle.
That is incorrect. Accounting for the heat island effect has been a part of data analysis for decades, as even a cursory look at the scientific literature would reveal.
stevewfromford: And yes the skeptic side of things is aware of the satellite record but if you read the breathless reports issued by the IPCC, EPA, Micheal Mann et al there is, so far as one might know, only surface records available.
Let's start with the IPCC. Note the warming troposphere, while the stratosphere cools, a signature of greenhouse warming.
https://www.ipcc.ch/publications_and_data/ar4/wg1/en/figure-ts-7.html
stevewfromford: I do not recall ever seeing an article or study from an AGW enthusiast that made this point and then linked it to possible mid latitudes issues.
"As far back as 1896, the Swedish scientist Svante Arrhenius hypothesized that changes in the concentration of carbon dioxide in Earth’s atmosphere could alter surface temperatures. He also suggested that changes would be especially large at high latitudes."
http://earthobservatory.nasa.gov/IOTD/view.php?id=81214
They even have a name for the phenomenon: "Arctic Amplification".
Joe: A) warren points out that the adjustments all biased to showing greater warming instead of being adjusted to reflect the more scientific logical adjustment
That is incorrect. Adjustments can occur in either direction. Adjustments are subject to peer review, as with any scientific research, and independent statistical analyses of the raw data still find the same trend.
Joe: 1) The AMO/PDO cycles have been known since the mid 1990's yet they were not incorporated in the climate models 2) the AMO/PDO cycles have been known since the mid 1990's yet the climate scientists seem to want to attribute all the warming of the 80's90's to co2 caused warming
AMO/PDO do not affect the overall heat budget of the Earth. They merely cycle heat in and out of the oceans. The oscillations can't be predicted with any accuracy, so models are run with many different variations. If we look back over past history, and account for AMO/PDO, then climate models are very close to predictions with AMO/PDO being long-term noise.
Joe: 3) Manns' study from late 2014/early 2015 attributing the pause to the cooling cycle of the amo/pdo, yet attributing none of the warming to the warming side of pdo/amo cycle
That is not correct. Steinmann et al. finds that AMO/PDO is noise in the rate of warming. Currently, that means a slowdown. Later, that will mean a speed up. Notably, 2015 had record temperatures, beating the previous record from way back in 2014.
Joe: C) the world was on a long term cooling trend until it stopped circa 1750, had another very short cooling period, then began the long term warming trend circa 1850.
Yes, the climate has been through many changes over Earth's history. What will those climate scientists figure out next!?
I understand the problems; but I also understand the solutions and some of the work that has been done to solve the problems, and the work that has been done to prove those solutions, and the work that has been done to look at alternative solutions and why they've been discarded.
If you honestly believe the existing methods are wrong, then show a better method in a scientific manner. Thought experiments, maybes and probablys are fine as they go - but they don't count as nor advance science. You're expecting climate researchers (who, BTW, have been having similar thought experiments and then following them up with actual experiments for decades) to prove your idea for you - that's unlikely to happen.
> So MB, if you truly believe in GW, what changes in your life have you made? Every GW supporter is always a joke. If it is that bad, please off your self and save some resources for the rest of us who know GW is for morons.
I power my house exclusively with renewable energy formed from the hot air of climate deniers such as yourself.
Alas, my car is still powered by conventional gasoline - but I am currently researching a way to extract the red hot anger at the center of climate deniers' brains (tricky, because I must avoid the small and rudimentary reasoning layers*) to run a stupider fiction reactor, whose only waste product will be their tortured souls.
> There are way more important environmental issues to tackle like cleaner water.
Are you sure that's not a figment of the scientific community as well? There's nothing I wouldn't put past those elites - what with their brains and scientific method and all. Best to just trust your favorite bloggers, instead.
* Though no physical evidence has been found, this rudimentary and vestigial reasoning layer is theorized to exist based on their superficial similarity to a human being. Since my designs require 99.8% pure anger and stupidity, even the smallest contamination of reason is likely to result in an incomplete fiction reaction which will result in the leakage of excess stupidity. With a half-life of around 50 years, this excess stupidity could make entire areas of the planet unlivable for a generation or two.
MB, you are clearly too stupid to have an informed opinion. I'm glad I never joined the military; no point in defending dopes like you.
poitsplace: It is actually impossible to remove the UHI signal because we don't know the underlying temperature trend within the mass of undulating stations.
The simplest way is to simply ignore urban stations.
Wickham et al., Influence of Urban Heating on the Global Temperature Land Average using Rural Sites Identified from MODIS Classifications, Geoinformatics & Geostatistics 2013: "Our results are in line with previous results on global averages despite differences in methodology."
You clearly do not understand the "solutions" because it's impossible to extract separate the UHI data from a real-world warming trend. You have no idea what either one is. You COULD maybe use the remote stations to figure out how much UHI there is, but it's difficult to work out how much of the trends are regional...and then you've got the rather curious problem of them using the UHI contaminated stations to adjust the well sited stations as well.
What I did suggest... is that they stop trying to stitch the records into a continuous ones. Suddenly ALL of the problems created by the homogenization routines go away. What we're left with at that point is some amount of UHI and more uncertainty...but it's the REAL uncertainty, not the delusion of lower uncertainty. And it would also eliminate the ridiculous practice of simulating stations that are not longer used for the calculations but which still exist and report (and report different results than their simulated counterparts.
See, you only called it a "solution" because it gets you closer to they type of answer (artificially reduced uncertainty) that you want...but what I'm talking about is trying to get answers closer to REALITY...which once again, will unfortunately come at the cost of embracing the very real uncertainty.
"But I find that charges of fraud just cheapen the debate."
"Rather than endlessly working to try to get these public agencies to release their adjustment details and methodology for third party validation to the public that pays them (an ongoing task that still has not been entirely successful)"
If the bottom sentence weren't true, I'd agree with the top sentence. But "scientists" who refuse to release the data and methods behind their published work are frauds until rigorously proven otherwise. As such proof is notably absent, the charge of "fraud" seem quite appropriate.
Coyote. You said, among many faulty statements:
"We can see something similar for the whole US, as raw temperature measurements (this time before time of observation adjustments) actually shows a declining temperature trend in the US. In this case, the
entirety of the global warming signal, and more, comes from the manual adjustments. Do these adjustments (literally thousands and thousands of them) make sense when taken in whole? DOES IT MAKE SENSE THAT THERE WAS SOME SORT OF WARMING BIAS IN THE 1920'S THAT DOESN'T EXIST TODAY? This is certainly an odd conclusion given that it implies a bias exactly opposite of the urban heat island effect."
No its not an odd conclusion because that is EXACTLY WHAT OCCURRED, as has been well documented in the literature!
Time-Of-Observation bias (TObs) is a problem in the US record particularly. When a weather station that uses maximum & minimum thermometers is read in the late afternoon/evening, the record will have a warm bias. And if they are read in the morning it has a cool bias. And during the 20th century the US COOP volunteer observation network made a transition from afternoon readings to morning readings.
So the record has a warm to cool transition over the 20th century. If this wasn't corrected the record would show less warming than actually happened. And it is serendipity that this bias change is the opposite to the UHI Effect. If the COOP network had transitioned from morning to evening readings instead the bias change would have been in the other direction.
Perhaps do a bit more research Coyote before posting!
Then this.
"In this case, the entirety of the global warming signal, and more, comes from the manual adjustments"
Sorry for the French but WTF!!!. The US makes up 1.5% of the Earth's surface. Yet manual adjustments to the US record (how do you know they are manual) makes up all the GLOBAL warming signal!!!
Earth to America! 98.5% of the earth's surface ISN'T America!!! Most of everything ISN'T AMERICA!!!
You want to know where most of the SURFACE warming trend comes from? Sea Surface Temperatures.
And yes you are right. Ocean Heat Content changes is the strongest signal of Global Warming. see here,
http://www.nodc.noaa.gov/OC5/3M_HEAT_CONTENT/ Select pane 2.