Denying the Climate Catastrophe: 6. Climate Models vs. Actual Temperatures
This is Chapter 6 of an ongoing series. Other parts of the series are here:
- Introduction
- Greenhouse Gas Theory
- Feedbacks
- A) Actual Temperature Data; B) Problems with the Surface Temperature Record
- Attribution of Past Warming: A) Arguments for it being Man-Made; B) Natural Attribution
- Climate Models vs. Actual Temperatures (this article)
- Are We Already Seeing Climate Change
- The Lukewarmer Middle Ground
- A Low-Cost Insurance Policy
In some sense, this is perhaps the most important chapter, the climax of all the discussion to this point. It is where we return to climate forecasts and attempt to conclude whether forecasts of catastrophic levels of man-made warming are reasonable. So let's take a step back and see where we are.
Here is the framework we have been working with -- we have walked through in earlier chapters both the "theory" and "observation" sections, ending most recently in chapter 5 with a discussion of how much past warming can be attributed to man.
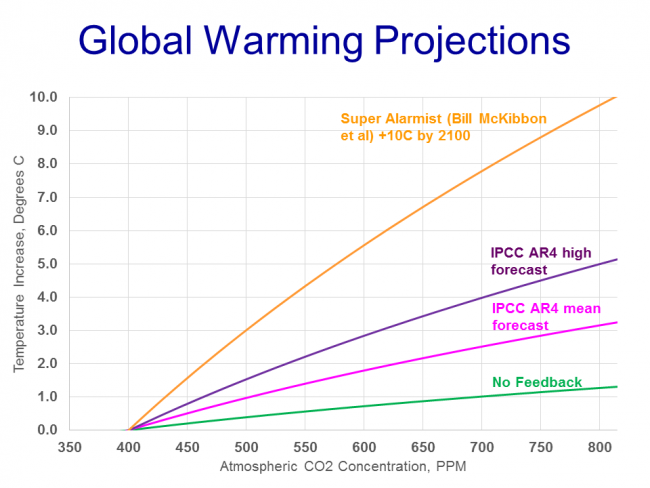
It is important to remember why we embarked on the observation section. We ended the theory section with a range of future temperature forecasts, from the modest to the catastrophic, based on differing sensitivities of temperature to CO2 which were in turn largely based on varying assumptions about positive feedback effects in the climate.
We concluded at the time that there was not much more we could go with pure theory in differentiating between these forecasts, that we had to consult actual observations to validate or invalidate these forecasts.
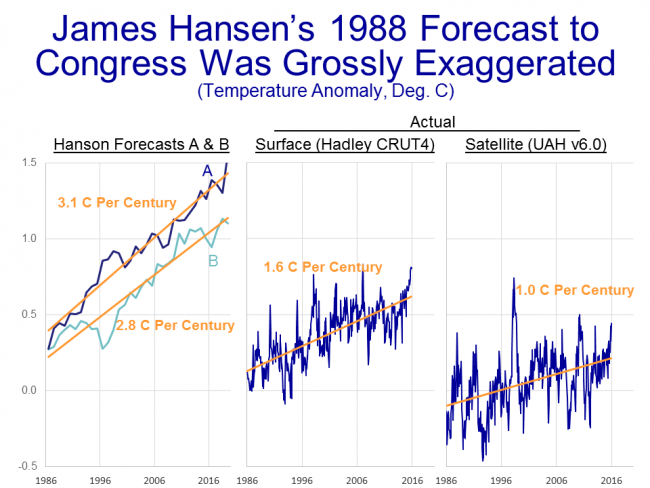
We've already done one such analysis when we made two comparisons back in Chapter 4. We showed that temperatures had risen over the last 30 years by only a third to a half the rate projected by James Hanson to Congress...
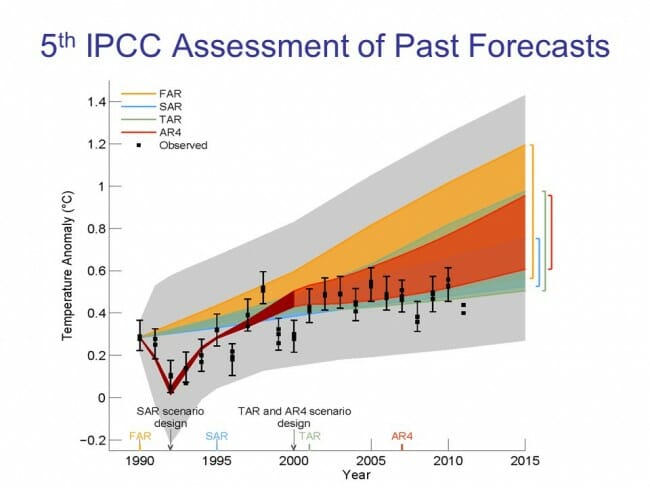
And that even the IPCC admitted in its last report that temperatures were running below or at best at the very low end of past forecast bands
But in the grand scheme of things, even 30 years is a pretty short time frame to discuss climate changes. Remember that in my own attribution attempt in Chapter 5, I posited an important 66 year decadal cycle, and past temperature reconstructions imply other cycles that are centuries and millennia long.
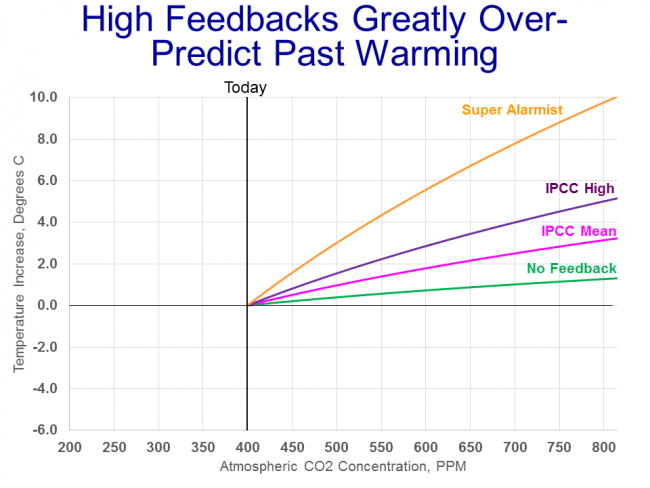
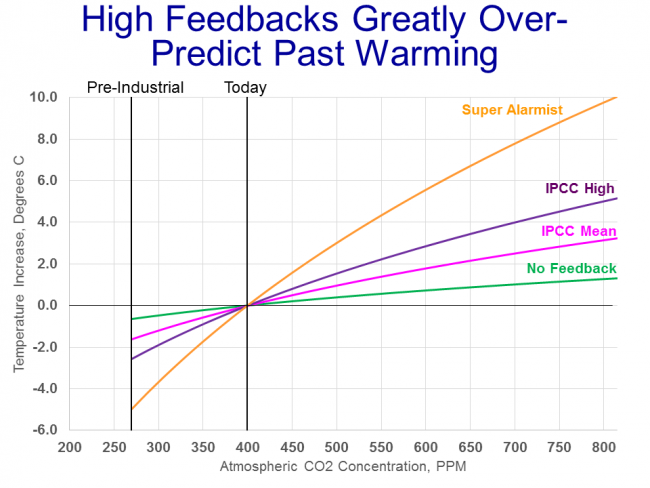
But there is a way we can seek confirmation of climate forecasts using over 100 years of past temperature data. Let's take our forecast chart we showed above and give ourselves a bit more space on the graph by expanding the timescale:
Here is the key insight that is going to help us evaluate the forecasts: each forecast represents an actual, physical relationship between changes in CO2 concentrations and changes in temperature. If such a relationship is to hold in the future, it also has to be valid in the past. So we can take each of these different forecasts for the relation between temperature and CO2 and run them backwards to pre-industrial times in the 19th century, when atmospheric CO2 concentrations were thought to be around 270 ppm.
The temperature value of each line at 270ppm point represents the amount of warming we should already have seen from man-made CO2
What we see is that most of the mainstream IPCC and alarmist forecasts greatly over-predict past warming. For example, this simple analysis shows that for the IPCC mean forecast to be correct, we should have seen 1.6C of manmade warming over the last century and a half. But we know that we have not seen more than about 0.8C total in warming. Even if all of that is attributed to man (which we showed in the last chapter is unlikely), warming has still been well-short of what this forecast would predict. If we define a range for historic man-made warming from 0.33C (the number I came up with in the last chapter) to 0.8C (basically all of past warming due to man), we get numbers that are consistent with the non-catastrophic, zero-feedback cases
Of course we are leaving out the time dimension -- many of the hypothesized feedbacks take time to operate, so the initial transient response of the world's temperatures is not the same as the longer-term equilibrium response. But transient response likely is at least 2/3 of the full equilibrium value, meaning that my hypothesized value for man-made past warming of 0.33C would still be less than the no feedback case on an equilibrium basis.
It is from this analysis that I first convinced myself that man-made warming was unlikely to be catastrophic.
I want to add two notes here.
First, we mentioned back in the attribution section that some scientists argue that man has caused not all of but more than the total observed historical warming. This chapter's analysis explains why. The fact that climate models tend to overpredict history is not a secret among climate modelers (though it is something they seldom discuss publicly). To justify their high feedback and sensitivity assumptions in their forecasts, they need more warming in the past. One way to do this is to argue that the world would have cooled without man-made CO2, so that man-made CO2 contributed 0.8C of warming in addition to whatever the cooling would have been. It allows attribution of more than 100% of past warming to man.
There are various ways this is attempted, but the most popular centers around man-made sulfate aerosols. These aerosols are byproducts of burning sulfur-heavy fossil fuels, particularly coal, and they tend to have a cooling effect on the atmosphere (this is one reason why, in the 1970's, the consensus climate prediction was that man was causing the world to cool, not warm). Some scientists argue that these aerosols have tended to cool the Earth over the past decades, but as we clean up our fuels their effect will go away and we will get catch-up warming.
There are a couple of problems with this line of thought. The first is that we understand even less about the magnitude of aerosol cooling than we do of CO2 warming. Any value we choose is almost a blind guess (though as we shall see in a moment, this can be a boon to modelers on a mission). The second issue is that these aerosols tend to be very short-lived and local. They don't remain in the atmosphere long enough to thoroughly mix and have a global effect. Given their localization and observed concentrations, it is almost impossible to imagine them having more than a tenth or two effect on world temperatures. And I will add that if we need to take into account cooling from sulfate aerosols, we also need to take into account the warming and ice melting effect of black carbon soot from dirty Asian coal combustion. But we will return to that later in our section on Arctic ice.
My second, related note is that scientists will frequently claim that their computer models models do claim correctly match historic temperatures when run backwards. As a long-time modeler of complex systems, my advice is this: don't believe it until you have inspected the model in detail. At least 9 times out of 10, one will find that this sort of tight fit with history is the result of manual tweaking, usually from the affect of a few "plug" variables.
Here is one example -- there was a study a while back that tried to understand how a number of different climate models could all arrive at very different temperature sensitivities to CO2, but all still claim to model the same history accurately. What was found was that there was a second variable -- past cooling from man-made aerosols, discussed above -- that also varied greatly between models. And it turned out that the value chosen in the models for this second variable was exactly the value necessary to make that model's output match history -- that is why I said that our very lack of knowledge of the actual cooling from such aerosols could be a boon to modelers on a mission. In essence, there is a strong suspicion that this variable's value was not based on any observational evidence, but was simply chosen as a plug figure to make the model match history.
Having gone about as far as we can with the forecasts without diving into a whole new order of detail, let's move on to the final alarmist contention, that man-made CO2 is already changing the climate for the worse. We will discuss this in Chapter 7.
Chapter 7 on whether we are already seeing man-made climate change is here.



I have long said that given a billion $s of supercomputer, a handful of mathematicians and another of modeling programmers, I could hind-cast the past 40 odd years of the British state lottery winning numbers to a high degree of accuracy. But it would be useless to predict the result next Saturday!
Using feedbacks implied by forecasts is an unscientific to hindcast from climate models. It ignores the actual hindcases made using the CMIP5 models. It also ignores the fact that models are not good at predicting ENSO and volcanoes, and the uncertainty in thehuman caused aerosal distribution, which tends to be regional. If you look at the following link, figures 1 and 2 you can see quite good agreement between models and data.
http://www.skepticalscience.com/Climate-Models-Show-Remarkable-Agreement-with-Recent-Surface-Warming.html
Write it up, get it peer-reviewed and published, and the Noble Prize cannot be far away. :)
Skepticalscience is somewhere in neighborhood of rubbish and dishonest, just down the road from outright Deceptive. Just thought to warn you about that. Lots of concern expressed there about "deniers" cherry-picking data one way or other, but look closely and you see extensive skill at "How to Lie With Statistics" -- graphical presentations show special forte at that skillset.
And much of your post above re: predicting ENSO and volcanoes, and "regional" aspect of human-caused aerosols, is totally irrelevant for purpose at hand. Your first sentence looks to be garbled English --- and mention of "hindcases" in next sentence is perplexing.
Sorry for the typo and mangled sentence. I have edited it to clarify what I was trying to say. Basically hindcasts have validated the models used for the forecasts. This is the crux of the
I don't share your opinion of Skeptical Science. If you want to discuss the material in the link I posted, and point out where it is wrong, I will be glad to engage in such a discussion. Here is a recent peer reviewed publication which shows agreement between the center of the temperature plot CMIP5 climate models and the observed global average temperature.
http://www.sciencedirect.com/science/article/pii/S1674927813500050
http://ars.els-cdn.com/content/image/1-s2.0-S1674927813500050-gr2.jpg
Take away Scientist's gubment funding and you take away the global warming THEORY.
I'm afraid marcturus is quite correct in labeling SS as a sketchy (to be kind) site to rely on - they have been shown to be dishonest in the past and are certainly not reliable. If you seek intelligent and definitive information by non-rabid zealots I would suggest you refer to sites such as Climateaudit or Judith Curry's.
Climateaudit has a recent post on how hot the models continue to run. https://climateaudit.org/2016/01/05/update-of-model-observation-comparisons/
Re: prediction quality -- as Meyer piece at Coyote points out (and others elsewhere), the IPCC itself in most recent AR-5 acknowledged the actual track record in temp anomaly bordered the lower range of many earlier predictions from AR-1 onward. Even "casual" comparison b/t actual since baseline 1990 --- conveniently a relatively very neutral year wrt ENSO conditions, TSI, aerosol optical depth,...--- and suite of IPCC prognostications (100-year outlook at +1.5 deg C at low end to +3.6 deg C. or even greater at high end) reveals escalation over 25 years since baseline projecting to only +1.6 - 1.67 deg range (extrapolated from +0.40 - 0.42 deg C observed over 1990-2015 time frame after appropriate control for ENSO, etc.). Of course, "casual" can be treacherous, but even more disciplined analytics support same conclusion.
As for "peer review" of material you reference -- that hardly noteworthy considering the likely peerage of those doing the reviewing (aka folks of some same tribe admiring each others' handiwork to provide satisfactory result). Then there is the hint of "observer effect" in the process, for example the ongoing habit for revisions to extensive temperature database to yield higher temps in later years relative to past eras including 20th C reference scale (HadCrut4, NCDC ---> NCEI, GISS). But even accepting said adjustments at face value, the preponderance of model predictions are still showing as overheated.
I guess it depends on the choice of sources of information.
This web page from NOAA shows the quality of models based on IPCC AR5 analysis. They explain the inadequacies of the models, and show that they can reproduce observed global average temperature pretty well.
http://oceanservice.noaa.gov/education/pd/climate/factsheets/howreliable.pdf
Are you claiming that climate blogs are superior to peer reviewed papers?
I'll accept your "appeal to authority" reference for what it's worth.
I viewed your reply previously on my phone thus could not see graphic you had kindly inserted from "peer-reviewed" study you cited, until now on desktop. I am happy to examine the research piece further for sake of fuller discussion (and more informed education). First of all, the study is dated 2013 and relies on HadCrut3 anomaly series but only through 2005, hence not as fresh as you imply. That said, HadCrut3 probably offers a slightly "conservative" element to the authors handiwork (either that, or one relatively freer of the "observer effect" I mention elsewhere). But do note that the graphic image and authors' discussion actually supports the presentation I make below regarding ensemble of warming predictions ("MME") and broad range of warming forecasts exceeding observed change in global anomaly. This even by actual statement of authors in the "peer-reviewed" article you cite, plus by visual inspection of the graph itself (that admittedly a little haphazard exercise even with enlarging the image). Authors state the following about their own "BCC" models relative to "MME" (amplitude = 0.48°C) --- that "(T)he warming amplitude during the early 21st century (2000–2005) relative to 1971–2000 mean is 0.45°C for the BCC_CSM1.1 and 0.62°C for the BCC_CSM1.1-M, which are HIGHER THAN THE OBSERVED VALUES (0.33°C)." (emphasis added). They go on to conclude that "...the two models overestimate the global warming... " This can also be discerned in general although admittedly crude way in graphic post-1990: note 1990 value for OBS (HadCrut3, in black) at about 0.1 level just before temp dip due to Pinatubo eruption in early 1990s, rising only to about 0.3-0.4 range by 2005). Of course, having the actual data series at hand plus later years through 2015 would prove useful, but the change in relative position for "observed" versus projections in graph I think speaks for itself (i.e., going from "middle of the pack" to low end of spread). So, I thank you for supplying "peer-reviewed" source that points in favor of position of mine I describe earlier (just below in this thread) as well Meyer's coyote blog piece.
Last point I have for now a bit of a technical item --- authors report correlation coefficients along the way: I would not read all much into that information as far as prediction quality on "future" levels is concerned, plus the entire time series effort likely is afflicted with a serious autocorrelation problem that typically renders simple correlations inflated (potentially seriously so). Full disclosure -- that also a nagging problem for some of the "temp anomaly modelling" I have delved into, especially those covering longer time periods (100 + years' data going back to 19th Century). Not being privy to the authors' actual efforts to attend to that particular statistical ailment (I don't recall any mention of that in the published article), can't say for sure what to make of that part of the study, hence just a note of caution here on the subject.
My subsequent post, contained a link to the Climate Lab Book, web site. It showed the results of a 2015 paper by Kevin Cowtan et. al., who made corrections to the data to account for differences in temperature between sea surface and the air temperature above the surface
" This new analysis gets closer to a like-with-like comparison by sampling the models with the same spatial coverage as the observations, and by using the simulated SSTs over the ocean, blended with the SATs over the land."
In addition Cowtan's paper also corrected the CMIP 5 model forcings to include recent volcanic eruptions they hadn't anticipated.
http://eprints.whiterose.ac.uk/95782/7/grl53276.pdf
The results from Cowtan's paper get the simulations closer to the data than before but there is still a slight overprediction during the last few years. Cowtan also says his paper cofirms the validity of Karl's corrections of sea surface temperatures.
http://sciences.blogs.liberation.fr/files/noaa-science-pas-de-hiatus.pdf
Oh yes -- I get that. "Corrections" to the data set and unanticipated volcanic eruptions (and what else?). Like I said before, perhaps basis for intuiting some element of the so-called "observer effect" in all that. From professional field I have worked in for many years as practitioner of applied statistical modelling in a litigation setting, there is certain phrase that comes to mind --- "beating the truth out of the data" to get result that yields comfort. Just sayin' that for starters -- will try with more open mind to dive in more deeply to the work product you cite, but admittedly can't help but carry into that effort some prior expectation that a researcher is retro-actively "thumbing the scale" yet again (much like Prof. M. Mann's shabby venture couple years ago into decadal oscillations, etc, as explanation for post-90s slackening in pace of warming).
And I am also intrigued by the volcanic eruption connection -- as the record shows really nothing recent (post early 1990's) along those lines to have measurable impact -- certainly nothing of the magnitude of a Pinatubo, El Chichon, even Agung. Since 1991 fewer than one VEI = 4 per year and no equatorial VEI = 5 or higher (in fact only one VEI =5 and nothing greater). Now VEI is not the entire story --- ejecta chemistry matters, as does location, plume evolution and maybe even hemispheric season --- but then again the current track record on AOD available through 2012 shows no upward bumps of any significance, not even that approaching level from Fuego (1974) or the 1968 eruption cluster (Fernandina, Mayon and Arenal). It so happens I am working on a statistical "event" model form of analysis to examine the volcanic eruption record impact on various optical depth and similar metrics bearing on global temperature anomaly (e.g., global "dimming" effect). Still at stage of assembling the database details and what it could offer for enabling a valid approach (if any) for testing various hypotheses about volcanic aerosol events, etc.
Enjoy your research. I hope that you add something to the science behind the effect of volcanoes on climate.
Well, thank you for the good wishes (although I do sense a bit of "faint praise" in your post). I will admit though to a bit of "regret" on my part for the somewhat "caustic" tone in this thread --- but then again with credibility of IPCC and global warming crowd a genuine issue, some amount of stridency in the criticism I believe is totally warranted and justified.
I followed up on the Cowtan et al (tellingly, 9 named authors in all) and found it a little "opaque" for now at least to follow properly the data corrections (SST's, SAT's, etc), primarily without having the actual data series detail on hand to examine and assess. Perhaps more on that if/when I can track those down and have time plus energy to review. But I did pursue the "volcanic eruptions" model forcings part (that not surprisingly fitting in well with my current interests), and discovered Cowtan et al indeed rely on yet other research (and not their own) -- specifically, a 2011 piece by Susan Solomon et al (this time only six named authors). Solomon et al claim to demonstrate "unaccounted-for" aerosol depth from "modest" volcanic eruptions during 2000-2010 period, not picked up previously by GISS-based AOD measurements, but now showing in various satellite-based sources. What they conclude is that where various temperature prediction models had assumed "near-zero" AOD post 1990s thus little or no "dimming" from volcanic aerosols to account for the observed "warming hiatus," the data now available for that period indicate AOD as "more variable" and at higher levels (as much as double the amount) than as measured by GISS AOD data set and "often used in global climate models." Significantly, the authors proclaim this difference accounts for about 0.07 deg C of the temperature gap between predicted and observed in 2000-2010 period. However, there are serious flaws here ---
1) the approximate "doubling" in AOD level is going from extremely low level to start with (roughly 0.005 on average) to still rather low 0.010 at very most (as per Figure 2 of the article), which in context of aerosol "dimming" is like going from "near zero" to fractionally above "near zero" (Sidebar -- the authors provide no data series on the satellite AOD that I can find, only the depiction in the graphic in article, which interestingly leaves out data from Pinatubo in 1991 and earlier, which would have revealed the relative insignificance of the "data adjustment" for the 2000-2010 "warming hiatus" period under examination).
2) Given claimed impact of 0.07 deg C on observed temperature anomaly arising from the (at most) 0.005 upward adjustment in measured AOD, the underlying forcing implied by change in AOD is at minimum a rather hefty 0.014 deg C for every 0.001 increment in AOD. By comparison, the forcing factors from AOD dimming estimated in various regression models tracking relative influence from ENSO, TSI and AOD on temp anomaly (e.g., Rahmstorf, Foster and Cazenave -- 2012) indicate a .001 change in AOD yields change in temperature in the 0.002 to 0.004 range, essentially at most 1/7 to 1/4 the magnitude as implied by the Solomon analysis, and probably less so than that (my own statistical analyses points to AOD forcing factor of about 0.001 covering time periods going back to 1850 and late 1870s depending on temperature anomaly series employed).
3) Taking at face value the "Solomon" temperature impact of at least 0.014 (per 0.001 change in AOD), this yields some interesting projections on global temperature anomaly from known past eruptions (here I rely on track record of peak annual AOD from GISS and/or Crowley "ice core" record, which goes back to as far as Tambora in 1815) ----
Pinatubo (1991 -- GISS AOD = 0.121; Crowley AOD = 0.131): Temp change impact in 1.7- 1.8 deg C range
El Chichon (1982 -- GISS AOD = 0.075; Crowley AOD = 0.079): 1.0 deg C
Agung (1963 -- GISS AOD = 0.072; Crowley AOD = 0.055): 0.8 to 1.0 deg C
Santa Maria (1902 -- GISS AOD = 0.072; Crowley AOD = 0.069: 1.0 deg C
Krakatau (1883 -- GISS AOD = 0.143; Crowley AOD = 0.157): 2.0 to 2.2 deg C
Cosiguina (1835 -- GISS AOD = NA; Crowley AOD = 0.127): 1.8 deg C
Tambora (1815 -- GISS AOD = NA; Crowley AOD = 0.364): 5.1 deg C
Should not be too difficult in all this to discern that the volcanic aerosol forcing factor "embedded" in the Solomon et al research yields absurdly high (and quite highly erroneous) projections of temperature impacts from known large eruptions over the past 200 years. Thus the 0.07 deg C impact measured for 2000-2010 period allegedly from "improved" AOD measurement is highly suspect. Using the estimated forcing metrics from Rahmstorf modeling research (and others) would put the temperature impact from a 0.005 addition in AOD at no more than a trifling 0.01 to 0.02 deg C range at the very most. That in fact more like a rounding error, if anything else, in any exercise to explain away the "warming hiatus" in this regard.
So, I rate Solomon et al.... (and that particular part of the Cowtan et al exercise) as essentially making the proverbial (volcanic) mountain out of a molehill --- actually, something more like a pimple on the tail end of the elephant.
I don't understand how you did your calculations. The temperature change one calculates will depend on the duration of the radiative forcing. The gradual change Solomon is talking about accumulates over 11 years. The short term changes in AOD due to catastrophic eruptions such as Tamburo, Pinatubo etc. have peaks that go back to normal in about 2 or 3 years. What period of time did you assume for the peak AOD due to the catastrophic eruptions that you quoted? How did you get the data for their AOD changes versus time? Before I accept the conclusions that you draw about the plausibility of Solomon's paper being correct, I need to know more details about how you estimated the temperature changes implied by Solomon et. al. for the AOD peaks of the eruptions you cited.