Posts tagged ‘temperature’

Some Geek Love

One of the geekier conversations I used to get drawn into (up there along with arguing about favorite Serenity episodes, lamenting the demise of Omni magazine, and coming to blows over D&D rules interpretations) was over the relative merits of various sorting algorithms.  Flowing Data has some links to some interesting visualization approaches to sorting algorithms.  This one is for quicksort (colors start out random on the left and must be sorted into Roy G Biv order).

In college I did a project on solving traveling-salesman-type problems with an algorithm called simulated annealing.  Many approaches to the traveling salesman problem pick a random path and then randomly switch pairs of routings on the path, and then stick with the alternative that gives the best score (in this case the shortest path).   Rinse, repeat a zillion times.  The problem is this approach can get stuck in, or converge on, a local optima that are not as good as the single grand optimum for the problem.

In simulated annealing, the algorithm is allowed to sometimes jump to a worse (ie longer) path, which lets it jump out of local minima.  The amount of the backwards jump that is allowed is slowly reduced over time as the algorithm runs.  It is called simulated annealing because this is very similar to the annealing process in metals, where temperature is decreased slowly to, initially, allow the metal molecules to jump to higher energy states so that the whole can settle into a more homogeneous structure.

Anyway, we tried to show how the algorithm proceeded to a solution over time and the visualizations looked a little like this.

More Green Silliness

I couldn't care less what happens to my body after I die and I am done using it.  So the following, which I suppose is intended to freak me out, simply leaves me amazed yet again at green thinking

Undertakers in Belgium plan to eschew traditional burials and cremations and start dissolving corpses instead.

The move is intended to tackle a lack of burial space and environmental concerns as 573lbs of carbon dioxide are released by each cremated corpse.

Under the process, known as resomation, bodies are treated in a steel chamber with potassium hydroxide at high pressure and a temperature of 180c (350f).

The raised pressure and temperature means the body reaches a similar end point as in standard cremation "” just bones left to be crushed up "” in two to three hours.

My first thought on reading this was "Soylent Green is People!"

My second is to wonder how a torched body creates 573 pounds of CO2.  12 pounds of carbon combusts to 44 pounds (approx) of Co2.  This means that to combust to 573 pounds of Co2, the human body must have 156 pounds of carbon.  WTF?   But carbon in 18% of human body weight, which means that to produce 573 pounds of CO2, the human body would have to weigh 867 pounds.   One might be able to get this number by including the cremation fuel in the equation (though this is a generous interpretation since this is not how the article is written), but since it is usually gas used for cremation it would take a hell of a lot of gas given its low carbon content.

My third thought is what does any of this have to do with CO2 reduction

  • The process occurs at 350F.  You mean no fossil fuels are used to get the chamber up to 350F.  What, are they using solar mirrors?
  • The process occurs at high pressure.  This takes energy
  • The end product is a carb0n rich soup that they pour down the drain or pour on their garden.  I have a clue for you, all oxidation is not combustion.  That carbon dumped in your garden or in your compost heap will still become CO2 even without seeing aflame.

Something for Atlas Shrugged Readers

Do you remember the State Science Institute report on Rearden Metal?  If you were like me, you thought that this ridiculous report was an exaggeration, a literary device to make a point.  But as in so much of Atlas Shrugged, I am finding that it was no exaggeration at all.

Check out this real life example of "science."  From the real state science folks at the Interagency Working Group on Climate Change and Health.

There are potential impacts on cancer both directly from climate change and indirectly from climate change mitigation strategies. Climate change will result in higher ambient temperatures that may
increase the transfer of volatile and semi-volatile compounds from water and wastewater into the atmosphere, and alter the distribution of contaminants to places more distant from the sources, changing subsequent human exposures. Climate change is also expected to increase heavy precipitation and flooding events, which may increase the chance of toxic contamination leaks from storage facilities or runoff into water from land containing toxic pollutants. Very little is
known about how such transfers will affect people's exposure to these chemicals"”some of which are known carcinogens"”and its ultimate impact on incidence of cancer.  More research is needed to determine the likelihood of this type of contamination, the geographical areas and populations most likely to be impacted, and the health outcomes that could result.

Although the exact mechanisms of cancer in humans and animals are not completely understood for all cancers, factors in cancerdevelopment include pathogens, environmental contaminants, age, and genetics. Given the challenges of understanding the causes of cancer, the links between climate change and cancer are a mixture of fact and supposition, and research is needed to fill in the gaps in what we know.

One possible direct impact of climate change on cancer may be through increases in exposure to toxic chemicals that are known or suspected to cause cancer following heavy rainfall and by
increased volatilization of chemicals under conditions of increased temperature. In the case of heavy rainfall or flooding, there may be an increase in leaching of toxic chemicals and heavy metals
from storage sites and increased contamination of water with runoff containing persistent chemicals that are already in the environment. Marine animals, including mammals, also may suffer
direct effects of cancer linked to sustained or chronic exposure to chemical contaminants in the marine environment, and thereby serve as indicators of similar risks to humans.64 Climate impact
studies on such model cancer populations may provide added dimensions to our understanding of the human impacts.

Remember, the point of this all is not science, but funding.  This is basically a glossy budget presentation, probably cranked out by some grad students over some beers, tasked to come up with scary but marginally plausible links between health issues and climate change.   Obama has said that climate is really, really important to him.  He has frozen a lot of agency budgets, and told them new money is only for programs that supports his major initiatives, like climate change.  So, every agency says that their every problem is due to climate change, just as every agency under Bush said that they were critical to fighting terrorism.  This document is the NIH salvo to get climate change money, not actual science.

The Anti-Industrial Revolution

I stole this post title from Ayn Rand, but it seems appropriate to this story by James Delingpole.  Apparently James Hansen, leader of NASA's GISS, which does most of its climate research, wants to turn back the clock on industrialized civilization.    A new book by Keith Farnish writes:

The only way to prevent global ecological collapse and thus ensure the survival of humanity is to rid the world of Industrial Civilization.

And continues:

I'm rarely afraid of stating the truth, but some truths are far harder to give than others; one of them is that people will die in huge numbers when civilization collapses. Step outside of civilization and you stand a pretty good chance of surviving the inevitable; stay inside and when the crash happens there may be nothing at all you can do to save yourself. The speed and intensity of the crash will depend an awful lot on the number of people who are caught up in it: greater numbers of people have more structural needs "“ such as food production, power generation and healthcare "“ which need to be provided by the collapsing civilization; greater numbers of people create more social tension and more opportunity for extremism and violence; greater numbers of people create more sewage, more waste, more bodies "“ all of which cause further illness and death.

I wonder what Mr. Farnish thinks the average life expectancy was before the industrial revolution, or even "civilization?"  But my intention here is not to shoot fish in Mr. Farnish's barrel.  What is interesting is who approached Farnish and offered, unsolicited, to blurb his book:  James Hansen.  Here is Hansen's endorsement:

Keith Farnish has it right: time has practically run out, and the 'system' is the problem. Governments are under the thumb of fossil fuel special interests "“ they will not look after our and the planet's well-being until we force them to do so, and that is going to require enormous effort.

Does anyone believe that a person who believes this wouldn't misrepresent the science or fudge his temperature metrics to support his cause.  If he expects civilization to crash, why do we expect him to operate by the rules of civilized society?

Could This Be The Tipping Point for Arpaio and Thomas?

It is not uncommon for certain shady dealing to go on for years, with a small group of critics but never really breaking out into the media.  We skeptics have been criticizing climate scientists for years for various problems with their temperature indexes and historical temperature reconstructions, but never really got traction until the CRU emails were made public, and then there has been a real firestorm of media attention.  Criticisms that never got much traction before are now being actively investigated.

I am hoping that we have a similar situation with Sheriff Joe Arpaio and County Attorney Andrew Thomas.  The story is so wacky it simply defies easy description, but Arpaio and Thomas have been pursuing a number of corruption probes against their bosses in the County government.  All well and good, except for the funny fact that the targets of the probes all seem to be historic critics of Arpaio and Thomas, who have brought out their biggest guns for the one Democrat on the County Council (Arpaio and Thomas are both Republicans).

Both these men have  a history of indifference to civil liberties.   When Arpaio is not busy arresting folks for breathing while Mexican (he once managed to make a crime sweep through the 99% Anglo neighborhood of Fountain Hills and arrest 75% Mexicans), he likes to haul folks off to jail whose only crime is speaking out against the Sheriff .   He arrested (with Thomas's help) newspaper reporters and editors who wrote critically of him.  This is a man who in his paranoia invented an assassination plot (against himself, of course) and got the city to spend $500,000 protecting him.  If his deputies want to see a defense attorney's working papers, they just take them.  If he can't get a judge to release computer records, he has his posse storm into the County computer center and take it over at gunpoint.

Most recently, Thomas and Arpaio wanted a judge who has handed them a number of court losses removed from a certain case.  To make that happen, Arpaio and Thomas bizarrely charged the judge and numerous other county employees in a giant RICO case, a case attorneys are still laughing about because it was so transparent and shoddy.  When that didn't work, he charged the judge with felony bribery, apparently on the interesting theory that getting a new, updated court house building was effectively a bribe to the judges working there.

It gets much weirder even than this, with Arpaio's stealing documents from a defense counsel in court (caught on video) with this same judge holding Arpaio's deputy in contempt for the action and then the sheriff's deputies essentially going on strike at court, refusing to bring in prisoners.

But after years of fawning, positive publicity as "Americas Toughest Sheriff," the dam may finally be breaking.  When the AZ Republic finally covers it, you know the situation has to be bad:

Hundreds of attorneys gathered on the courthouse steps in downtown Phoenix to protest Thomas and Arpaio's public campaign against public corruption.

LOL, I have a picture of these guys with suits and holding placards.  Anyway, this was a real blow:

And, in a scathing letter to The Arizona Republic, the Yavapai County attorney

, who previously handled some of Thomas' cases against county officials, blasted the prosecutor and sheriff as "a threat to the entire criminal-justice system."

Oops, so much for the respect of your peers.  Shelia Polk, the Yavapai County attorney (that is a neighboring county) handled the investigations into some of Arpaio and Thomas's early charges against our County officials, so she knows the details of the story.  And she is a Republican, the same party as Arpaio and Thomas:

In her letter, Polk wrote that although Maricopa County isn't her jurisdiction, she can't sit by and watch the abuses from a distance anymore.

"I am conservative and passionately believe in limited government, not the totalitarianism that is spreading before my eyes," she wrote. "The actions of Arpaio and Thomas are a disservice to the hundreds of dedicated men and women who work in their offices and a threat to the entire criminal-justice system."

Polk had stayed out of the legal drama in Maricopa County, and her remarks offer the first insight from an outside law-enforcement official who has some knowledge of the cases Arpaio and Thomas have lodged against county officials.

Arpaio's response was predictable:

Hendershott spoke on behalf of Arpaio. Hendershott said that Polk's office repeatedly failed to issue subpoenas the Sheriff's Office needed.

"It seemed clear to us that this case was being deliberately stalled," he said. "We basically let her know that her work product was ineffective."

This is a constant refrain from the sheriff - anyone who seeks to impose any limit on his power is therefore evil and conspiring to thwart his will.  It comes up time and time again - he simply does not react well when denied a subpoena, or a search warrant, or access to certain information.  If they are not rubber stamping Sheriff Joe's requests, then they must be corrupt.  If he had been honest, his RICO charges would have simply read "they didn't give me what I want."  But there is a reason these third parties are part of the process, and you can see it in Polk's letter:

Polk said she worked with the Sheriff's Office on the cases for the next six months, then returned the cases to the Maricopa County Attorney's Office.

In Polk's letter, she wrote that she was "happy to remove myself from the cases and from contact with Sheriff Arpaio. My discomfort grew daily and my role in restraining potential abuses of power increasingly more difficult."

Why the Historical Warming Numbers Matter

First, let's settle something.  The world has warmed since 1850.  While there always is an error bar on nearly every statement about nature, I think there is little point in questioning this past warming.  There is ice core data that suggests that the little ice age, which ended some time in the very early 19th century, was perhaps the coldest period, or one of the two or three coldest periods, in the last 5000 years (ie in nearly the entire span of human civilization).  Temperatures are inevitably warming from this low point.(*1)

So, if the point is not to deny warming altogether, what is the point in discussions of Climategate of picking over and trying to audit historical temperature records like the Hadley CRUT3 or NASA's GISStemp?  Skeptics often argue that much of the warming is due to bogus manual adjustments in the temperature records and biases such as urban warming.  Alarmists argue that the metrics may understate warming because of masking by manmade anthropogenic cooling agents (e.g. sulfate aerosols).  Why bother?  Why does it matter if past warming is 0.6C or 0.8C or 0.3C?  There are at least two reasons.

1.  The slope of recent temperature increases is used as evidence for the anthropogenic theory.

We know greenhouse gasses like CO2 have a warming effect in the lab.  And we know that overall they warm planets because otherwise ours would be colder.  But how much does an incremental amount of CO2 (a relatively weak greenhouse gas) warm the Earth?  A lot or a little?  Is the sensitivity of the climate to CO2 high or low?

Every time I try to express this, it sounds so ridiculous that people think I must have it wrong.  But the main argument supporting a high climate sensitivity to CO2 is that scientists claim to have looked at past warming, particularly from 1950-2000, and they can't think of any natural cause that could behind it, which leaves CO2 by process of elimination.  Yeah, I know this seems crazy - one wants to ask if this is really a test for CO2 sensitivity or of scientists' understanding and imagination, but there you have it.

Now, they don't always say it this directly.  What they actually say is that they ran their climate models and their climate models could not produce the warming from 1950-2000 with natural forcings alone, but could reproduce this warming with forcings from CO2.  But since the climate models are not handed down from the gods, but programmed by the scientists themselves to represent their own understanding of the climate system, in effect this is just a different way of saying what I said in the previous paragraph.   The climate models perform the function of scientific money laundering, taking an imperfect knowledge on the front end and somehow converting that into settled science at the output.

Now, there are a lot of ways to criticize this approach.  The models tend to leave out multi-decadal ocean cycles and don't really understand cloud formation well.  Further, the period from 1957-2008, which supposedly can only be explained by non-natural forcings, has almost the exact same temperature profile and increase as the time from 1895-1946, which of necessity must be mostly "natural."  I go into this more here, among other places.

But you can see that the amount of warming matters to this argument.  The more the warming falls into a documented natural range of temperature variation, the harder it is to portray it as requiring man-made forcings to explain.  This is also the exact same reason alarmist scientists work so hard to eliminate the Medieval Warm Period and little ice age from the temperature record.  Again, the goal is to show that natural variation is in a very narrow range, and deviations from this narrow range must therefore be man-made. (*2)

This is the sort of unified field theory of everything we are seeing in the CRU emails.   We see scientists using every trick they can find to lower or smooth out temperatures numbers before 1950, and adjust numbers after 1950 upwards.  Every single trick and programming adjustment all tended to have this effect, whether it be in proxy studies or in the instrumental record.  And all the efforts to prevent scrutiny, ignore FOIA's, and throw out raw data have been to avoid third party replication of the statistical methods and adjustments they used to achieve these ends.

As an aside, I think it is incorrect to picture this as a SPECTRE-like cabal scheming to do evil.   These guys really, really believed they had the right answer, and these adjustments were made to tease out what they just knew the right answer to be.  This is why we are only going to see confused looks from any of these guys - they really, really believed they were doing God's work.  They are never going to understand what they did wrong.  Which doesn't make it any less bad science, but just emphasizes that we are never going to get data without spin until total sunlight is brought to this process

2.  It is already really hard to justify the huge sensitivities in alarmist forecasts based on past warming -- if past warming is lower, forecasts look even more absurd.

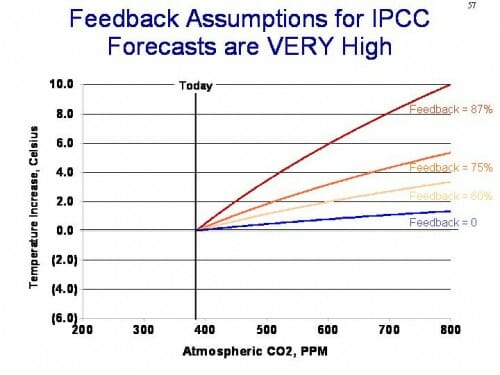
The best way to illustrate this is with a few charts from my most recent climate presentation and video.  We usually see warming forecasts by year.  But the real relationship is between warming and CO2 concentration (this relationship is called climate sensitivity).   One can graph forecasts at various levels:

Slide57

The blue line corresponds to the IPCC no-feedback formula that I think originally goes back to Michael Mann, and yields about 1-1.2C of warming for greenhouse gas warming from CO2 before feedback effects.  The middle two lines correspond to the IPCC mid and high forecasts, and the top line corresponds to more alarmist forecasts from folks like Joe Romm who predict as much as 8-10C of warming by 2100 (when we will be at 650-800ppm CO2 per the IPCC).  By the way, the IPCC does not publish the lines above the blue line, so I have taken the formula they give for the blue line and scaled it to meet their end points.  I think this is reasonable.

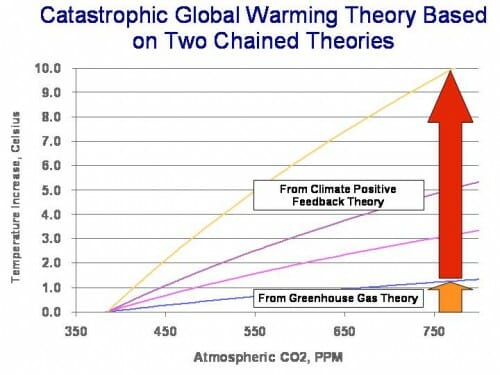
A couple of things - all climate models assume net positive feedback, what skeptics consider the key flaw in catastrophic global warming theory.  In fact, most of the catastrophe comes not from global warming theory, but by this second theory that the Earth's temperature system is dominated by very high positive feedback.  I illustrate this here.  The blue line is from CO2 greenhouse gas warming.  Everything above it is from the multiplier effects of assumed feedbacks.

Slide21

I won't go into the feedback issue much now - search my site for positive feedback or else watch my video for much more.  Suffice it to say that skeptics consider the feedback issue the key failure point in catastrophic forecasts.

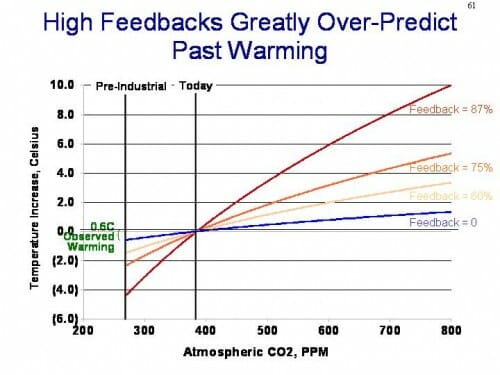
Anyway, beyond arguing about feedbacks, there is another way to test these forecasts.   Relationships that hold for CO2 and warming in the future must hold in the past (same Earth).  So lets just project these lines backwards to the CO2 level in the late 19th century.

Slide61

Can you see the issue?  When projected back to pre-industrial CO2 levels, these future forecasts imply that we should have seen 2,3,4 or more degrees of warming over the last century, and even the flawed surface temperature records we are discussing with a number of upwards biases and questionable adjustments only shows about 0.6C.

Sure, there are some time delay issues, probably 10-15 years, as well as some potential anthropogenic cooling from aerosols, but none of this closes these tremendous gaps.  Even with an exaggerated temperature history, only the no feedback 1C per century case is really validated by history.  And, if one assumes the actual warming is less than 0.6C, and only a part of that is from anthropogenic CO2, then the actual warming forecast justified is one of negative feedback, showing less than 1C per century warming from manmade CO2 -- which is EXACTLY the case that most skeptics make.

Those who control the past control the future. Those who control the present control the past.- George Orwell

Footnotes:

(1) More than once I have contemplated how much the fact that the invention of the thermometer occurred at perhaps the coldest point in human memory (early 17th century)  has contributed to the perceptions of current warm weather being unusual.

(2) For those who are on the ball, perhaps you can spot an amazing disconnect here.  Scientists claim that the natural variation of temperatures is in a very narrow band, that they never move even 0.2C per decade by natural means.  But they also say that the Earth's temperature system is dominated by positive feedback, meaning that very very small changes in forcings are magnified many fold in to large temperature changes.  I won't go in to it in depth from a systems perspective, but trust me that "high stability in a narrow range" and "dominated by high positive feedback" are not very compatible descriptions of a system.

My Personal Experience with Climate Alarmist Spin

We see all kinds of alarmist spin being attempted on the CRU emails.  For those who are interested, this is best layman's article I have found to discuss the now-famous Michael Mann "trick," what it is, and the obfuscation in the CRU's response.

I have at least one experience with the core alarmist community responding where I pointed out an error.  The responses I got in that case are very similar to the ones today for the CRU - basically the responses either are tangential to the basic point or try to retroactively change the alarmists original assertions.  They are responses that stand up only if the questioner is unwilling or unable to do the smallest amount of verification work (in other words, they work with most of the media).

The series of posts began with this image from the recent US government climate assessment.  Its point was to provide electric grid outages as a proxy measurement variable for severe weather, the point being that severe weather must have increased.

electrical-outage

I thought this chart smelled funny

This chart screams one thing at me:  Basis change.  Somehow, the basis for the data is changing in the period.  Either reporting has been increased, or definitions have changed, or there is something about the grid that makes it more sensitive to weather, or whatever  (this is a problem in tornado charts, as improving detection technologies seem to create an upward incidence trend in smaller tornadoes where one probably does not exist).   But there is NO WAY the weather is changing this fast, and readers should treat this whole report as a pile of garbage if it is written by people who uncritically accept this chart.

So I called the owner of the data set at the EIA

He said that there may be an underlying upward trend out there (particularly in thunderstorms) but that most of the increase in this chart is from improvements in data gathering.  In 1997, the EIA (and Makins himself) took over the compilation of this data, which had previously been haphazard, and made a big push to get all utilities to report as required.  They made a second change and push for reporting in 2001, and again in 2007/2008.  He told me that most of this slope is due to better reporting, and not necessarily any underlying trend.   In fact, he said there still is some under-reporting by smaller utilities he wants to improve so that the graph will likely go higher in the future....

At the end of the day, this disturbance data is not a good proxy for severe weather.

The author of that section of the report, Evan Mills, responded and then I dealt with his response here.  Here is just one example of the BS we have to slog through every time we criticize even a tangential analysis like this.  See the links for his whole response, but he says in part:

As noted in the caption to the figure on page 58 of our report (shown above)"”which was masked in the blogger's critique [ed.  actually it was not masked- the source I got the chart from had left off the caption]"”we expressly state a quite different finding than that imputed by the blogger, noting with care that we do not attribute these events to anthropogenic climate change, but do consider the grid vulnerable to extreme weather today and increasingly so as climate change progresses, i.e.:

"Although the figure does not demonstrate a cause-effect relationship between climate change and grid disruption, it does suggest that weather and climate extremes often have important effects on grid disruptions."

The associated text in the report states the following, citing a major peer-reviewed federal study on the energy sector's vulnerability to climate change:

"The electricity grid is also vulnerable to climate change effects, from temperature changes to severe weather events."

This was pretty amazing - citing his chart's caption but hoping that somehow I or other readers would miss the very first line of the caption which he fails to quote:

To Dr. Mills' point that I misinterpreted him "” if all he wanted to say was that the electrical grid could be disturbed by weather or was vulnerable to climate change, fine.  I mean, duh.  If there are more tornadoes knocking about, more electrical lines will come down.  But if that was Dr. Mills ONLY point, then why did he write (emphasis added):

The number of incidents caused by extreme weather has increased tenfold since 1992.  The portion of all events that are caused by weather-related phenomena has more than tripled from about 20 percent in the early 1990s to about 65 percent in recent years.  The weather-related events are more severe"¦

He is saying flat out that the grid IS being disturbed 10x more often and more severely by weather.  It doesn't even say "reported" incidents or "may have" "” it is quite definitive.  So which one of us is trying to create a straw man?   It is these statements that I previously claimed the data did not support, and I stand by my analysis on that.

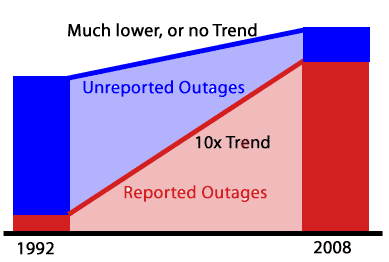
I deconstructed a lot of the rest of his longer post, and you can follow it all, but the bottom line is that if a you are drawing a trend line between two points, and you have much more data missing from the begginning end point than the end, your trend is going to be SNAFU'd.  Period.  No point in arguing about it.  See the chart below.  It represents the situation at hand.  The red is the reported data.  The blue is the unreported data, which declines as a percentage of the total due to a push for better data reporting by the database owners.  My point was simply that the red trend line was meaningless.  Its amazing to me that even accepting the basics of this picture, Dr. Mills wants to fight that conclusion.

trend

I am reminded by one of the now-famous quotes from the CRU emails

I really wish I could be more positive about the Kyrgyzstan material, but I swear I pulled every trick out of my sleeve trying to milk something out of that. I don't think it'd be productive to try and juggle the chronology statistics any more than I already have - they just are what they are...

Yep, sometimes the measured results from nature are what they are.  Well, I actually that most of the time they are what they are, but not in climate apparently.  Never give up a flawed analysis that yields the "right" answer without a fight.  I concluded:

Look Dr. Mills, I don't have an axe to grind here.  This is one chart out of bazillions making a minor point.  But the data set you are using is garbage, so why do you stand by it with such tenacity?  Can't anyone just admit "you know, on thinking about it, there are way to many problems with this data set to declare a trend exists.

Example of Climate Work That Needs to be Checked and Replicated

When someone starts to shout "but its in the peer-reviewed literature" as an argument-ender to me, I usually respond that peer review is not the finish line, meaning that the science of some particular point is settled.  It is merely the starting point, where now a proposition is in the public domain and can be checked and verified and replicated and criticized and potentially disproved or modified.

The CRU scandal should, in my mind, be taken exactly the same way.  Unlike what more fire-breathing skeptics have been saying, this is not the final nail in the coffin of catastrophic man-made global warming theory.  It is merely a starting point, a chance to finally move government funded data and computer code into the public domain where it has always belonged, and start tearing it down or confirming it.

To this end, I would like to share a post from year ago, showing the kind of contortions that skeptics have been going through for years to demonstrate that there appear to be problems in  key data models -- contortions and questions that could have been answered in hours rather than years if the climate scientists hadn't been so afraid of scrutiny and kept their inner workings secret.  This post is from July, 2007.  It is not one of my most core complaints with global warming alarmists, as I think the Earth has indeed warmed over the last 150 years, though perhaps by less than the current metrics say.  But I think some folks are confused why simple averages of global temperatures can be subject to hijinx.  The answer is that the averages are not simple:

A few posts back, I showed how nearly 85% of the reported warming in the US over the last century is actually due to adjustments and added fudge-factors by scientists rather than actual measured higher temperatures.  I want to discuss some further analysis Steve McIntyre has done on these adjustments, but first I want to offer a brief analogy.

Let's say you had two compasses to help you find north, but the compasses are reading incorrectly.  After some investigation, you find that one of the compasses is located next to a strong magnet, which you have good reason to believe is strongly biasing that compass's readings.  In response, would you

  1. Average the results of the two compasses and use this mean to guide you, or
  2. Ignore the output of the poorly sited compass and rely solely on the other unbiased compass?

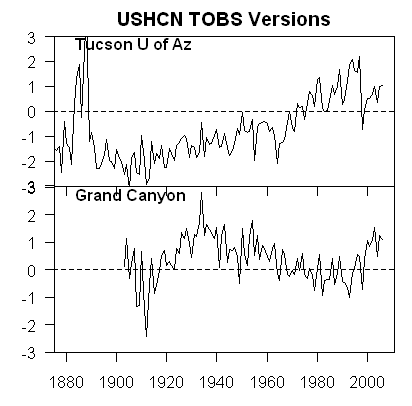
Most of us would quite rationally choose #2.  However, Steve McIntyre shows us a situation involving two temperature stations in the USHCN network in which government researchers apparently have gone with solution #1.  Here is the situation:

He compares the USHCN station at the Grand Canyon (which appears to be a good rural setting) with the Tucson USHCN station I documented here, located in a parking lot in the center of a rapidly growing million person city.   Unsurprisingly, the Tucson data shows lots of warming and the Grand Canyon data shows none.  So how might you correct Tucson and the Grand Canyon data, assuming they should be seeing about the same amount of warming?  Would you

average them, effectively adjusting the two temperature readings

towards each other, or would you assume the Grand Canyon data is cleaner

with fewer biases and adjust Tucson only?   Is there anyone who would not choose the second option, as with the compasses?

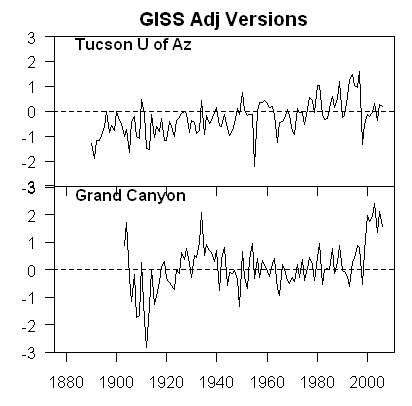
The GISS data set, created by the Goddard Center of NASA, takes the USHCN data set and somehow uses nearby stations to correct for anomalous stations.  I say somehow, because, incredibly, these government scientists, whose research is funded by taxpayers and is being used to make major policy decisions, refuse to release their algorithms or methodology details publicly. They keep it all secret!  Their adjustments are a big black box that none of us are allowed to look into  (and remember, these adjustments account for the vast majority of reported warming in the last century).

We can, however, reverse engineer some of these adjustments, and McIntyre does.  What he finds is that the GISS appears to be averaging the good and bad compass, rather than throwing out or adjusting only the biased reading.  You can see this below.  First, here are the USHCN data for these two stations with only the Time of Observation adjustment made (more on what these adjustments are in this article).
Grand_12

As I said above, no real surprise "“ little warming out in undeveloped nature, lots of warming in a large and rapidly growing modern city.  Now, here is the same data after the GISS has adjusted it:

Grand_15

You can see that Tucson has been adjusted down a degree or two, but Grand Canyon has been adjusted up a degree or two (with the earlier mid-century spike adjusted down).  OK, so it makes sense that Tucson has been adjusted down, though there is a very good argument to be made that it should be been adjusted down more, say by at least 3 degrees**.  But why does the Grand Canyon need to be adjusted up by about a degree and a half?  What is biasing it colder by 1.5 degrees, which is a lot?  The answer:  Nothing.  The explanation:  Obviously, the GISS is doing some sort of averaging, which is bringing the Grand Canyon and Tucson from each end closer to a mean.

This is clearly wrong, like averaging the two compasses.  You don't average a measurement known to be of good quality with one known to be biased.  The Grand Canyon should be held about the same, and Tucson adjusted down even more toward it, or else thrown out.  Lets look at two cases.  In one, we will use the GISS approach to combine these two stations"“ this adds 1.5 degrees to GC and subtracts 1.5 degrees from Tucson.  In the second, we will take an approach that applies all the adjustment to just the biases (Tucson station) "” this would add 0 degrees to GC and subtract 3 degrees from Tucson.  The first approach, used by the GISS, results in a mean warming in these two stations that is 1.5 degrees higher than the more logical second approach. No wonder the GISS produces the highest historical global warming estimates of any source!  Steve McIntyre has much more.

** I got to three degrees by applying all of the adjustments for GC and Tucson to Tucson.  Here is another way to get to about this amount.   We know from studies that urban heat islands can add 8-10 degrees to nighttime urban temperatures over surrounding undeveloped land.  Assuming no daytime effect, which is conservative, we might conclude that 8-10 degrees at night adds about 3 degrees to the entire 24-hour average.

Postscript: Steve McIntyre comments (bold added):

These adjustments are supposed to adjust for station moves "“ the procedure is described in Karl and Williams 1988 [check], but, like so many climate recipes, is a complicated statistical procedure that is not based on statistical procedures known off the island. (That's not to say that the procedures are necessarily wrong, just that the properties of the procedure are not known to statistical civilization.) When I see this particular outcome of the Karl methodology, my mpression is that, net of the pea moving under the thimble, the Grand Canyon values are being blended up and the Tucson values are being blended down. So that while the methodology purports to adjust for station moves, I'm not convinced that the methodology can successfully estimate ex post the impact of numerous station moves and my guess is that it ends up constructing a kind of blended average.

LOL.  McIntyre, by the way, is the same gentleman who helped call foul on the Mann hockey stick for bad statistical procedure.

Pretty Good Climategate Summary

From Christopher Booker at the Telegraph via Anthony Watts

There are three threads in particular in the leaked documents which have sent a shock wave through informed observers across the world. Perhaps the most obvious, as lucidly put together by Willis Eschenbach (see McIntyre's blog Climate Audit and Anthony Watt's blog Watts Up With That), is the highly disturbing series of emails which show how Dr Jones and his colleagues have for years been discussing the devious tactics whereby they could avoid releasing their data to outsiders under freedom of information laws.

They have come up with every possible excuse for concealing the background data on which their findings and temperature records were based.

This in itself has become a major scandal, not least Dr Jones's refusal to release the basic data from which the CRU derives its hugely influential temperature record, which culminated last summer in his startling claim that much of the data from all over the world had simply got "lost". Most incriminating of all are the emails in which scientists are advised to delete large chunks of data, which, when this is done after receipt of a freedom of information request, is a criminal offence.

But the question which inevitably arises from this systematic refusal to release their data is "“ what is it that these scientists seem so anxious to hide? The second and most shocking revelation of the leaked documents is how they show the scientists trying to manipulate data through their tortuous computer programmes, always to point in only the one desired direction "“ to lower past temperatures and to "adjust" recent temperatures upwards, in order to convey the impression of an accelerated warming. This comes up so often (not least in the documents relating to computer data in the Harry Read Me file) that it becomes the most disturbing single element of the entire story. This is what Mr McIntyre caught Dr Hansen doing with his GISS temperature record last year (after which Hansen was forced to revise his record), and two further shocking examples have now come to light from Australia and New Zealand.

In each of these countries it has been possible for local scientists to compare the official temperature record with the original data on which it was supposedly based. In each case it is clear that the same trick has been played "“ to turn an essentially flat temperature chart into a graph which shows temperatures steadily rising. And in each case this manipulation was carried out under the influence of the CRU.

What is tragically evident from the Harry Read Me file is the picture it gives of the CRU scientists hopelessly at sea with the complex computer programmes they had devised to contort their data in the approved direction, more than once expressing their own desperation at how difficult it was to get the desired results.

The third shocking revelation of these documents is the ruthless way in which these academics have been determined to silence any expert questioning of the findings they have arrived at by such dubious methods "“ not just by refusing to disclose their basic data but by discrediting and freezing out any scientific journal which dares to publish their critics' work. It seems they are prepared to stop at nothing to stifle scientific debate in this way, not least by ensuring that no dissenting research should find its way into the pages of IPCC reports.

Banning Dissent, Even in Science

I am constantly amazed at the totalitarianism of the global warming community and their absolute intolerance of dissent.  One suspects that a reason more people are skeptical of alarmist predictions is that they know enough about human behavior to distrust someone who claims to be correct but refuses to respond to or even allow questions or replication.

Anthony Watt has a good example from the world of polar bears:

Exile for non-believers (PDF, press release)

Mitchell Taylor is a world's leading polar bear expert. He has studied a greater number of polar bear populations than anyone else. He has caught more polar bears than anyone else.

He was going to attend the 2009 meeting of the Polar Bear Specialist Group (PBSG). The name sounds technical, doesn't it? Unfortunately, in one of his papers, he wrote this somewhat self-evident, yet detailed, balanced, and carefully worded description of the polar bears' situation:

"The concern that polar bears will decline if the climate continues to warm is valid. However, the assertion that polar bears will become extinct unless immediate measures are taken to curb greenhouse gas emissions is irrational because it is inconsistent with the long-term persistence of polar bears through previous periods of warming and cooling; and because the IPCC climate model predictions 50 and 100 years into the future do not suggest a future with insufficient sea ice to support polar bears as a viable species."

What was the answer? He wasn't allowed to participate. Here is Mr Andrew Derocher's letter:

Hi Mitch,

The world is a political place and for polar bears, more so now than ever before. I have no problem with dissenting views as long as they are supportable by logic, scientific reasoning, and the literature.

I do believe, as do many PBSG members, that for the sake of polar bear conservation, views that run counter to human induced climate change are extremely unhelpful. In this vein, your positions and statements in the Manhattan Declaration, the Frontier Institute, and the Science and Public Policy Institute are inconsistent with positions taken by the PBSG.

I too was not surprised by the members not endorsing an invitation. Nothing I heard had to do with your science on harvesting or your research on polar bears - it was the positions you've taken on global warming that brought opposition.

Time will tell who is correct but the scientific literature is not on the side of those arguing against human induced climate change. I look forward to having someone else chair the PBSG.

Best regards,
Andy (Derocher)

If you are not familiar with Taylor's positions that are alluded to, as I understand it they include:  1) The fact that most polar bear populations have been rising rather than falling over the last decades and 2) polar bears have survived interglacial periods in which we believe all sea ice disappeared.

Most of y'all know I have a parallel blog on climate over at Climate Skeptic.  I get accused of being "anti-science" all the time, I suppose for pursuing scientific evidence where it takes me rather than accepting the scientific "consensus" that I am told I should shut up and accept.

One response I often make to this accusation is the to compare the comment policy of leading skeptic and alarmist climate sites.  Which seem more "anti-science" to you?  Here is part of my blog's comment policy:

I have never tried to moderate my comments (except for spam, which is why you might have  a comment with embedded links held for moderation "” I am looking to filter people selling male enhancement products, not people who disagree with me.)  In fact, I relish buffoons who disagree with me when they make an ass of themselves - after all, as Napoleon said, never interrupt an enemy when he is making a mistake.  And besides, I think it makes a nice contrast with a number of leading climate alarmist sites that do not accept comments or are Stalinist in purging dissent from them.

Leading sites that are skeptical or at least are willing to ask questions of the climate orthodoxy like Watt's Up with That or Climate Audit have similar policies - their comment threads are full of people with strongly opposing opinions to the site's authors.

Now check out a comment policy from an alarmist site:

Climate "skepticism" is not a morally defensible position. The debate is over, and it's been over for quite some time, especially on this blog.

We will delete comments which deny the absolutely overwhelming scientific consensus on climate change, just as we would delete comments which questioned the reality of the Holocaust or the equal mental capacities and worth of human beings of different ethnic groups. Such "debates" are merely the morally indefensible trying to cover itself in the cloth of intellectual tolerance.

So, if you're a climate skeptic, you may be well-intentioned and you're certainly welcome to your opinion, but we're not interested.

The leading alarmist site, Real Climate, founded and run by people the media portrays as leaders in climate science, such as James Hansen, routinely purge all dissent from posts and comments.  For example, Anthony Watt wrote this after Steve McIntyre found huge problems in a recent version of a hockey stick temperature recontruction:

Realclimate.org continues deleting the ongoing river of comments posted on their threads ( Note: Any of you who find that your posts to those sites are being rejected {as usual without any explanation} can keep a copy of the post, and post it at http://rcrejects.wordpress.com if you want

I find that amazing -- someone is maintaining a blog populated with everything the "leading scientists" at Real Climate purge.  Check the stuff out there, this is not foul-mouthed mindless rants, but real scientific challenges that are being deleted.

One of the dirty secrets of climate science is that the so called "settled" science of global warming is often never challenged or replicated as we expect science should be.  When someone claims to have produced cold fusion, if they want their work to be accepted it is their obligation to publish their data and methodology for others to try to replicated.  In climate, this seldom happens.  Members of a small community all replicate and review each others' results, and claim this to be sufficient for "consensus."  When outsiders or mavericks attempt to test or replicate the results, they are stonewalled.

Here is my favorite quote to illustrate the whole mindset, and should make any reasonable person nervous who understands that Congress is on the verge of committing trillions of dollars of our money to certain courses of action based on the science.  It is from Phil Jones, who put together one of the first global temperature metrics at the Hadley Center, to Warwick Hughes, an Australian scientist who had some questions about the data and was having trouble replicating some of Jones' results.  Jones wrote, in response to Hughes request for data (data which underlies much of the early IPCC reports and so is the basis for a lot of public policy discussion):

"We have 25 years or so invested in the work. Why should I make the data available to you, when your aim is to try and find something wrong with it?"

UPDATE: Here is a great example of the way it should be done -- Steve McIntyre posts Keith Briffa's response in full, invites other responses:

In spite of suffering a serious illness (which I understand to be a kidney problem), Keith Briffa has taken the time to comment on the Yamal situation. The comment should be read by interested readers. If Briffa or any of his associates wishes to post a thread here without any editorial control on my part, they are welcome to do so.

Why I Don't Want to be Young

I suppose we all fantasize about being a teenager again.  One reason not to be young again:  My son's high school soccer team played at 4PM the other day in Phoenix.  Game time temperature:  114F.

Phrase That Needs to Be Expunged From The Political Lexicon: "Peer Reviewed"

Yesterday, while I was waiting for my sandwich at the deli downstairs, I was applying about 10% of my conciousness to CNN running on the TV behind the counter.  I saw some woman, presumably in the Obama team, defending some action of the administration being based on "peer reviewed" science.

This may be a legacy of the climate debate.  One of the rhetorical tools climate alarmists have latched onto is to inflate the meaning of peer review.  Often, folks, like the person I saw on TV yesterday, use "peer review" as a synonym for "proven correct and generally accepted in its findings by all right-thinking people who are not anti-scientific wackos."

But in fact peer review has a much narrower function, and certainly is not, either in intent or practice,  any real check or confirmation of the study in question.  The main goals of peer review are:

  • Establish that the article is worthy of publication and consistent with the scope of the publication in question.  They are looking to see if the results are non-trivial, if they are new (ie not duplicative of findings already well-understood), and in some way important.  If you think of peer-reviewers as an ad hoc editorial board for the publication, you get closest to intent
  • Reviewers will check, to the extent they can, to see if the methodology  and its presentation is logical and clear -- not necesarily right, but logical and clear.  Their most frequent comments are for clarification of certain areas of the work or questions that they don't think the authors answered.
  • Peer review is not in any way shape or form a proof that a study is correct, or even likely to be correct.  Enormous numbers of incorrect conclusions have been published in peer-reviewed journals over time.  This is demonstrably true.  For example, at any one time in medicine, for every peer-reviewed study I can usually find another peer-reviewed study with opposite or wildly different findings.
  • Studies are only accepted as likely correct a over time the community tries as hard as it can to poke holes in the findings.  Future studies will try to replicate the findings, or disprove them.  As a result of criticism of the methodology, groups will test the findings in new ways that respond to methodological criticisms.  It is the accretion of this work over time that solidifies confidence  (Ironically, this is exactly the process that climate alarmists want to short-circuit, and even more ironically, they call climate skeptics "anti-scientific" for wanting to follow this typical scientific dispute and replication process).

Further, the quality and sharpness of peer review depends a lot on the reviewers chosen.  For example, a peer review of Rush Limbaugh by the folks at LGF, Free Republic, and Powerline might not be as compelling as a peer review by Kos or Kevin Drum.

But instead of this, peer review is used by folks, particularly in poitical settings, as a shield against criticism, usually for something they don't understand and probably haven't even read themselves.  Here is an example dialog:

Politician or Activist:  "Mann's hockey stick proves humans are warming the planet"

Critic:  "But what about Mann's cherry-picking of proxy groups; or the divergence problem  in the data; or the fact that he routinely uses proxy's as a positive correlation in one period and different correlation in another; or the fact that the results are most driven by proxys that have been manually altered; or the fact that trees really make bad proxies, as they seldom actually display the assumed linear positive relationship between growth and temperature?"

Politician or Activist, who 99% of the time has not even read the study in question and understands nothing of what critic is saying:  "This is peer-reviewed science!  You can't question that."

Explaining Temperature History

I post most of my more detailed climate work over at my other blog.  But I wanted to repost here something I wrote in response to a number of request for a brief version of what is driving global temperatures.

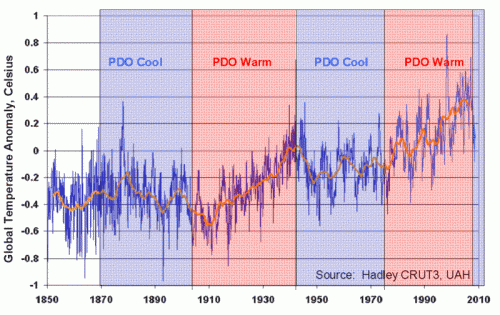
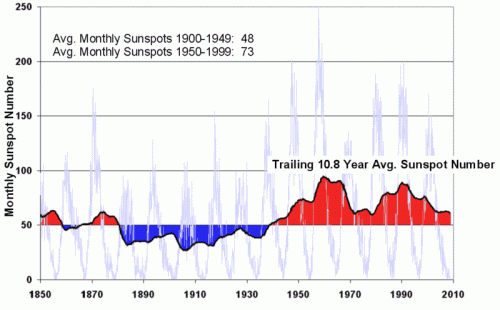
My sense is that medium to long scale 20th century temperature trends can be explained mostly through three drivers:

1.  A cyclical variation driven by multi-decade oceanic cycles like the Pacific Decadal Oscillation (PDO):

pdo

2.  Changes in solar output, either directly as increased heating or indirectly via a variety of theories on things like cosmic rays and cloud formation:

sunspot

3.  A long term trend of up to +0.05C per decade that may include a CO2-warming component.

I am willing to posit a CO2 impact net of feedbacks of perhaps 0.5-1.0C over the next century.  This may appear low, but is the only scale of number reasonably supported by history.  Any higher number would result in temperatures way too high historically.  And even assuming a number this high runs into the following problem:  There was probably a trend of about this magnitude emerging from the little ice age 200+ years ago and extending into the 20th century.  You can see it in the glacier numbers below:  (source)

glacier

Those that want to assign the temperature trend, once the sun and the PDO are removed, post-1950 to CO2, need to explain what effect was causing the nearly exact same trend from 1800-1950, and why that trend conveniently switched off at the exact moment man's CO2 takes over.  In the context of the glacier chart, what was causing the glaciers to retreat in 1880, and why is that effect not the one at work today?

With evidence that the PDO has reversed to its cool phase and that the sun may be shifting into low gear, I think it is reasonable to posit warming no more than 0.5-1.0C over the next century.  For those who have not seen it, Roy Spencer has a new paper on the PDO, clouds and temperature history.   My video on why climate models overstate future warming through absurd assumptions of high positive feedbacks is here.

Good. Now We Have It On The Table

I am happy to see that Barack Obama is not entirely in reality-avoidance mode with his climate policy:

You know, when I was asked earlier about the issue of coal, uh, you know "” Under my plan of a cap and trade system, electricity rates would necessarily skyrocket. Even regardless of what I say about whether coal is good or bad. Because I'm capping greenhouse gases, coal power plants, you know, natural gas, you name it "” whatever the plants were, whatever the industry was, uh, they would have to retrofit their operations. That will cost money. They will pass that money on to consumers.

To folks with any kind of background in economics, this has to be the case.  Reducing the total output of current power plants, and thereby obsoleting all that investment and squeezing supply, at least in the medium term until new capacity of other types can be built, can only lead to a) rationing through blackouts or b) higher prices to ration the shorter supply.  The cost of option a is so high that price is going to have to be the rationing mechanism.  Skyrocket is actually pretty close to what would happen to rates if Obama sticks by his plan of limiting greenhouse gasses to 1990 or earlier levels.  (His explanation is actually pretty poor for the mechanism - pass-through of retrofit costs would likely be minor to the supply / demand balancing effect of shaving 20/30% off supply in a short period of time.

I think a frank discussion of the dangers of a "pollutant" vs. the cost of abatement is a fair one.  I personally think the threat of CO2 is wildly exaggerated, and the cost of doubling or tripling electricity costs will hurt Americans far worse than a few tenths of a degree of warming.

But don't get too excited.  Obama is still living in economic never-never land on other related issues:

yes, there is going to be some increase in electricity rates on the front end, but that over the long term, because of combinations of more efficient energy usage, changing lightbulbs and more efficient appliance, but also technology improving how we can produce clean energy, the economy would benefit.

Sorry, but this is way wrong.  Obsoleting perfectly good infrastructure and wholesale replacing it with trillions of dollars of new infrastructure does not help the economy any more than if a massive earthquake had destroyed the plants.  This is the broken windows fallacy on steroids.  The only benefit from all this cost will be whatever climate benefit we accrue from the CO2 reduction.  For there to be such a benefit, one must assume a) substantial future warming and b) that the current temperature happens to be the best possible temperature we could ever be at.  But that, as they say, is a whole other blog.

Global Warming Eye Test

I have an interesting global warming eye test up at Climate-Skeptic.   The two graphs below are both scaled exactly the same, and are each 51-year periods from the global temperature record of the last 150 years.  The only difference is that one period of warming is described by scientists as "natural" (1895 to 1946) and the other is described as "man-made" (1957 to present).

  Periodb       Perioda_3

Which is which?  Which is man, and which is mother nature?

Kind of makes the claim that "current warming is unprecedented" ring kind of hollow, huh?

The Problem with New Wide-Gamut LCD Panels

Warning:  I am a video snob.  I often lambaste electronics store managers for doing such a terrible job adjusting their display TV's.  TV store managers have decided that the way to sell a TV is to jack up its color temperature as far into the blue range that they can, jam the contrast setting all the way to the top, irrespective of any blooming effects they get, and over-saturate the colors.

Anyway, the newest LCD panels have a property that theoretically makes them better:  They can display a much wider color gamut.  That means that there are more colors that they can display.   They do this by creating panels where the base colors are truer to their theoretical values, and by pushing each color value deeper into its possible range.  This means that the bluest blues are even bluer, if that makes sense. 

But these extreme colors are ones one seldom sees, because they are over saturated.  If you were to see the most saturated red or blue in any large field on your TV or monitor, it would make your teeth ache.  These colors look like neon lights, for lack of a better comparison.

But a wider color palette is good in theory.  My guess is that adobe photoshop running on a well-calibrated monitor could take advantage of this feature to improve the resemblance between on-screen and printed material, a key concern of graphics designers. 

The problem is that most software and color choices on the internet and in movies are based on what, say, a level 256 blue used to be.  A level 256 blue is now more saturated in the current monitors, but most software (and monitor drivers) are not smart enough to take this into account.  That means that if you buy a new LCD monitor, you will likely be looking at colors that are more saturated and therefore that glow more than your eyes can really stand, and most graphics cards and monitors do not have a control for saturation (as I found today, having to take an LG 26" monitor back to the store because everything just glowed too much  (I replaced it with a Samsung 2693M, which is much better).

You will know that this may be a problem if the literature or sales person describes the monitor as having "more vibrant" colors.  This is a euphemism for saturation, and would be all fine and good if monitor colors have previously been under-saturated, but if anything they have been the opposite.  Sales people like this feature, though, because the colors look more dramatic in their fluorescent-lighted showrooms and tend to make the monitor look "better" when next to less saturated choices.  My advice is be very wary -- Videophiles tend to run away screaming when told that a TV has some gadget that makes the colors more vibrant.

I'm Not Sure the Data Means What You Think It Means

Over at Climate Skeptic, I discuss a recent claim by ABC that year-to-date tornado frequency has nearly doubled vs. 2007, and that this is because of global warming.  I will take their word for it that tornado frequency is up, but there is one tiny problem:  The US in Jan-Apr of this year was almost a full degree cooler than last year.  So if tornado frequency is up, and ABC is correct that yearly changes in this metric are due to changes in global temperature, then it can only mean that global warming reduces, rather than increases, tornadoes.

Freedom from Criticism

I have argued many times on this page that there is a dangerous new rights theory gaining traction in today's college campuses.  That theory holds that there exists a freedom (mostly for people in "protected" groups -- women, minorities, etc) from being offended or even being criticized, and that this trumps free speech. 

For years I have supported the legality of what is called hate speech -- not because I agreed with it, but because I thought its expression, no matter how contemptible, should be legal.  Free speech should have no content tests.  I also argued that there was a slippery slope.  If making racist remarks is illegal today, perhaps just criticizing a woman or an African American might be illegal tomorrow.

Enter Priya Venkatesan, former English teacher at Dartmouth.  Ms. Venkatesan was hired by Dartmouth to teach all kinds of odd (but always trendy) socialist eco-feminist babble.  Such courses seem to be a staple of colleges today.  I remember a number of such professors at Princeton, but it was no big deal as long as the course were clearly labeled and one could avoid them.  After all, if people really were attracted to such drivel, it just left more spots open for the rest of us in classes that actually prepared us for the real world. 

The problems began, though, when Ms. Venkatesan's students refused to blindly agree with her  (apparently, they did not attend the University of Delaware indoctrination course that explained why you are not allowed to criticize anyone but white males).

The agenda of Ms. Venkatesan's seminar, then, was to
"problematize" technology and the life sciences. Students told me that
most of the "problems" owed to her impenetrable lectures and various
eruptions when students indicated skepticism of literary theory. She
counters that such skepticism was "intolerant of ideas" and "questioned
my knowledge in very inappropriate ways." Ms. Venkatesan, who is of
South Asian descent, also alleges that critics were motivated by
racism, though it is unclear why.

After a winter of discontent, the snapping point came
while Ms. Venkatesan was lecturing on "ecofeminism," which holds, in
part, that scientific advancements benefit the patriarchy but leave
women out. One student took issue, and reasonably so "“ actually,
empirically so. But "these weren't thoughtful statements," Ms.
Venkatesan protests. "They were irrational." The class thought
otherwise. Following what she calls the student's "diatribe," several
of his classmates applauded.

Ms. Venkatesan informed her pupils that their behavior
was "fascist demagoguery." Then, after consulting a physician about
"intellectual distress," she cancelled classes for a week. Thus the
pending litigation.

Litigation, exposure of the names behind anonymous course evaluations, and email threats from Ms. Venkatesan follow.  More from Lubos Motl.

Postscript:  By the way, it is just astounding to me that anyone with an over-room-temperature IQ could passionately believe that technological progress is bad for women.  One might argue that way society is organized still under-utilizes women and/or puts artificial roadblocks up to a woman's progress, but get some perspective!

Pre-modern life for women was horrible.  Because of the biological complexities of child-rearing alone, they died young far more often than men and their physical vulnerability caused them to be marginalized in virtually every society of every culture of the world until at least 1750 and really until 1900.  The whole women's movement is built on a platform of technology that only begins with the pill and encompasses a thousand things from automobiles to computers that reduce the importance of size and physical strength in getting ahead in the world. 

Thoughts for the Day

Happy Birthday Vladimer Lenin Earth Day.  I have a few thoughts for the day:

Sucking the Oxygen Out of the Environmental Movement

Observe today how little of the discussion is about anything other than climate.  There are still many environmental issues in the world that can be improved by the application of man's effort and technology -- unfortunately, climate is the least of these but the issue getting the most attention.  Consider how the global warming panic has sucked the oxygen out of the environmental movement.  Ten years from now, I predict that true environmentalists will be looking back on the hysteria over trace amounts of CO2 in the atmosphere as a huge setback for real environmental progress.

Environmentalism and Socialism

If you attend any Earth Day events today, notice how many of the speeches and presentations and such are anti-corporate, anti-trade, anti-capitalist, anti-wealth screeds, and have little to do with the environment.  If you actually go to a live Earth Day event, you will see why the selection of Lenin's birthday was no accident.  You will not see this on the network news, because the media is sympathetic to the environmental movement and tends to edit the socialist rants out as PR protection for the environmentalists, knowing that American audiences would lose sympathy for them if they listened to the whole package. (This is mostly an American phenomenon - I have found from my brief travels in Europe that the media there does less such editing, perhaps because they know their audience is more comfortable with socialism).

The Climate Denier Trick

There are a lot of reasons not to be worried about "inaction" on global warming.  To justify the enormously expensive cuts in CO2 productions, on the order of 80% as supported by Obama and Clinton, one has to believe every element of a five-step logic chain:

  1. Mankind is increasing CO2 concentrations in the atmosphere
  2. Increased atmospheric CO2 causes the world to warm (by some amount, large or small)
  3. The increases in CO2 from man will cause substantial warming, large enough to be detectable above natural climate variations
  4. The increases in world temperatures due to man's CO2 will have catastrophic impacts on civilization
  5. These catastrophic impacts and their costs are larger than the enormous costs, in terms of poverty and lost wealth, from reducing CO2 with current technologies.

Climate alarmists have adopted a rhetorical trick that no one in the media seems willing to call them on.   They like to wage the debate over global warming policy on points one and two only, skipping over the rest.  Why?  Because the science behind numbers one and two are pretty strong.  Yes, there are a few folks who will battle them on these points, but even very strong skeptics like myself accept points one and two as proved. 

Here are some examples of how this trick works.  If, like me, you do not accept steps 3-4-5 in the above logic chain, you will be called a "denier."  When asked what a denier means, a climate alarmist will often position this denial as somehow disputing #1 and #2.  On the other hand, if one publicly accepts #1 and #2, the alarmist will shout "QED" and then proceed to say that strong action on CO2 is now justified.  When an alarmist says that the a consensus exists, he is probably correct on points 1 and 2.  But he is absolutely incorrect that a consensus exists on 3-4-5.

Don't believe me?  Think back to the early Republican debate, where the moderator asked for a show of hands whether [I can't remember the exact question] man was causing global warming.  The implication is that you either have to accept this whole logic chain or not.  One can see why Fred Thompson begged to have 90 seconds to explain his position, and why the moderator, presumably in the alarmist camp, denied it to him. 

Over the last year or two, skeptics have gotten a lot better at making their argument.  Most all of them, like I do, begin their arguments by laying out a logic chain like this and explaining why one can believe that man-made greenhouse gases cause warming without accepting the need for drastic climate action.  The result?  Alarmists have stopped debating, and/or have declared that the debate is "over."  Remember that last great Al Gore climate debate?  Neither do I.

The Single Best Reason Not To Be Worried About Climate

I could, and have, in my books and videos, made arguments on many points in 3-4-5 (links at the bottom of the post).  In four, no one ever considers the good effects of warming (e.g. on growing seasons and crop yields) and most every other problem is greatly exaggerated, from hurricane formation to sea level rises.  And in five, every time someone has tried to put a price on even small reductions in CO2, the numbers are so enormous that they are quickly suppressed by a environmentalist-sympathetic media.  Suffice it to say that even the climate-sanctimonious Europeans have not been willing to pay the price for even slowing down their CO2 growth (which has risen faster than in the US), much less reducing it.

But in this logic chain, there is little need to argue about four and five if #3 is wrong.  And it is.

The effects of CO2 acting alone on temperatures are quite small -- And everyone, even the alarmists, agree!  A doubling of CO2 concentrations, without other effects that we will discuss
in a moment, will heat the earth no more than about 1 degree Celsius (though several studies recently have argued the number is much less).  This is not some skeptic's hallucination -- this is
straight out of the IPCC third and fourth assessments [IPCC text quoted here].  In fact, the IPCC in their reports has steadily reduced their estimate of the direct contribution of CO2 on temperatures.  CO2, acting
alone, warms the Earth only slowly, and at this rate we would see less
than a degree of warming over the next century, more of a nuisance than
a catastrophe.

But some scientists do come up with catastrophic warming
forecasts.  They do so by assuming that our Earth's climate is
dominated by positive feedbacks that multiply the initial warming from
CO2 by a factor of three, four, five or more.  This is a key point -- the
catastrophe does not come from the science of greenhouse gases, but
from separate hypotheses that the earth's climate is dominated by
positive feedback.
This is why saying that greenhouse gas
theory is "settled" is irrelevant to the argument about catastrophic
forecasts.  Because these positive feedbacks are NOT settled science.

In fact, the IPCC admits it does not even know the sign of
the most important effect (water vapor), much less its magnitude.  They
assume that the net effect is positive, and in fact strongly so - on the order of 60-80% feedback or more, nearly unprecedented numbers for a long-term stable physical system [more on feedback and its math here].  This is particularly ironic because alarmist Michael Mann, with his hockey stick, famously posited that temperatures over the last 1000 years were incredibly flat and stable until man started burning fossil fuels, a proposition that is hard to believe if the climate is dominated by strong positive feedback.   Note that when people like Al Gore say things like "tipping point," they are in effect hypothesizing that feedback is greater than 100%, meaning that climate can be a runaway process, like nuclear fission.

In fact, with the 100 or so years of measurements we have for temperature and CO2, empirical evidence does not support these high positive feedbacks.
Even if we assign all the 20th century warming to CO2, which is
unlikely, our current warming rates imply close to zero feedback.  If
there are other causes for measured 20th century warming other than
CO2, thereby reducing the warming we blame on CO2, then the last
century's experience implies negative rather than positive feedback in
the system.  As a result, it should not be surprising that high
feedback-driven forecasts from the 1990 IPCC reports have proven to be
way too high vs. actual experience (something the IPCC has since
admitted).

However, climate scientists are unwilling to back down from the thin
branch they have crawled out on.  Rather than reduce their feedback
assumptions to non-catastrophic levels, they currently hypothesize a
second man-made cooling effect that is masking all this feedback-driven
warming.  They claim now that man-made sulfate aerosols and black
carbon are cooling the earth, and when some day these pollutants are
reduced, we will see huge catch-up warming.  If anything, this cooling
effect is even less understood than feedback.  What we do know is that,
unlike CO2, the effects of these aerosols are short-lived and therefore
localized, making it unlikely they are providing sufficient masking to
make catastrophic forecasts viable.  I go into several reality checks
in my videos, but here is a quick one:  Nearly all the man-made cooling
aerosols are in the northern hemisphere, meaning that most all the
cooling effect should be there -- but the northern hemisphere has
actually exhibited most of the world's warming over the past 30 years,
while the south has hardly warmed at all.

In sum, to believe catastrophic warming forecasts, one has to believe both of the following:

  1. The climate is dominated by strong positive feedback, despite
    our experience with other stable systems that says this is unlikely and
    despite our measurements over the last 100 years that have seen no such
    feedback levels.
  2. Substantial warming, of 1C or more, is being masked by aerosols,
    despite the fact that aerosols really only have strong presence over
    5-10% of the globe and despite the fact that the cooler part of the
    world has been the one without the aerosols.

Here's what this means:  Man will cause, at most, about a degree of
warming over the next century.  Most of this warming will be
concentrated in raising minimum temperatures at night rather than
maximum daytime temperatures  (this is why, despite some measured
average warming, the US has not seen an increase of late in maximum
temperature records set
).  There are many reasons to believe that man's
actual effect will be less than 1 degree, and that whatever effect we
do have will be lost in the natural cyclical variations the climate
experiences, but we are only just now starting to understand.

To keep this relatively short, I have left out all the numbers and
such.  To see the graphs and numbers and sources, check out my new climate video, or my longer original video, or download my book for free.

Update: Very relevant article by Roy Spencer on the over-estimation of feedback in climate models.

Many of us, especially those who were trained as meteorologists,
have long questioned the climate research community's reliance on
computerized climate models for global warming projections.  In
contrast to our perception that the real climate system is constantly
readjusting to internal fluctuations in ways that stabilize the system,
climate models built upon measured climate behavior invariably suggest
a climate system that is quite sensitive - sometimes catastrophically
sensitive "” to perturbations such as those from anthropogenic
greenhouse gas emissions.  Unfortunately, it has been difficult to
articulate our "˜hand-waving' concerns in ways that the modelers would
appreciate, i.e., through equations.   

After years of pondering this issue, and after working on our two
latest papers on feedbacks (Spencer et al., 2007; Spencer and Braswell,
2008, hereafter SB08), I believe that I can now explain the main reason
for this dichotomy.   Taking the example of clouds in the climate
system, the issue can be introduced in the form of a question:

To what extent are climatic variations in
clouds caused by temperature change (feedback), versus temperature
change being the result of cloud variations? 

The Keystone Issue of Global Warming

Cross-posted from Climate Skeptic.  I believe this to be an extremely important issue.  Catastrophic global warming forecasts are driven not by greenhouse gas theory, but by the theory that the Earth's climate is dominated by positive feedback.  This post discusses these issues:

It is silly to argue whether CO2 in the atmosphere can cause global warming: It clearly does.  The issue is not "if" but "how much".  The warming from man's CO2 might be 8 degrees in a century, as Al Gore might argue, in which case man's CO2 would be incredibly disruptive.  Or it might cause just a few tenths of a degree of warming, which might be unnoticeable within the noise of natural climate variation.

Interestingly, the key to understanding this issue of the amount of warming does not actually lie in greenhouse gas theory.  Most scientists, skeptics and alarmists alike, peg the warming directly from CO2 at between 0.3 and 1.0 degrees Celsius for a doubling in CO2 levels  (this notion of how much temperatures would increase for a doubling of CO2 levels is called climate sensitivity).  If this greenhouse gas warming was the only phenomenon at work, we would expect man-made warming over the next century even using the most dire assumptions to be less than 1C, or about the same amount we have seen (non-catastrophically) over the last century.  Warming forecasts of this magnitude would not in any way, shape, or form justify the draconian economic impacts of many current government carbon reduction proposals.

The key, as I have written before (and here), lies not in greenhouse gas theory itself but in the theory that the earth's climate is dominated by positive feedback.  This theory hypothesizes that small changes in temperature from greenhouse gas increases would be multiplied 3,4,5 times or more by positive feedback effects, from changes in atmospheric water vapor to changing surface albedo.

Let me emphasize again:  The catastrophe results not from greenhouse gas theory, but from the theory of extreme climactic positive feedback.  In a large sense, all the debate in the media is about the wrong thing!  When was the last time you saw the words "positive feedback" in a media article about climate?

Christopher Monckton has an absolutely dead-on post at Roger Pielke's blog about this feedback theory that I want to excerpt in depth.

This chart is a good place to start.  It shows the changes in the IPCC's estimate for climate sensitivity to CO2 and how it has changed over the course of the reports.  More importantly, he splits the forecast between the amount due directly to Co2, and the amount due to the multiplicative effect of positive feedback.  The green bar is the direct contribution of Co2, and the pink is the feedback.

Fig3

We can observe a couple of things.  First, the IPCC's estimate of the amount of warming due to CO2 directly via the greenhouse gas effect has actually been going down over time.  (Note that there are those, like Richard Lindzen, who suggest these numbers are still three times too high given that we have not observed a difference in surface and lower troposphere warming that greenhouse gas theory seems to predict).

Second, you will see that the IPCC's overall forecasts of climate sensitivity have been going up only because their estimates of positive feedback effects have gone way up.  The IPCC assumes that feedback effects multiply warming from CO2 by three.  And note that the IPCC's forecasts of feedback effects trail those of folks like James Hansen and Al Gore. 

So how confident are we in these feedback effects?  Well, it turns out we are not even sure of the sign!  As Monckton writes:

The feedback factor f accounts for at least two-thirds of all radiative forcing in IPCC (2007); yet it is not expressly quantified, and no "Level Of Scientific Understanding" is assigned either to f or to the two variables b and κ upon which it is dependent....

Indeed, in IPCC (2007) the stated values for the feedbacks that account for more than two-thirds of humankind's imagined effect on global temperatures are taken from a single paper. The value of the coefficient z in the CO2 forcing equation likewise depends on only one paper. The implicit value of the crucial parameter κ depends upon only two papers, one of which had been written by a lead author of the chapter in question, and neither of which provides any theoretical or empirical justification for the IPCC's chosen value. The notion that the IPCC has drawn on thousands of published, peer-reviewed papers to support its central estimates for the variables from which climate sensitivity is calculated is not supported by the evidence.

Given the importance of feedback to their forecasts, the treatment in the latest IPCC report of feedback borders on the criminal.  I have read the relevant sections and it is nearly impossible to find any kind of discussion of these issues.  A cynical mind might describe the thousands of pages of the IPCC report as the magician grabbing your attention with his left hand to hide what is in his right hand.  And what is being hidden is that ... there is nothing there!  Feedback is the pivotal point on which the whole discussion of drastic carbon abatement should turn and there is nothing there. 

Monckton goes further, to point out that hidden in the IPCC numbers lies an absurdity:

if the upper estimates of each of the climate-relevant feedbacks listed in IPCC (2007) are summed, an instability arises. The maxima are -

Water vapor 1.98, lapse rate -0.58, surface albedo 0.34, cloud albedo 1.07, CO2 0.57, total 3.38 W m-2 K-1.

The equation f = (1 - bκ)-1 becomes unstable as b → κ-1 = 3.2 W m-2 K-1. Yet, if each of the individual feedbacks imagined by the IPCC is increased to less than the IPCC's maximum, an instability or "runaway greenhouse effect" is reached.

Yet it is reliably inferred from palaeoclimatological data that no "runaway greenhouse effect" has occurred in the half billion years since the Cambrian era, when atmospheric CO2 concentration peaked at almost 20 times today's value

Positive feedback can be weird and unstable.  If there is enough of it, processes tend to run away (e.g. nuclear fission), which is what Monckton is arguing that some of the IPCC assumptions lead to.  Even when feedback is less positive, it still can cause processes to fluctuate wildly.  In fact, it is fairly unusual for long-term stable processes like climate to be dominated by positive feedback.  Most scientists, when then meet a new process, would probably assume negative feedback until proven otherwise.  This is a particular issue in climate, where folks like Michael Mann have gone out of their way to argue that the world temperature history over the last 1000 years before man began burning fossil fuels is incredibly stable and unchanging.  If so, how can this be consistent with strong positive feedback?

Anyway, there is a lot more numerical detail in Monckton's post if you want to dig into the equations.

I would add one thing to his analysis:  If you look at the last 100 years of history, the change in temperature given the observed change in CO2 levels comes no where close to a climate sensitivity of 3 or more, even when you assign all historical warming to CO2 rather than other effects like the sun.  In fact, as I showed in this analysis, climate sensitivity appears to be 1.2 when one assigns all past warming to CO2, and something well less than that if one accepts the sun and other effects also play a role.  These historical analyses would point to feedback that is either zero or negative rather than positive, more in line with what one would expect from complex natural systems.

You can see a discussion of many of these topics in the video below:

Math Geek Humor

In his analysis of his hockey stick temperature reconstruction, Michel Mann claimed that his results were robust to changes in certain weighting factors.  Humorously, Steven McIntyre demonstrates that it is robust because when you do the math, the weighting factors actually cancel out of  all the equations.  In effect, Mann was saying that y =3x/x  gives the answer "3" robustly for all values of x (well, except zero).  True, but scientifically meaningless.  But worrisome when a scientist has to run numerous simulations to discover the fact.  I presume he thought his weighting factors were actually doing something in his model.

Reason #4163 to be really, really confident in those climate models these guys are building.

The Rent-Seekers Ball

From Steven Milloy:

The audience -- a sold-out crowd of hundreds who had to apply to be admitted and pay a $3,500 fee -- consisted of representatives of the myriad businesses that seek to make a financial killing from climate alarmism. There were representatives of the solar, wind, and biofuel industries that profit from taxpayer mandates and subsidies, representatives from financial services companies that want to trade permits to emit CO2, and public relations and strategic consultants to all of the above.
    
    We libertarians would call such an event a rent-seekers ball -- the vast majority of the audience was there to plot  how they could lock-in profits from government mandates on taxpayers and consumers.
    
    It was an amazing collection of pseudo-entrepreneurs who were absolutely impervious to the scientific and economic facts that ought to deflate the global warming bubble.

    In the interlude between presentations by the CEOs of Dow Chemical and Duke Energy, for example, the audience was shown a slide -- similar to this one -- of the diverging
    relationship between atmospheric CO2 levels and average global temperature since 1998. That slide should have caused jaws to drop and audience members to ponder why anyone is considering regulating CO2 emissions in hopes of taming global climate.

    Instead, it was as if the audience did a collective blink and missed the slide entirely. When I tried to draw attention to the slide during my presentation, it was as if I was speaking in a foreign dialect.

    The only conclusion I could come to was that the audience is so steeped in anticipation of climate profiteering that there is no fact that will cause them to reconsider whether or not manmade global warming is a reality.

But of course we all know that it is the skeptics that are corrupted by money ;=)

Measuring Urban Heat Islands

My son finished his science fair project to measure the Phoenix urban heat island, the effect the IPCC swears is too small to have an effect on surface temperature measurements.  See all his results at Climate Skeptic.

Climate Rorschach Test

Over at Climate Skeptic, I have what could be called a climate Rorschach test.  Look at these two images below.  The left is the temperature plot for Lampasas, Texas, a station in the NASA GISS global warming data base.  On the right is the location of the temperature station since the year 2000 (the instrument is in the while cylinder in the middle of the picture under the dish).  Click either picture to expand

Lampasas_tx_ushcn_plot_2


Lampasas_tx_ushcn

So here is the eye test:  Do you read the warming since 2000 as man-made global warming due to CO2, or do you read it as a move of the temperature instrument to a totally inappropriate urban site to which the instrument was moved in 2000, contaminated with hot asphalt, car radiators, nearby buildings, air conditioning exhaust, etc?

You should know that NASA's GISS reads this as man-made global warming, and reports it as such.  Further, NASA actually takes the raw data above and in their computer model lowers temperatures in 1900 and 1920, actually increasing the apparent warming trend.  For the record, the GISS opposes this kind of photo survey as worthless and argues that their computer algorithms, which correct for urban warming at this site in 1900 but not in 2007, work just fine with no knowledge of the specific site location.

A Junior High Science Project That Actually Contributes A Small Bit to Science

Cross-posted from Climate Skeptic

Tired of build-a-volcano junior high science fair projects, my son and I tried to identify something he could easily do himself (well, mostly, you know how kids science projects are) but that would actually contribute a small bit to science.  This year, he is doing a project on urban heat islands and urban biases on temperature measurement.   The project has two parts:  1) drive across Phoenix taking temperature measurements at night, to see if there is a variation and 2) participate in the surfacestations.org survey of US Historical Climate Network temperature measurement sites, analyzing a couple of sites for urban heat biases. 

The results of #1 are really cool (warm?) but I will save posting them until my son has his data in order.  Here is a teaser:  While the IPCC claims that urban heat islands have a negligible effect on surface temperature measurement, we found a nearly linear 5 degree F temperature gradient in the early evening between downtown Phoenix and the countryside 25 miles away.  I can't wait to try this for myself near a USHCN site, say from the Tucson site out to the countryside.

For #2, he has posted two USHCN temperature measurement site surveys here and here.  The fun part for him is that his survey of the Miami, AZ site has already led to a post in response at Climate Audit.  It turns out his survey adds data to an ongoing discussion there about GISS temperature "corrections."

Miami_az_mmts

Out-of-the-mouth-of-babes moment:  My son says, "gee, dad, doesn't that metal building reflect a lot of heat on the thermometer-thing."  You can bet it does.  This is so obvious even a 14-year-old can see it, but don't tell the RealClimate folks who continue to argue that they can adjust the data for station quality without ever seeing the station.

This has been a very good science project, and I would encourage others to try it.  There are lots of US temperature stations left to survey, particularly in the middle of the country.  In a later post I will show you how we did the driving temperature transects of Phoenix.