Posts tagged ‘CRU’

Enshrining Peer Review as Part of the Scientific Method

I have written a lot about problems with over-emphasis on peer review and problems in scientific publishing.  This is from a press release by the CRU quoting the highly flawed Muir-Russel review / whitewash of the Climategate emails.

We note that much of the challenge to CRU’s work has not always followed the conventional scientific method of checking and seeking to falsify conclusions or offering alternative hypotheses for peer review and publication. We believe this is necessary if science is to move on, and we hope that all those involved on all sides of the climate science debate will adopt this approach.

Because methodological challenges to scientists work that don't appear in Climate Journals controlled by the scientists in question are not part of the scientific method.

By the way, the statement that "The raw tree-ring data used in our published work are available; anyone is free to use them in any way they wish" is absolutely hilarious for anyone who has followed this saga over the years.  To the extent they are available "freely," it is only because Steve McIntyre and other challengers of CRU's work engaged in a decade long legal campaign to get this publicly-funded data (necessary to verify and/or replicate the CRU's published work) released.  Here is the McIntyre post to which CRU was responding, though they bend over backwards not to actually mention him.


I Don't Get It

As y'all know, I am not a member of either the Coke or Pepsi party, so I find all the partisan mudslinging on the political blogs to be just kind of funny.  Particularly when both sides are piously accusing the other of exactly the same behavior, while maintaining that they are immune from said behavior  (or only engaging in it because the other guy started it).

I really don't understand political strategy.  I admit this.  Take global warming.  I really thought the CRU email thing was a minor distraction.  After all, the there were so many fundamental flaws in the science and scientific process that a lot of the CRU stuff was old news to those who have paid attention.  But I was wrong.  There was something about the scandal that was more compact and easy to tell, it fit into a box or storyline familiar to both the media that had to report it and the public that had to consume it.  I understood the whole scandal and its impact so poorly that I have done little blogging at my climate site lately, as I still can't get excited blogging about commissions and investigations into the scandal that seem to obsess the skeptic community currently.

So I won't say that this strategy by Kevin Drum is wrong, I will just say I don't understand it:

On Twitter, here was my insta-reaction to Obama's oil spill address from the Oval Office:

What a terrible speech.

Unfair? Maybe! I mean, compared to Sarah Palin's (literally) incomprehensible burbling on Bill O'Reilly's show afterward it was a model of straight talk and reassurance. But that's a pretty low bar.

What's the deal with Sarah Palin?  I swear she gets more pub from her enemies than her supporters.  How does it somehow help a sitting President -- who was supposedly elected because he was the most competent person of all time -- to be compared, however favorably, to a woman with limited political experience who holds no office?  Granted the Republicans really have no one of distinction leading them right now, and Palin is about the only Republican in years with any modicum of charisma.  But since when have losing VP candidates been the standard against which Presidents are measured?

Awesome Analysis of Urban Biases on Surface Temperature Records

A kid and his dad manage to do the analysis that NASA, the EPA, the CRU, and the IPCC can't be convinced to perform.  Awesome.

Incentives and Conspiracies

I am sort of the anti-conspiracy theorist.  I have written a number of times that events people sometimes explain as orchestrated conspiracies often can be explained just as well by assuming that people with similar preferences and similar information and similar incentives will respond to these incentives in similar ways.

I think the great herd-think around climate alarmism is a good example, and the Bishop Hill blog brings us a specific illustration from the comment section of Watts Up With That.  A commenter observed that it was pretty hard to believe that thousands of scientists could be participating in a conspiracy.  Another commenter wrote back:

Actually not so hard.

Personal anecdote:
Last spring when I was shopping around for a new source of funding, after having my funding slashed to zero 15 days after going public with a finding about natural climate variations, I kept running into funding application instructions of the following variety:

Successful candidates will:
1) Demonstrate AGW [ed:  Anthropogenic Global Warming]
2) Demonstrate the catastrophic consequences of AGW.
3) Explore policy implications stemming from 1 & 2.

Follow the money "” perhaps a conspiracy is unnecessary where a carrot will suffice.

If only alarmist results are funded, then it should not be surprising that only alarmist studies are produced.

By the way, it is probably incorrect to think of climate science really being driven by 2500 scientists.  Here is an analogy:  Strategy at General Motors is in some sense driven by thousands of workers - salesmen who know the market, channel managers who know their distribution partners, planners who watch econometric trends, manufacturers who know what can and can't be done with costs, engineers who see what the next technological opportunities, etc. -- you get the idea.

But realistically, there are probably 20-25 people who are really setting and driving and communicating the corporate strategy for GM.  And those 20-25 people will likely say to the public that their strategy is supported by all those 200,000 workers.  But in fact there are thousands, maybe even a majority, that would say that they don't support the strategy and don't think that strategy is consistent with their bit of knowlege.

I think climate science works roughly the same way.  The same 20-25 people are lead authors on the IPCC, write key reports, contribute to Al Gore's movie, get quoted in the NY Times, run the Realclimate web site, and, of course, feature prominently in the CRU emails.  And while these 25 may claim thousands of scientists support their conclusions based on the mere fact that these other scientists contributed to an IPCC report that had these conclusions, many of these scientists, when actually asked, will disagree.

Here is one thing that is never mentioned -- most of the scientists outside of climate science who have gone on the record somewhere as supporting catastrophic man-made global warming theory, if you really talked to them, would say they made their statement in support of science, not global warming theory.  Most of these folks really haven't dug into the details, but the problem was presented to them as one of science vs. anti-science.  They are told by their peers and the media that AGW skeptics are all fundamentalist super right-wing anti-science evolution deniers who think the Earth is 4000 years old.

By saying they support AGW, these scientists are really trying to make the statement that they support science.  The bitter irony is that they are doing the opposite, enabling those in the core of the climate community who are trying to duck criticism and replication by demanding unquestioning respect for their authority.  The fact is that nearly every time one of these outsider scientists - a physicist or a geologist or a statistician, say - digs into the science, they are appalled at what they find and how bad the science behind catastrophic AGW theory really is.

My Personal Experience with Climate Alarmist Spin

We see all kinds of alarmist spin being attempted on the CRU emails.  For those who are interested, this is best layman's article I have found to discuss the now-famous Michael Mann "trick," what it is, and the obfuscation in the CRU's response.

I have at least one experience with the core alarmist community responding where I pointed out an error.  The responses I got in that case are very similar to the ones today for the CRU - basically the responses either are tangential to the basic point or try to retroactively change the alarmists original assertions.  They are responses that stand up only if the questioner is unwilling or unable to do the smallest amount of verification work (in other words, they work with most of the media).

The series of posts began with this image from the recent US government climate assessment.  Its point was to provide electric grid outages as a proxy measurement variable for severe weather, the point being that severe weather must have increased.

electrical-outage

I thought this chart smelled funny

This chart screams one thing at me:  Basis change.  Somehow, the basis for the data is changing in the period.  Either reporting has been increased, or definitions have changed, or there is something about the grid that makes it more sensitive to weather, or whatever  (this is a problem in tornado charts, as improving detection technologies seem to create an upward incidence trend in smaller tornadoes where one probably does not exist).   But there is NO WAY the weather is changing this fast, and readers should treat this whole report as a pile of garbage if it is written by people who uncritically accept this chart.

So I called the owner of the data set at the EIA

He said that there may be an underlying upward trend out there (particularly in thunderstorms) but that most of the increase in this chart is from improvements in data gathering.  In 1997, the EIA (and Makins himself) took over the compilation of this data, which had previously been haphazard, and made a big push to get all utilities to report as required.  They made a second change and push for reporting in 2001, and again in 2007/2008.  He told me that most of this slope is due to better reporting, and not necessarily any underlying trend.   In fact, he said there still is some under-reporting by smaller utilities he wants to improve so that the graph will likely go higher in the future....

At the end of the day, this disturbance data is not a good proxy for severe weather.

The author of that section of the report, Evan Mills, responded and then I dealt with his response here.  Here is just one example of the BS we have to slog through every time we criticize even a tangential analysis like this.  See the links for his whole response, but he says in part:

As noted in the caption to the figure on page 58 of our report (shown above)"”which was masked in the blogger's critique [ed.  actually it was not masked- the source I got the chart from had left off the caption]"”we expressly state a quite different finding than that imputed by the blogger, noting with care that we do not attribute these events to anthropogenic climate change, but do consider the grid vulnerable to extreme weather today and increasingly so as climate change progresses, i.e.:

"Although the figure does not demonstrate a cause-effect relationship between climate change and grid disruption, it does suggest that weather and climate extremes often have important effects on grid disruptions."

The associated text in the report states the following, citing a major peer-reviewed federal study on the energy sector's vulnerability to climate change:

"The electricity grid is also vulnerable to climate change effects, from temperature changes to severe weather events."

This was pretty amazing - citing his chart's caption but hoping that somehow I or other readers would miss the very first line of the caption which he fails to quote:

To Dr. Mills' point that I misinterpreted him "” if all he wanted to say was that the electrical grid could be disturbed by weather or was vulnerable to climate change, fine.  I mean, duh.  If there are more tornadoes knocking about, more electrical lines will come down.  But if that was Dr. Mills ONLY point, then why did he write (emphasis added):

The number of incidents caused by extreme weather has increased tenfold since 1992.  The portion of all events that are caused by weather-related phenomena has more than tripled from about 20 percent in the early 1990s to about 65 percent in recent years.  The weather-related events are more severe"¦

He is saying flat out that the grid IS being disturbed 10x more often and more severely by weather.  It doesn't even say "reported" incidents or "may have" "” it is quite definitive.  So which one of us is trying to create a straw man?   It is these statements that I previously claimed the data did not support, and I stand by my analysis on that.

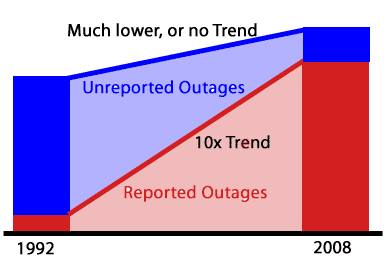
I deconstructed a lot of the rest of his longer post, and you can follow it all, but the bottom line is that if a you are drawing a trend line between two points, and you have much more data missing from the begginning end point than the end, your trend is going to be SNAFU'd.  Period.  No point in arguing about it.  See the chart below.  It represents the situation at hand.  The red is the reported data.  The blue is the unreported data, which declines as a percentage of the total due to a push for better data reporting by the database owners.  My point was simply that the red trend line was meaningless.  Its amazing to me that even accepting the basics of this picture, Dr. Mills wants to fight that conclusion.

trend

I am reminded by one of the now-famous quotes from the CRU emails

I really wish I could be more positive about the Kyrgyzstan material, but I swear I pulled every trick out of my sleeve trying to milk something out of that. I don't think it'd be productive to try and juggle the chronology statistics any more than I already have - they just are what they are...

Yep, sometimes the measured results from nature are what they are.  Well, I actually that most of the time they are what they are, but not in climate apparently.  Never give up a flawed analysis that yields the "right" answer without a fight.  I concluded:

Look Dr. Mills, I don't have an axe to grind here.  This is one chart out of bazillions making a minor point.  But the data set you are using is garbage, so why do you stand by it with such tenacity?  Can't anyone just admit "you know, on thinking about it, there are way to many problems with this data set to declare a trend exists.

Example of Climate Work That Needs to be Checked and Replicated

When someone starts to shout "but its in the peer-reviewed literature" as an argument-ender to me, I usually respond that peer review is not the finish line, meaning that the science of some particular point is settled.  It is merely the starting point, where now a proposition is in the public domain and can be checked and verified and replicated and criticized and potentially disproved or modified.

The CRU scandal should, in my mind, be taken exactly the same way.  Unlike what more fire-breathing skeptics have been saying, this is not the final nail in the coffin of catastrophic man-made global warming theory.  It is merely a starting point, a chance to finally move government funded data and computer code into the public domain where it has always belonged, and start tearing it down or confirming it.

To this end, I would like to share a post from year ago, showing the kind of contortions that skeptics have been going through for years to demonstrate that there appear to be problems in  key data models -- contortions and questions that could have been answered in hours rather than years if the climate scientists hadn't been so afraid of scrutiny and kept their inner workings secret.  This post is from July, 2007.  It is not one of my most core complaints with global warming alarmists, as I think the Earth has indeed warmed over the last 150 years, though perhaps by less than the current metrics say.  But I think some folks are confused why simple averages of global temperatures can be subject to hijinx.  The answer is that the averages are not simple:

A few posts back, I showed how nearly 85% of the reported warming in the US over the last century is actually due to adjustments and added fudge-factors by scientists rather than actual measured higher temperatures.  I want to discuss some further analysis Steve McIntyre has done on these adjustments, but first I want to offer a brief analogy.

Let's say you had two compasses to help you find north, but the compasses are reading incorrectly.  After some investigation, you find that one of the compasses is located next to a strong magnet, which you have good reason to believe is strongly biasing that compass's readings.  In response, would you

  1. Average the results of the two compasses and use this mean to guide you, or
  2. Ignore the output of the poorly sited compass and rely solely on the other unbiased compass?

Most of us would quite rationally choose #2.  However, Steve McIntyre shows us a situation involving two temperature stations in the USHCN network in which government researchers apparently have gone with solution #1.  Here is the situation:

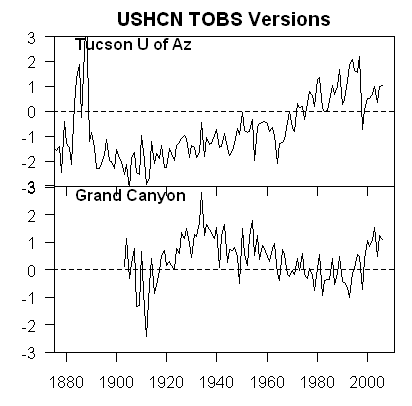
He compares the USHCN station at the Grand Canyon (which appears to be a good rural setting) with the Tucson USHCN station I documented here, located in a parking lot in the center of a rapidly growing million person city.   Unsurprisingly, the Tucson data shows lots of warming and the Grand Canyon data shows none.  So how might you correct Tucson and the Grand Canyon data, assuming they should be seeing about the same amount of warming?  Would you

average them, effectively adjusting the two temperature readings

towards each other, or would you assume the Grand Canyon data is cleaner

with fewer biases and adjust Tucson only?   Is there anyone who would not choose the second option, as with the compasses?

The GISS data set, created by the Goddard Center of NASA, takes the USHCN data set and somehow uses nearby stations to correct for anomalous stations.  I say somehow, because, incredibly, these government scientists, whose research is funded by taxpayers and is being used to make major policy decisions, refuse to release their algorithms or methodology details publicly. They keep it all secret!  Their adjustments are a big black box that none of us are allowed to look into  (and remember, these adjustments account for the vast majority of reported warming in the last century).

We can, however, reverse engineer some of these adjustments, and McIntyre does.  What he finds is that the GISS appears to be averaging the good and bad compass, rather than throwing out or adjusting only the biased reading.  You can see this below.  First, here are the USHCN data for these two stations with only the Time of Observation adjustment made (more on what these adjustments are in this article).
Grand_12

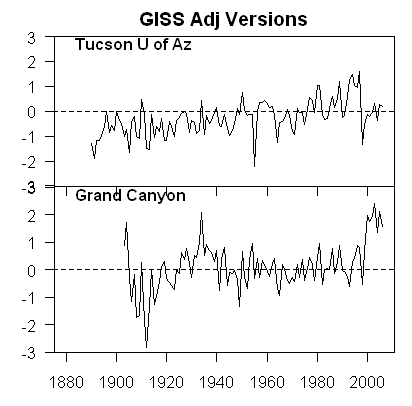
As I said above, no real surprise "“ little warming out in undeveloped nature, lots of warming in a large and rapidly growing modern city.  Now, here is the same data after the GISS has adjusted it:
Grand_15

You can see that Tucson has been adjusted down a degree or two, but Grand Canyon has been adjusted up a degree or two (with the earlier mid-century spike adjusted down).  OK, so it makes sense that Tucson has been adjusted down, though there is a very good argument to be made that it should be been adjusted down more, say by at least 3 degrees**.  But why does the Grand Canyon need to be adjusted up by about a degree and a half?  What is biasing it colder by 1.5 degrees, which is a lot?  The answer:  Nothing.  The explanation:  Obviously, the GISS is doing some sort of averaging, which is bringing the Grand Canyon and Tucson from each end closer to a mean.

This is clearly wrong, like averaging the two compasses.  You don't average a measurement known to be of good quality with one known to be biased.  The Grand Canyon should be held about the same, and Tucson adjusted down even more toward it, or else thrown out.  Lets look at two cases.  In one, we will use the GISS approach to combine these two stations"“ this adds 1.5 degrees to GC and subtracts 1.5 degrees from Tucson.  In the second, we will take an approach that applies all the adjustment to just the biases (Tucson station) "” this would add 0 degrees to GC and subtract 3 degrees from Tucson.  The first approach, used by the GISS, results in a mean warming in these two stations that is 1.5 degrees higher than the more logical second approach. No wonder the GISS produces the highest historical global warming estimates of any source!  Steve McIntyre has much more.

** I got to three degrees by applying all of the adjustments for GC and Tucson to Tucson.  Here is another way to get to about this amount.   We know from studies that urban heat islands can add 8-10 degrees to nighttime urban temperatures over surrounding undeveloped land.  Assuming no daytime effect, which is conservative, we might conclude that 8-10 degrees at night adds about 3 degrees to the entire 24-hour average.

Postscript: Steve McIntyre comments (bold added):

These adjustments are supposed to adjust for station moves "“ the procedure is described in Karl and Williams 1988 [check], but, like so many climate recipes, is a complicated statistical procedure that is not based on statistical procedures known off the island. (That's not to say that the procedures are necessarily wrong, just that the properties of the procedure are not known to statistical civilization.) When I see this particular outcome of the Karl methodology, my mpression is that, net of the pea moving under the thimble, the Grand Canyon values are being blended up and the Tucson values are being blended down. So that while the methodology purports to adjust for station moves, I'm not convinced that the methodology can successfully estimate ex post the impact of numerous station moves and my guess is that it ends up constructing a kind of blended average.

LOL.  McIntyre, by the way, is the same gentleman who helped call foul on the Mann hockey stick for bad statistical procedure.

Useful Reset: What Peer Review Is and Is Not

This is from a post of mine last January, long before the Climategate scandal  (though most of us who spent a lot of time with climate issues knew of the Climategate abuses long before the smoking gun emails were found).  The one thing this article does not mention is what we know today -- that climate scientists were actively working to keep skeptical studies out of the literature, even to the point of getting editors fired.

Peer review is not a guarantee of accuracy or a good housekeeping seal of correctness.  It is a process that insures a work is worthy of publication by a scholarly magazine.  Whether a scientific question is "settled" does not end with peer review, it only begins. It becomes settled after it survives decades of criticism and replication work, a process that was stonewalled by the folks at the CRU, which is really the heart of the scandal.

Yesterday, while I was waiting for my sandwich at the deli downstairs, I was applying about 10% of my consciousness to CNN running on the TV behind the counter.  I saw some woman, presumably in the Obama team, defending some action of the administration being based on "peer reviewed" science.

This may be a legacy of the climate debate.  One of the rhetorical tools climate alarmists have latched onto is to inflate the meaning of peer review.  Often, folks, like the person I saw on TV yesterday, use "peer review" as a synonym for "proven correct and generally accepted in its findings by all right-thinking people who are not anti-scientific wackos."

But in fact peer review has a much narrower function, and certainly is not, either in intent or practice,  any real check or confirmation of the study in question.  The main goals of peer review are:

  • Establish that the article is worthy of publication and consistent with the scope of the publication in question.  They are looking to see if the results are non-trivial, if they are new (ie not duplicative of findings already well-understood), and in some way important.  If you think of peer-reviewers as an ad hoc editorial board for the publication, you get closest to intent
  • Reviewers will check, to the extent they can, to see if the methodology  and its presentation is logical and clear "” not necesarily right, but logical and clear.  Their most frequent comments are for clarification of certain areas of the work or questions that they don't think the authors answered.
  • Peer review is not in any way shape or form a proof that a study is correct, or even likely to be correct.  Enormous numbers of incorrect conclusions have been published in peer-reviewed journals over time.  This is demonstrably true.  For example, at any one time in medicine, for every peer-reviewed study I can usually find another peer-reviewed study with opposite or wildly different findings.
  • Studies are only accepted as likely correct a over time the community tries as hard as it can to poke holes in the findings.  Future studies will try to replicate the findings, or disprove them.  As a result of criticism of the methodology, groups will test the findings in new ways that respond to methodological criticisms.  It is the accretion of this work over time that solidifies confidence  (Ironically, this is exactly the process that climate alarmists want to short-circuit, and even more ironically, they call climate skeptics "anti-scientific" for wanting to follow this typical scientific dispute and replication process).

Further, the quality and sharpness of peer review depends a lot on the reviewers chosen.  For example, a peer review of Rush Limbaugh by the folks at LGF, Free Republic, and Powerline might not be as compelling as a peer review by Kos or Kevin Drum.

But instead of this, peer review is used by folks, particularly in poitical settings, as a shield against criticism, usually for something they don't understand and probably haven't even read themselves.  Here is an example dialog:

Politician or Activist:  "Mann's hockey stick proves humans are warming the planet"

Critic:  "But what about Mann's cherry-picking of proxy groups; or the divergence problem  in the data; or the fact that he routinely uses proxy's as a positive correlation in one period and different correlation in another; or the fact that the results are most driven by proxies that have been manually altered; or the fact that trees really make bad proxies, as they seldom actually display the assumed linear positive relationship between growth and temperature?"

Politician or Activist, who 99% of the time has not even read the study in question and understands nothing of what critic is saying:  "This is peer-reviewed science!  You can't question that."

For those interested in the science of the skeptics position please see my recent movie.

Update: Mark Steyn on Climate and Peer Review

Pretty Good Climategate Summary

From Christopher Booker at the Telegraph via Anthony Watts

There are three threads in particular in the leaked documents which have sent a shock wave through informed observers across the world. Perhaps the most obvious, as lucidly put together by Willis Eschenbach (see McIntyre's blog Climate Audit and Anthony Watt's blog Watts Up With That), is the highly disturbing series of emails which show how Dr Jones and his colleagues have for years been discussing the devious tactics whereby they could avoid releasing their data to outsiders under freedom of information laws.

They have come up with every possible excuse for concealing the background data on which their findings and temperature records were based.

This in itself has become a major scandal, not least Dr Jones's refusal to release the basic data from which the CRU derives its hugely influential temperature record, which culminated last summer in his startling claim that much of the data from all over the world had simply got "lost". Most incriminating of all are the emails in which scientists are advised to delete large chunks of data, which, when this is done after receipt of a freedom of information request, is a criminal offence.

But the question which inevitably arises from this systematic refusal to release their data is "“ what is it that these scientists seem so anxious to hide? The second and most shocking revelation of the leaked documents is how they show the scientists trying to manipulate data through their tortuous computer programmes, always to point in only the one desired direction "“ to lower past temperatures and to "adjust" recent temperatures upwards, in order to convey the impression of an accelerated warming. This comes up so often (not least in the documents relating to computer data in the Harry Read Me file) that it becomes the most disturbing single element of the entire story. This is what Mr McIntyre caught Dr Hansen doing with his GISS temperature record last year (after which Hansen was forced to revise his record), and two further shocking examples have now come to light from Australia and New Zealand.

In each of these countries it has been possible for local scientists to compare the official temperature record with the original data on which it was supposedly based. In each case it is clear that the same trick has been played "“ to turn an essentially flat temperature chart into a graph which shows temperatures steadily rising. And in each case this manipulation was carried out under the influence of the CRU.

What is tragically evident from the Harry Read Me file is the picture it gives of the CRU scientists hopelessly at sea with the complex computer programmes they had devised to contort their data in the approved direction, more than once expressing their own desperation at how difficult it was to get the desired results.

The third shocking revelation of these documents is the ruthless way in which these academics have been determined to silence any expert questioning of the findings they have arrived at by such dubious methods "“ not just by refusing to disclose their basic data but by discrediting and freezing out any scientific journal which dares to publish their critics' work. It seems they are prepared to stop at nothing to stifle scientific debate in this way, not least by ensuring that no dissenting research should find its way into the pages of IPCC reports.

Why the NASA Temperture Adjustments Matter

NASA's GISS was recently forced to restate its historical temperature database for the US when Steve McIntyre (climate gadfly) found discontinuities in the data that seemed to imply a processing error.  Which indeed turned out to be the case (store here).

The importance of this is NOT the actual change to the measurements, though it was substantial.  The importance, which the media reporting on this has entirely missed, is it highlights why NASA and other government-funded climate scientists have got to release their detailed methodologies and software for scrutiny.  The adjustments they are making to historical temperatures are often larger(!) than the measured historical warming (here, here, here) so the adjustment methodology is critical. 

This post from Steve McIntyre really shows how hard government-funded climate scientists like James Hansen are working to avoid scientific scrutiny.  Note the contortions and detective work McIntyre and his readers must go through to try to back into what NASA and Hansen are actually doing.  Read in this context, you should be offended by this article.  Here is an excerpt (don't worry if you can't follow the particular discussion, just get a sense of how hard NASA is making it to replicate their adjustment process):

If I average the data so adjusted, I get the NASA-combined version
up to rounding of 0.05 deg C. Why these particular values are chosen is
a mystery to say the least. Version 1 runs on average a little warmer
than version 0 where they diverge ( and they are identical after 1980).
So why version 0 is adjusted down more than version 1 is hard to figure
out.

Why is version 2 adjusted down prior to 1990 and not after? Again
it's hard to figure out. I'm wondering whether there isn't another
problem in splicing versions as with the USHCN data. One big version of
Hansen's data was put together for Hansen and Lebedeff 1987 and the
next publication was Hansen et al 1999 - maybe different versions got
involved. But that's just a guess. It could be almost anything....It would be interesting to check their source code and see how they get this adjustment, that's for sure.

A basic tenant of science is that you publish enough information such that others can replicate your work.  Hansen and NASA are not doing this, which is all the more insane given that we as taxpayers pay for their work.

Hansen cites the fact that Phil Jones gets somewhat similar results as
evidence of the validity of his calculations. In fairness to Hansen,
while they have not archived code, they have archived enough data
versions to at least get a foothold on what they are doing. In
contrast, Phil Jones at CRU maintains lockdown anti-terrorist security
on his data versions and has even refused FOI requests for his data.
None of these sorts of analyses are possible on CRU data, which may or
may not have problems of its own.