Posts tagged ‘temperature’

Traveling Salesman

The Reference Frame has a video of a dog solving the traveling salesman problem.  I was doing some simulations years ago for a railroad company and actually had a traveling-salesman-like problem to solve with equipment routing.  The best approach I found was simulated annealing.  This algorithm starts out with a totally random solution, and then applies random swaps of route legs and then checks to see if the new route is better or worse than the old route.  So far, similar to any Monte Carlo approach.  But in this algorithm, the solution is allowed to jump to worse solutions, though the size of this jump is reduced over time as the algorithm is run.  This helps prevent the algorithm from getting stuck in local minima.

It is called simulated annealing because it is very parallel to the process of cooling and crystallization in a piece of steel.  When heated steel is plunged into water and cooled quickly, the molecules crystallize and are trapped in a higher energy state, whereas cooling the steel slowly lets the structure stabilize into a much lower energy state.  Metal that is quench cooled is harder but more brittle, metal that is annealed is softer and more ductile.  In the algorithm, the slow reduction in temperature is represented by the declining amount by which the algorithm can jump to a worse solution.

The Critical Flaw with Catastrophic Global Warming Theory

I began with an 85-page book.  I shortened that to a 50-minute film, and then a 9-minute film.  With that experience, I think I can now pull out and summarize in just a few paragraphs why we should not fear catastrophic global warming.  Here goes:

Climate catastrophists often argue that global warming theory is "settled science."  And they are right in one respect:  We have a pretty good understanding of how CO2 can act as a greenhouse gas and cause the earth to warm.  What is well agreed upon, but is not well communicated in the media, is that a doubling of CO2, without other effects that we will discuss in a moment, will heat the earth about 1 degree Celsius (plus or minus a few tenths).  This is not some skeptic's hallucination -- this is straight out of the IPCC third and fourth assessments.  CO2, acting alone, warms the Earth only slowly, and at this rate we would see less than a degree of warming over the next century, more of a nuisance than a catastrophe.

But some scientists do come up with catastrophic warming forecasts.  They do so by assuming that our Earth's climate is dominated by positive feedbacks that multiply the initial warming from CO2 by a factor of three, four, five or more.  This is a key point -- the catastrophe does not come from the science of greenhouse gases, but from separate hypotheses that the earth's climate is dominated by positive feedback.  This is why saying that greenhouse gas theory is "settled" is irrelevant to the
argument about catastrophic forecasts.  Because these positive feedbacks are NOT settled science.  In fact, the IPCC admits it does not even know the sign of the most important effect (water vapor), much less its magnitude.  They assume that the net effect is positive, but they are on very shaky ground doing so, particularly since having long-term stable systems like climate dominated by positive feedback is a highly improbable.

And, in fact, with the 100 or so years of measurements we have for temperature and CO2, empirical evidence does not support these high positive feedbacks.  Even if we assign all the 20th century warming to CO2, which is unlikely, our current warming rates imply close to zero feedback.  If there are other causes for measured 20th century warming other than CO2, thereby reducing the warming we blame on CO2, then the last century's experience implies negative rather than positive feedback in the system.  As a result, it should not be surprising that high feedback-driven forecasts from the 1990 IPCC reports have proven to be way too high vs. actual experience (something the IPCC has since admitted).

However, climate scientists are unwilling to back down from the thin branch they have crawled out on.  Rather than reduce their feedback assumptions to non-catastrophic levels, they currently hypothesize a second man-made cooling effect that is masking all this feedback-driven warming.  They claim now that man-made sulfate aerosols and black carbon are cooling the earth, and when some day these pollutants are reduced, we will see huge catch-up warming.  If anything, this cooling effect is even less understood than feedback.  What we do know is that, unlike CO2, the effects of these aerosols are short-lived and therefore localized, making it unlikely they are providing sufficient masking to make catastrophic forecasts viable.  I go into several reality checks in my videos, but here is a quick one:  Nearly all the man-made cooling aerosols are in the northern hemisphere, meaning that most all the cooling effect should be there -- but the northern hemisphere has actually exhibited most of the world's warming over the past 30 years, while the south has hardly warmed at all.

In sum, to believe catastrophic warming forecasts, one has to believe both of the following:

  1. The climate is dominated by strong positive feedback, despite our experience with other stable systems that says this is unlikely and despite our measurements over the last 100 years that have seen no such feedback levels.
  2. Substantial warming, of 1C or more, is being masked by aerosols, despite the fact that aerosols really only have strong presence over 5-10% of the globe and despite the fact that the cooler part of the world has been the one without the aerosols.

Here's what this means:  Man will cause, at most, about a degree of warming over the next century.  Most of this warming will be concentrated in raising minimum temperatures at night rather than maximum daytime temperatures  (this is why, despite some measured average warming, the US has not seen an increase of late in maximum temperature records set).  There are many reasons to believe that man's actual effect will be less than 1 degree, and that whatever effect we do have will be lost in the natural cyclical variations the climate experiences, but we are only just now starting to understand.

To keep this relatively short, I have left out all the numbers and such.  To see the graphs and numbers and sources, check out my new climate video, or my longer original video, or download my book for free.

UPDATE: Based on a lot of comment activity to this post at its mirror at Climate Skeptic,
I wanted to add a bit of an update.  It is sometimes hard to summarize
without losing important detail, and I think I had that happen here.

Commenters are correct that positive feedback dominated systems can
be stable as long as the feedback percentage is less than 100%.  By
trying to get too compact in my arguments, I combined a couple of
things.  First, there are many catastrophists that argue that climate
IS in fact dominated by feedback over 100% -- anyone who talks of
"tipping points" is effectively saying this.  The argument about
instability making stable processes impossible certainly applies to
these folks' logic.  Further, even positive feedback <100% makes a
system highly subject to dramatic variations.  But Mann et. al. are
already on the record saying that without man, global temperatures are
unbelievably stable and move in extremely narrow ranges.   It is hard
to imagine this to be true in a climate system dominated by positive
feedback, particularly when it is beset all the time with dramatic
perturbations, from volcanoes to the Maunder Minimum.

To some extent, climate catastrophists are in a bind.  If historic
temperatures show a lot of variance, then a strong argument can be made
that a large portion of 20th century warming is natural occilation.  If
historic temperatures move only in narrow ranges, they have a very
difficult time justifying that the climate is dominated by positive
feedbacks of 60-80%.

The point to remember, though, is that irregardless of likelihood,
the historical temperature record simply does not support assumptions
of feedback much larger than zero.  Yes, time delays and lags make a
small difference, but all one has to do is compare current temperatures
to CO2 levels 12-15 years ago to account for this lag and one still
gets absolutely no empirical support for large positive feedbacks.

Remember this when someone says that greenhouse gas theory is
"Settled."  It may or may not be, but the catastrophe does not come
directly from greenhouse gasses.  Alone, they cause at most nuisance
warming.  The catastrophe comes from substantial positive feedback (it
takes 60-80% levels to get climate sensitivities of 3-5C) which is far
from settled science.

Irony Alert

Over at Climate Skeptic, I take a quick look at the most recent Gavin Schmidt PR piece in the Washington Post, claiming that 2007 was, you know, really hot.

But I wanted to share two funny bits with you.  First, from the climate crowd who claims to have their science so buttoned down that we skeptics should not even be allowed to talk about it any more, comes this:

Taking into account the new data, they said, seven of the eight
warmest years on record have occurred since 2001

What new data?  That another YEAR had been discovered?  Because when
I count on my own fingers, I only can come up with 6 years since 2001.

Second, comes this bit of irony:  There are many reasons why satellites gives us a potentially better measure for world temperatures than surface temperature instruments.  They give us full global coverage (except the poles) and are free of urban and other biases.  So I have always wondered if the only reason that climate scientists defend the surface temperature record over satellites is merely because they don't like the answer satellites are giving (they show less warming than do surface temperature records).

But here is the irony:  The person who is arguably the strongest defender of land-based measurement over satellites, and who maintains what neutral observers feel is the most upwardly-biased surface temperature record, is Gavin Schmidt, who is ... wait for it ... head of the Goddard Institute of Space Studies at NASA.

What Happens When You Abandon The Price Mechanism to Allocate Resources

When the government does not allow prices to float in real time in response to changes in supply and demand, then gluts and shortages are inevitable.  When shortages occur, due to prices that are capped or not allowed to move upwards sufficiently quickly, queues and/or spot shortages occur.  When the government decides it does not like this, the jack-booted thugs step in and we have government-enforced rationing.  California, famous for its stupidity in letting wholesale electricity prices float while capping retail prices and thus creating an economic disaster several years ago, is at it again in the electricity market:

What should be controversial in the proposed revisions to Title 24 is
the requirement for what is called a "programmable communicating
thermostat" or PCT. Every new home and every change to existing homes'
central heating and air conditioning systems will required to be fitted
with a PCT beginning next year following the issuance of the revision.
Each PCT will be fitted with a "non-removable " FM receiver that will
allow the power authorities to increase your air conditioning
temperature setpoint or decrease your heater temperature setpoint to
any value they chose. During "price events" those changes are limited
to /- four degrees F and you would be able to manually override the
changes. During "emergency events" the new setpoints can be whatever
the power authority desires and you would not be able to alter them.

In
other words, the temperature of your home will no longer be yours to
control. Your desires and needs can and will be overridden by the state
of California through its public and private utility organizations. All
this is for the common good, of course.

I can't think of anything that better illustrates the tie between free exchange and freedom.  And by the way, how long before the greenies in the legislature suggest using this mechanism even when there are not shortages to turn down everyone's air conditioner, just because they can.

Update: Exercise for the reader -- Figure out how, once this policy goes bad, the state of California will again blame Enron for their failure.

False Sense of Certainty

Over at Climate Skeptic, I dissect the UK Met office's forecast a year ago for 2007 that the mean global temperature anomaly would be .54C and that we were 60% certain to exceed the 1998 record of .52C.  These two points allow me to infer a normal distribution for their forecast, and I find that the actual temperature anomaly for 2007 was in the bottom 0.00003% of the Met office's implied range of outcomes.

The Catastrophe Stems Completely From Feedback

Over at Climate Skeptic, I dissect climate models to show that the future warming in the models from CO2 alone is not much more than 0.5C.  All the catastrophe comes from positive feedbacks that modelers assume dominate the climate, an odd assumption for such a long-term stable system.  I summarize as follows:

  • Climate sensitivity is the temperature increase we might expect with a doubling of CO2 to 560 ppm from a pre-industrial 280ppm
  • Nearly every forecast you have ever seen assumes the
    effect of CO2 alone is about a 1C warming from this doubling.  Clearly,
    though, you have seen higher forecasts.  All of the "extra" warming in
    these forecasts come from positive feedback.  So a sensitivity of 3C
    would be made up of 1C from CO2 directly that is tripled by positive
    feedbacks.  A sensitivity of 6 or 8 still starts with the same 1C but
    has even higher feedbacks
  • Most thoughtful climate scientists will admit that
    we don't know what these feedbacks are -- in so many words, modelers
    are essentially guessing.  Climate scientists don't even know the sign
    (positive or negative) much less the magnitude.  In most physical
    sciences, upon meeting such an unknown system that has been long-term
    stable, scientists will assume neutral to negative feedback.  Climate
    scientists are the exception -- almost all their models assume strong
    positive feedback.
  • Climate scientists point to studies of ice cores and
    such that serve as proxies for climate hundreds of thousands of years
    ago to justify positive feedbacks.  But for the period of history we
    have the best data, ie the last 120 years, actual CO2 and measured
    temperature changes imply a sensitivity net of feedbacks closer to 1C,
    about what a reasonable person would assume from a stable process not
    dominated by positive feedbacks.

Answer: Because the Climate Models Have All Been Fudged

The Question, as asked (surprisingly) by a global warming believer:

One curious aspect of this result is that it
is also well known [Houghton et al., 2001] that the same models that
agree in simulating the anomaly in surface air temperature differ
significantly in their predicted climate sensitivity. The cited range
in climate sensitivity from a wide collection of models is usually 1.5
to 4.5 deg C for a doubling of CO2, where most global climate models
used for climate change studies vary by at least a factor of two in
equilibrium sensitivity.

The question is: if climate models differ by a factor of 2
to 3 in their climate sensitivity, how can they all simulate the global
temperature record with a reasonable degree of accuracy
. Kerr
[2007] and S. E. Schwartz et al. (Quantifying climate change"“too rosy a
picture?, available at www.nature.com/reports/climatechange, 2007)
recently pointed out the importance of understanding the answer to this
question. Indeed, Kerr [2007] referred to the present work and the
current paper provides the "˜"˜widely circulated analysis'' referred to
by Kerr [2007]. This report investigates the most probable explanation
for such an agreement. It uses published results from a wide variety of
model simulations to understand this apparent paradox between model
climate responses for the 20th century, but diverse climate model
sensitivity.

Much more here at Climate Skeptic

The Graft Problem

Over at Climate Skeptic, I discuss the problem of graft.  No, not bribery (though I do have a beef with the industry cabal that supposedly funds all skeptics for not coming through with my check).  In this case, I discuss temperature reconstructions that graft one data series onto another, and try to draw conclusions about the inflection point which, suspiciously, occurs exactly at the spot the two series are spliced.

Let's Emulate India!

Over at Climate Skeptic, we can see Nicholas Stern, former chief economist of the World Bank, argue that the only way to really abate CO2 is for all the world's countries to be just like India.  I kid you not.  And, in fact I agree with him that if we really wanted to eliminate CO2 emissions with current technology, exactly this kind of poverty promotion program would be required.  I just don't think it's necessary that we adopt such a goal. 

As a postscript, I take on Mr. Stern's temperature forecasts of 2.5-3 degree C rise by 2050 and show why they make absolutely no sense in light of the last 100 years of empirical data.

It Really is a Smaller World

Anthony Watt has a pointer to a nice presentation in four parts on YouTube by Bob Carter made at a public forum in Australia.  He walks through some of the skeptics' issues with catastrophic man-made global warming theory.

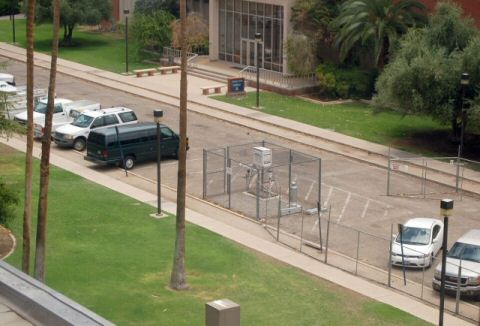
What caught my attention, though, were the pictures Mr. Carter shows in his presentation about about 1:30 into part 4.  Because I took the pictures he shows, down at the University of Arizona, as part of Mr. Watts project to document temperature measurement stations.  Kind of cool to see someone I don't know in a country I have (sadly) never visited using a small bit of my work.  Part 4 is below, but you can find links to all four parts here.

Are Lies OK if They Are "For The Children?"

Over at Climate Skeptic, some investigation by the folks at SPPI have shown that in her new children's climate propaganda book, Laurie David actually reversed the legend on a key chart showing the 600,000 year history of CO2 and temperature.  Recent analysis has shown, and most all scientists accept, that temperature increases actually preceded CO2 increases by 800 or more years in many of the past glacial cycles.  Since this did not fit her story, David reverses the chart legend, making CO2 precede temperature the way David wants it.  Going right to David's cited source, we find:

On page 103 of their book, David and Gordon cite the work of Siegenthaler et al.
(2005), for their written and graphical contention that temperature lags CO2.
However, Siegenthaler et al. clearly state the opposite:

"The
lags of CO2 with respect to the Antarctic temperature over
glacial terminations V to VII are 800, 1600, and 2800 years, respectively, which
are consistent with earlier observations during the last four glacial
cycles
."

(Siegenthaler et al., 2005, Science, vol. 310,
1313-1317)

More, including the graphs themselves, before and after tampering, at climate skeptic.

Duh

From
Megan McArdle
:

Matt may be right that I haven't harangued people about climate change
recently, so here goes: dude, if you're still a climate change skeptic, it's
time for a rethink. When the science correspondent for Reason magazine
comes over to the reality of anthropogenic global warming, it's safe to say that
the skeptics have lost the debate. Not only the vast majority of the scientific
community, but even most of the hard-core skeptics at conservative magazines,
have abandonned the hope that we are not warming up the climate.

There's still debate about the effects of the warming, and what we should do
about it. But there's not much question that it's happening.

Duh.  The vision of the skeptic community denying that the world is
warming at all is a straw man created by the climate catastrophists to avoid
arguing about the much more important point in her second paragraph.  What I
can't understand is McArdle's, and many intelligent people I meet, seeming
unintrest in the degree of man-made impact.

The chief debate really boils down to those of us who think that
climate sensitivity to CO2 is closer to 1C (ie the degrees the world will warm
with a doubling of CO2 concentrations from pre-industrial levels) and those who
think that the sensitivity is 3-5C or more.  The lower sensitivity implies a
warming over the next century of about a half degree C, or about what we saw in
the last century.  The higher numbers represesent an order of magnitude more
warming in the next century.  The lower numbers imply a sea level rise measured
in inches.  The higher numbers imply a rise of 1-2 feet  (No one really know
where Al Gore gets his 20 foot prediction in his movie).  The lower numbers we
might not even notice.  The higher numbers will certainly cause problems.

The other debate is whether the cost of CO2 abatement should even be
considered.  I have talked to many people who say the costs are irrelevant -
Gaia must come first.  But steps to make any kind of dent in CO2 production with
current technologies will have a staggering impact on the world economy.  For
example, there are a billion Asians poised to finally to enter the middle class
who we will likely consign back to poverty with an aggressive CO2 reduction
program.  With such staggering abatement costs, it matters how bad the
effects of man-made global warming will be. 

There are many reasons a 1.0 climate sensivity is far more defensible
than the higher sensitivities used by catastrophists.  My
argument a lower climate sensitivity and therefore a less aggresive posture on
CO2 is here
.  Cross-posted at Climate Skeptic.

Update: Sure, we skeptics debate the degree of past warming, but it really can't be denied the earth is warmer than 100 years ago.  The problem catastrophists have with defending their higher climate sensitivities is that these sensitivities imply that we should have seen much more warming over the past 100 years, as much as 1.5C or more instead of about 0.6C.  These scientists have a tendency to try to restate historical numbers to back their future forecast accuracy.  We skeptics fight them on this, but it does not mean we are trying to deny warming at all, just make sure the science is good as to the magnitude.

One other thought - everyone should keep two words in mind vis a vis CO2 and its effect on temperature:  Diminishing Return.  Each new molecule of CO2 has less impact on temperature than the last one.  Only by positing a lot of weird, unlikely, and unstable positive feedbacks in the climate can scientists reach these higher sensitivity numbers (more here).  A good economist would laugh if they understood the assumptions that were being made in the catastrophic forecasts that are being used to influence government action.

Signal to Noise Ratio in Measurement

Over at Climate Skeptic, I discuss Anthony Watt's preliminary findings as to the quality of measurement in the surface temperature installations that are used to measure global warming.  If we call global warming "the signal", then the signal is currently thought to have been about 0.6C over the last century.  However, Watt has good reason to estimate that 85% of the US Historical Climate Network has installation biases that create errors from 1-5C,or about 2-8 times the signal.  And these are not random biases that cancel out, but tend to all bias the numbers higher, leading to systematic over-estimation of temperature increases.

Does the US Matter?

After NASA was forced to restate its US temperature data downward, James Hansen argued that the US doesn't matter.  After it was observed that long-term temperature measurement is flawed in South America and Africa, James Hansen agreed and argued that South America and Africa don't matter.  Since oceans cover 75% of the globe and we have no long-term temperature record for these oceans or for Antarctica, I ask the question at Climate Skeptic:  What does matter?

Good News: Hansen Releases the Temperature Code

Good news this week:  James Hansen and NASA have now deigned to release for scrutiny their taxpayer-funded temperature aggregation and adjustment code.  I go in more detail and explain why this matters over at Climate Skeptic.

By the way, if you are wondering why I have calmed down a bit on climate of late here at Coyote Blog, it is because I have decided that my climate work really was diluting what I want to do here at Coyote Blog, and it really deserved its own home and audience.  I have begun archiving old posts over at Climate Skeptic, and I will do most of my new posting on climate there.  Those interested in the climate issues are encouraged to bookmark the new site and/or subscribe to its feed.

For a little while, I will still mirror the headlines over here at Coyote Blog (after all, the paint is still so wet over at Climate Skeptic that I don't think Google has found me yet -- a few blogrolls wouldn't hurt, hint, hint.)

Also, in the next few weeks I plan release my own video on issues with catastrophic anthropogenic (man-made) global warming theory.  The core of this video will be based on this skeptics summary post and my 60-second climate overview as well as my free 80-page skeptics primer, of course.

Why I Blog

I had a call today from a reporter at the Christian Science Monitor who wanted to discuss climate skepticism.  What a disaster of an interview I am!  He would ask an open-ended question, and off I would go into feedback theory and then to acoustics and then into helicopter dynamics and back to the ice age and then to temperature measurement in Tucson.  I try to follow 6 trains of thought simultaneously and the result is a mess. 

The poor reporter was quite friendly and ended with "I am not sure where we are going with this story" which is the universal reporter speak for "your interview was such a mess I am not sure how we would ever use it."  LOL.  Only by writing, with the implicit governor applied by the keyboard, am I able to organize my thoughts well.  Which is why I have never invested in a computer dictation product - I shudder to think what I would find on the page after a session.  Which reminds me of the early Doonesbury cartoons with Duke when he was a reporter at the Rolling Stone, when he would come into the his editor's office and claim to have dictated some really powerful stuff, only to find a garbled drug-induced mess, which was obviously a reference to Hunter S. Thompson, who... oh crap, I'm doing it again.

Why the NASA Temperture Adjustments Matter

NASA's GISS was recently forced to restate its historical temperature database for the US when Steve McIntyre (climate gadfly) found discontinuities in the data that seemed to imply a processing error.  Which indeed turned out to be the case (store here).

The importance of this is NOT the actual change to the measurements, though it was substantial.  The importance, which the media reporting on this has entirely missed, is it highlights why NASA and other government-funded climate scientists have got to release their detailed methodologies and software for scrutiny.  The adjustments they are making to historical temperatures are often larger(!) than the measured historical warming (here, here, here) so the adjustment methodology is critical. 

This post from Steve McIntyre really shows how hard government-funded climate scientists like James Hansen are working to avoid scientific scrutiny.  Note the contortions and detective work McIntyre and his readers must go through to try to back into what NASA and Hansen are actually doing.  Read in this context, you should be offended by this article.  Here is an excerpt (don't worry if you can't follow the particular discussion, just get a sense of how hard NASA is making it to replicate their adjustment process):

If I average the data so adjusted, I get the NASA-combined version
up to rounding of 0.05 deg C. Why these particular values are chosen is
a mystery to say the least. Version 1 runs on average a little warmer
than version 0 where they diverge ( and they are identical after 1980).
So why version 0 is adjusted down more than version 1 is hard to figure
out.

Why is version 2 adjusted down prior to 1990 and not after? Again
it's hard to figure out. I'm wondering whether there isn't another
problem in splicing versions as with the USHCN data. One big version of
Hansen's data was put together for Hansen and Lebedeff 1987 and the
next publication was Hansen et al 1999 - maybe different versions got
involved. But that's just a guess. It could be almost anything....It would be interesting to check their source code and see how they get this adjustment, that's for sure.

A basic tenant of science is that you publish enough information such that others can replicate your work.  Hansen and NASA are not doing this, which is all the more insane given that we as taxpayers pay for their work.

Hansen cites the fact that Phil Jones gets somewhat similar results as
evidence of the validity of his calculations. In fairness to Hansen,
while they have not archived code, they have archived enough data
versions to at least get a foothold on what they are doing. In
contrast, Phil Jones at CRU maintains lockdown anti-terrorist security
on his data versions and has even refused FOI requests for his data.
None of these sorts of analyses are possible on CRU data, which may or
may not have problems of its own.

Contributing to Science, Follow-up

My photo survey of the Tucson USHCN climate station is still creating a lot of discussion.  Discussion, for example, is here, here, and here.

And you too can have the satisfaction of contributing to science.  All
you need is a camera (a GPS of some sort is also helpful).  I wrote a
post with instructions on how to find temperature stations near you and how to document them for science here.  Believe it or not, for all the work and money spent on global warming,
this is something that no one had done -- actually go document these
sites to check their quality and potential biases.

Problems With Catastrophic Global Warming Shown in Two Charts

OK, I understand that perhaps my worst flaw in trying to make a point is in being too loquacious.  In a previous post, I showed why estimates of climate catastrophe were overblown by using the earth's experience over the last 100 years as an empirical guide.  Today, I shall try to make the same point with fewer words and just two charts instead.

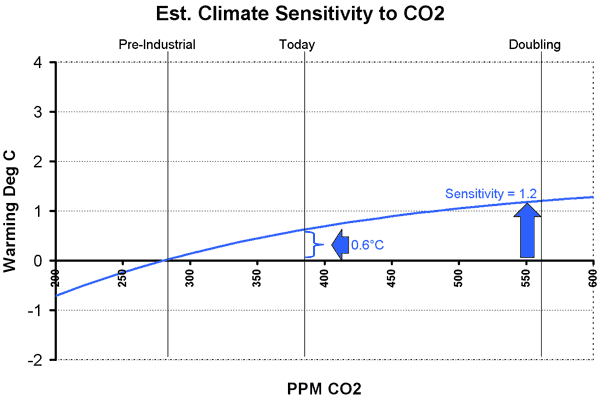
Scientists have a concept called climate sensitivity which refers to the amount of global warming in degrees Celsius we might expect from a doubling of CO2 concentrations from a pre-industrial 280ppm to 560ppm  (we are currently at about 380ppm today and will reach 560ppm between 2065 and 2100, depending on how aggressive a forecast you want to adopt).

A simple way to estimate sensitivity is from experience over the past century.  At the same time CO2 has gone up by 100ppm, global temperatures have gone up by at most 0.6 Celsius (from the 4th IPCC report).  I actually believe this number is over-stated due to uncorrected urban effects and other surface temperature measurement issues, but let's assume 0.6ºC.  Only a part of that 0.6ºC is due to man - some is likely do to natural cyclical effects, but again to avoid argument, let's assume man's CO2 has heated the earth 0.6 Celsius.  From these data points, we can project forward:

Sensitivity1

As you can see, the projection is actually a diminishing curve.  For reasons I will not go into again (you can read much more in my original post) this relationship HAS to be a diminishing curve.  It's a fact accepted by everyone.  True climate consensus.  We can argue about the slope and exact shape, but I have chosen midpoint values from a reasonable range.  The answer is not that sensitive to different assumptions anyway.  Even a linear extrapolation, which is clearly wrong scientifically, would only yield a sensitivity projection a few tenths of a degree higher.

What we arrive at is a sensitivity of about 1.2 degrees Celsius for a CO2 doubling (where the blue line crosses 560ppm).  In other words, we can expect another 0.6ºC increase over the next century, about the same amount we experienced (and most of us failed to notice) over the last century.

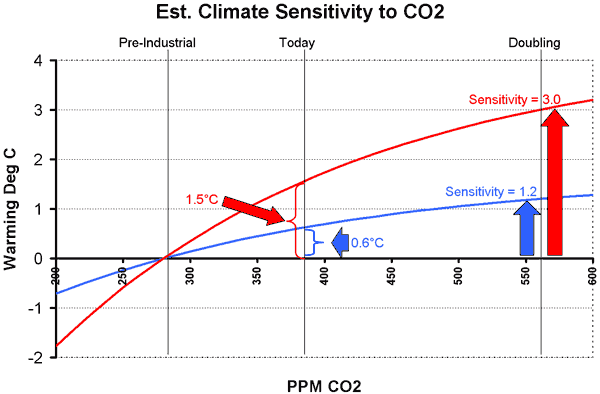
But, you are saying, global warming catastrophists get so much higher numbers.  Yes they do, with warming as high as 9-10C in the next century.  In fact, most global warming catastrophists believe the climate sensitivity is at least 3ºC per doubling, and many use estimates as high as 5ºC or 6ºC.  Do these numbers make sense?  Well, let's draw the same curve for a sensitivity of 3ºC, the low end of the catastrophists' estimates, this time in red:

Sensitivity2

To get a sensitivity of 3.0ºC, one has to assume that global warming due solely to man's CO2 (nothing else) would have to be 1.5ºC to date (where the red line intersects the current concentration of 380ppm).  But no one, not the IPCC or anyone else, believes measured past warming has been anywhere near this high.  So to believe the catastrophic man-made global warming case, you have to accept a sensitivity three or more times higher than historical empirical data would support.  Rather than fighting against climate consensus, which is how we are so often portrayed, skeptics in fact have history and empirical data on our side.  For me, this second chart is the smoking gun of climate skepticism.  We have a lot of other issues -- measurement biases, problems with historical reconstructions, role of the sun, etc -- but this chart highlights the central problem -- that catastrophic warming forecasts make no sense based on the last 100+ years of actual data.

Global warming catastrophists in fact have to argue against historical data, and say it is flawed in two ways:  First, they argue there are positive feedbacks in climate that will take hold in the future and accelerate warming; and second, they argue there are other anthropogenic effects, specifically sulphate aerosols, that are masking man-made warming.  Rather than just repeat myself (and in the interest in proving I can actually be succinct) I will point you to my original post, the second half of which deals in depth with these two issues. 

As always, you can find my Layman's Guide to Skepticism about Man-made Global Warming here.  It is available for free in HTML or pdf download, or you can order the printed book that I sell at cost.  My other recent posts about climate are here.

Reality Checking Global Warming Forecasts

I know I have deluged you with a lot of climate change posts of late.  I think this particular post is important, as it is the clearest single argument I can make as to why I am skeptical that man-made global warming will rise to catastrophic levels.  It is not comprehensive, it took me 80 pages to do that, but it should get anyone thinking.

It turns out to be quite easy to do a simple but fairly robust reality check of global warming forecasts, even without knowing what a "Watt" or a "forcing" is.   Our approach will be entirely empirical, based on the last 100 years of climate history.  I am sensitive that we skeptics not fall into the
9/11 Truther syndrome of arguing against a coherent theory from
isolated anomalies
.  To this end, my approach here is holistic and not
anomaly driven.  What we
will find is that, extrapolating from history, it is almost impossible to get warming numbers as high as those quoted by global warming alarmists.

Climate Sensitivity

The one simple concept you need to understand is "climate sensitivity."  As used in most global warming literature, climate sensitivity is the amount of global warming that results from a doubling in atmospheric CO2 concentrations.   Usually, when this number is presented, it refers to the warming from a doubling of CO2 concentrations since the beginning of the industrial revolution.  The pre-industrial concentration is generally accepted as 280ppm (0.028% of the atmosphere) and the number today is about 380ppm, so a doubling would be to 560ppm.

As a useful, though not required, first step before we begin, I encourage you to read the RealClimate simple "proof" for laymen that the climate sensitivity is 3ºC, meaning the world will warm 3 degrees C with a doubling of CO2 concentrations from their pre-industrial level.  Don't worry if you don't understand the whole description, we are going to do it a different, and I think more compelling, way (climate scientists are a bit like the Wizard of Oz -- they are afraid if they make things too simple someone might doubt they are a real wizard).  3ºC is a common number for sensitivity used by global warming hawks, though it is actually at the low end of the range that the UN IPCC arrived at in their fourth report.  The IPCC (4th report, page 798) said that the expected value is between 3ºC and 4ºC and that there was a greater chance the sensitivity was larger than 6ºC than that it was 1.5ºC or less.  I will show you why I think it is extraordinarily unlikely that the number is greater even than 1.5ºC.

Our Approach

We are going to derive the sensitivity (actually a reasonable range for sensitivity) for ourselves in three steps.  First, we will do it a simple way.  Then, we will do it a slightly harder but more accurate way.  And third, we will see what we would have to assume to get a number anywhere near 3ºC.  Our approach will be entirely empirical, using past changes in CO2 and temperature to estimate sensitivity.  After all, we have measured CO2 going up by about 100 ppm.  That is about 36% of the way towards a doubling from 280 to 560.  And, we have measured temperatures -- and though there are a lot of biases in these temperature measurements, these measurements certainly are better than our guesses, say, of temperatures in the last ice age.  Did you notice something odd, by the way, in the RealClimate derivation?  They never mentioned measured sensitivities in the last 100 years -- they jumped all the way back to the last ice age.  I wonder if there is a reason for that?

A First Approximation

OK, let's do the obvious.  If we have experienced 36% of a doubling, then we should be able to take the historic temperature rise from CO2 for the same period and multiply it by 2.8 (that's just reciprocal of 36%) and derive the temperature increase we would expect for a full doubling.

The problem is that we don't know the historic temperature rise solely form CO2.  But we do know how to bound it.  The IPCC and most global warming hawks place the warming since 1900 at about 0.6ºC.  Since no one attributes warming before 1900 to man-made CO2  (it did warm, but this is attributed to natural cyclical recovery from the little ice age) then the maximum historic man-made warming is 0.6ºC.  In fact, all of that warming is probably not from CO2.  Some probably is from continued cyclical warming out of the little ice age.  Some, I believe strongly, is due to still uncorrected biases, particularly of urban heat islands, in surface temperature data. 

But let's for a moment attribute, unrealistically, all of this 0.6ºC to man-made CO2 (this is in fact what the IPCC does in their report).   This should place an upper bound on the sensitivity number.  Taking 0.6ºC times 2.8 yields an estimated  climate sensitivity of  1.7ºC.  Oops.  This is about half of the RealClimate number or the IPCC number! And if we take a more realistic number for man-made historic warming as 0.4ºC, then we get a sensitivity of 1.1ºC.  Wow, that's a lot lower! We must be missing something important!  It turns out that we are, in this simple analysis, missing something important.  But taking it into account is going to push our sensitivity number even lower.

A Better Approximation

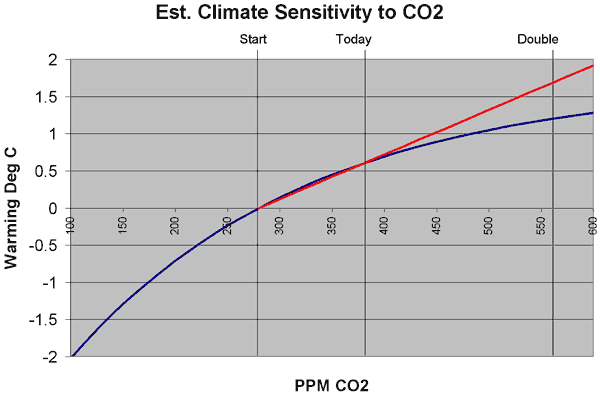
What we are missing is that the relation between CO2 concentration and warming is not linear, as implied in our first approximation.  It is a diminishing return.  This means that the first 50 ppm rise in CO2 concentrations causes more warming than the next 50 ppm, etc.  This effect has often been compared to painting a window.  The first coat of paint blocks out a lot of light, but the window is still translucent.  The next coat blocks out more light, but not as much as the first.  Eventually, subsequent coats have no effect because all the light is already blocked.  CO2 has a similar effect on warming.  It only absorbs certain wavelengths of radiation returning to space from earth.  Once the absorption of those wavelengths is saturated, extra CO2 will do almost nothing. (update:  By the way, this is not some skeptic's fantasy -- everyone in climate accepts this fact).

So what does this mean in English?  Well, in our first approximation, we assumed that 36% of a CO2 doubling would yield 36% of the temperature we would get in a doubling.  But in reality, since the relationship is a diminishing return, the first 36% of a CO2 doubling will yield MORE than 36% of the temperature increase you get for a doubling.  The temperature increase is front-loaded, and diminishes going forward.   An illustration is below, with the linear extrapolation in red and the more realistic decreasing exponential extrapolation in blue.
Sensitivity

The exact shape and equation of this curve is not really known, but we can establish a reasonable range of potential values.  For any reasonable shapes of this curve, 36% of a CO2 doubling (where we are today) equates to from 43% to 63% of the final temperature increase over a doubling.  This would imply that a multiplier between 2.3 and 1.6 for temperature extrapolation  (vs. 2.8 derived above for the straight linear extrapolation above) or a climate sensitivity of 1.4ºC to 1.0ºC if man-made historic warming was 0.6ºC and a range of 0.9ºC to 0.6ºC for a man-made historic warming of 0.4ºC.  I tend to use the middle of this range, with a multiplier of about 1.9 and a man-made historic warming of 0.5ºC to give a expected sensitivity of 0.95ºC, which we can round to 1ºC. 

This is why you will often hear skeptics cite numbers closer to 1ºC rather than 3ºC for the climate sensitivity.   Any reasonable analysis of actual climate experience over the last 100 years yields a sensitivity much closer to 1ºC than 3ºC.  Most studies conducted before the current infatuation with showing cataclysmic warming forecasts came up with this same 1ºC, and peer-reviewed work is still coming up with this same number

So what does this mean for the future?  Well, to predict actual temperature increases from this sensitivity, we would have to first create a CO2 production forecast and, you guessed it, global warming hawks have exaggerated that as well.  The IPCC says we will hit the full doubling to 560ppm around 2065 (Al Gore, incredibly, says we will hit it in the next two decades).  This means that with about 0.5C behind us, and a 3 sensitivity, we can expect 2.5C more warming in the next 60 years.  Multiply that times exaggerated negative effects of warming, and you get instant crisis.

However, since actual CO2 production is already below IPCC forecasts, we might take a more reasonable date of 2080-2100 for a doubling to 560.  And, combining this with our derived sensitivity of 1ºC (rather than RealClimate's 3ºC) we will get 0.5C more warming in the next 75-100 years.  This is about the magnitude of warming we experienced in the last century, and most of us did not even notice.

I know you are scratching you head and wondering what trick I pulled to get numbers so much less than the scientific "consensus."  But there is no trick, all my numbers are empirical and right out of the IPCC reports.  In fact, due to measurement biases and other climate effects that drive warming, I actually think the historic warming from CO2 and thus the sensitivity is even lower, but I didn't want to confuse the message. 

So what are climate change hawks assuming that I have not included?  Well, it turns out they add on two things, neither of which has much empirical evidence behind it.  It is in fact the climate hawks, not the skeptics, that need to argue for a couple of anomalies to try to make their case.

Is Climate Dominated by Positive Feedback?

Many climate scientists argue that there are positive feedbacks in the climate system that tend to magnify and amplify the warming from CO2.  For example, a positive feedback might be that hotter climate melts sea ice and glaciers, which reduces the reflectiveness of the earth's surface, which causes more sunlight to be absorbed, which warms things further.  A negative feedback might be that warmer climate vaporizes more water which forms more clouds which blocks sunlight and cools the earth. 

Climate scientists who are strong proponents of catastrophic man-made warming theory assume that the climate is dominated by positive feedbacks.  In fact, my reading of the IPCC report says that the climate "consensus" is that net feedback in the climate system is positive and tends to add 2 more degrees of temperature for every one added from CO2.  You might be thinking - aha - I see how they got a sensitivity of 3ºC:  Your 1ºC plus 2ºC in feedback equals 3ºC. 

But there is a problem with that.  In fact, there are three problems with this.  Here they are:

  1. We came up with our 1ºC sensitivity empirically.  In other words, we observed a 100ppm past CO2 increase leading to 0.5ºC measured temperature increase which implies 1ºC sensitivity.  But since this is empirical, rather than developed from some set of forcings and computer models, then it should already be net of all feedbacks.  If there are positive feedbacks in the system, then they have been operating and should be part of that 1ºC.
  2. There is no good scientific evidence that there is a large net positive feedback loop in climate, or even that the feedback is net positive at all.  There are various studies, hypotheses, models, etc., but no proof at all.  In fact, you can guess this from our empirical data.  History implies that there can't be any large positive feedbacks in the system or else we would have observed higher temperatures historically.  In fact, we can go back in to the distant historical record (in fact, Al Gore showed the chart I am thinking of in An Inconvenient Truth) and find that temperatures have never run away or exhibited any sort of tipping point effect.
  3. The notion that a system like climate, which has been reasonably stable for millions of years, is dominated by positive feedback should offend the intuition of any scientist.  Nature is dominated in large part by negative feedback processes.  Positive feedback processes are highly unstable, and tend to run away to a distant endpoint.  Nuclear fission, for example, is a positive feedback process

Do aerosols and dimming imply a higher sensitivity?

Finally, the last argument that climate hawks would employ is that anthropogenic effects, specifically emission of SO2 aerosols and carbon black, have been reflecting sunlight and offsetting the global warming effect.  But, they caution, once we eliminate these pollutants, which we have done in the West (only to be offset in China and Asia) temperatures will no longer be suppressed and we will see the full extent of warming.

First, again, no one really has any clue the magnitude of this effect, or even if it is an effect at all.  Second, its reach will tend to be localized over industrial areas (since their presence in the atmosphere is relatively short-lived), whereas CO2 acts worldwide.  If these aerosols and carbon black are concentrated say over 20% of the land surface of the world, this means they are only affecting the temperature over 5% of the total earth' s surface.  So its hard to argue they are that significant.

However, let's say for a moment this effect does exist.  How large would it have to be to argue that a 3.0ºC climate sensitivity is justified by historical data?  Well, taking 3.0ºC and dividing by our derived extrapolation multiplier of 1.9, we get required historic warming due to man's efforts of 1.6ºC.  This means that even if all past 0.6ºC of warming is due to man (a stretch), then aerosols must be suppressing a full 1ºC of warming.   I can't say this is impossible, but it is highly unlikely and certainly absolutely no empirical evidence exists to support any number like this. Particularly since dimming effects probably are localized, you would need as much as 20ºC suppression in these local areas to get a 1ºC global effect.  Not very likely.

Why the number might even be less

Remember that when we calculated sensitivity, we needed the historical warming due to man's CO2.  A simple equation for arriving at this number is:

Warming due to Man's CO2 = Total Historic Measured Warming - Measurement Biases - Warming from other Sources + Warming suppressed by Aerosols

This is why most skeptics care if surface temperature measurements are biased upwards or if the sun is increasing in intensity.  Global warming advocates scoff and say that these effects don't undermine greenhouse gas theory.  And they don't.  I accept greenhouse gases cause some warming.  BUT, the more surface temperature measurements are biased upwards and the more warming is being driven by non-anthropogenic sources, the less that is being caused by man.  And, as you have seen in this post, the less warming caused by man historically means less that we will see in the future.  And while global warming hawks want to paint skeptics as "deniers", we skeptics want to argue the much more interesting question "Yes, but how much is the world warming, and does this amount of warming really justify the costs of abatement, which are enormous."


As always, you can find my Layman's Guide to Skepticism about Man-made Global Warming here.  It is available for free in HTML or pdf download, or you can order the printed book that I sell at cost.  My other recent posts about climate are here.
Um, Whatever

James Hansen, NASA climate scientist and lead singer in the climate apocalypse choir, responded to his  temperature data revisions a week ago:

What we have here is a case of dogged contrarians who
present results in ways intended to deceive the public into believing
that the changes have greater significance than reality. They aim to
make a mountain out of a mole hill. I believe that these people are not
stupid, instead they seek to create a brouhaha and muddy the waters in
the climate change story. They seem to know exactly what they are doing
and believe they can get away with it, because the public does not have
the time, inclination, and training to discern what is a significant
change with regard to the global warming issue.

The proclamations of the contrarians are a deceit

Um, whatever.  Remember, this is the man who had large errors in his data set, used by nearly every climate scientist in the world, for years, and which were only recently discovered by Steven McIntyre (whom Hansen refuses to even name in his letter).  These errors persisted for years because Mr. Hansen refuses to allow the software and algorithms he uses to "correct" and adjust the data to be scrutinized by anyone else.  He keeps critical methodologies that are paid for by we taxpayers a secret.  But it is his critics who are deceitful? 

In particular, he is bent out of shape that critics' first presented the new data as a revised ranking of the hottest years rather than as a revised line graph.  But it was Hansen and his folks who made a big deal in the press that 1998 was the hottest year in history.  It was he that originally went for this sound byte rather than the more meaningful and data-rich graph when communicating with the press.  But then he calls foul when his critics mimic his actions?  (Oh, and by the way, I showed it both ways).

Hansen has completely ignored the important lessons from this experience, while focusing like a laser on the trivial.  I explained in detail why this event mattered, and it was not mainly because of the new numbers.  In short, finding this mistake was pure accident -- it was a bit like inferring that the furniture in a house is uncomfortable solely by watching the posture of visitors leaving the house.  That's quite an deductive achievement, but how much more would you learn if the homeowners would actually let you in the house to inspect the furniture.  Maybe its ugly too.

So why does Hansen feel he should be able to shield himself from scrutiny and keep the details of his database adjustments and aggregation methodology a secret?  Because he thinks he is the king.    Just read his letter:

The contrarians will be remembered as court jesters. There is no point
to joust with court jesters. "¦ Court jesters serve as a distraction, a
distraction from usufruct. Usufruct is the matter that the captains
wish to deny, the matter that they do not want their children to know
about.

Why do we allow this kind of secrecy and spurning of scrutiny in science?  Is it tolerated in any other discipline?

Steve McIntyre has his response here.  McIntyre still has my favorite comment ever about Hansen and his gang:

While acolytes may call these guys "professionals", the process of
data adjustment is really a matter of statistics and even accounting.
In these fields, Hansen and Mann are not "professionals" - Mann
admitted this to the NAS panel explaining that he was "not a
statistician". As someone who has read their works closely, I do not
regard any of these people as "professional". Much of their reluctance
to provide source code for their methodology arises, in my opinion,
because the methods are essentially trivial and they derive a certain
satisfaction out of making things appear more complicated than they
are, a little like the Wizard of Oz. And like the Wizard of Oz, they
are not necessarily bad men, just not very good wizards.

Update:  If you have a minute, read Hansen's letter, and then ask yourself:  Does this sound like what I would expect of scientific discourse?  Does he sound more like a politician or a scientist?

The Next State AG Boondoggle

Chris Horner reports that the next mass-state-AG-tort, modeled after their fairly succesful efforts against tobacco companies, will be against oil companies over global warming:

A little birdie recently chirped about some
usual-suspect state attorneys general preparing a litigation strategy
document for/with environmental pressure groups, providing a roadmap
for cooperatively replicating the tobacco litigation of a decade ago in
the "global warming" context, substituting that projected catastrophe
for cancer and "big energy" for tobacco companies.

The point of
such exercise would not be to litigate the matter to conclusion "” ever
more challenging what with forced corrections of the temperature
record, recent exposure of the woeful reliability of our own world's
most reliable surface measuring network, and of course no global
warming in a decade (or, we now know, since 1900 for that matter) "” but
to extract massive settlements from the energy industry to further fund
the trial lawyers, greens and the greens' pet projects. Just imagine
the anti-energy campaign that this model would yield! And at no cost,
really, except to anyone who uses energy and/or invests in these sleepy
"granny stocks". Oh, and the economy.

He goes on to include a copy of the memo making the rounds of the AG offices.   This will certainly be a circus, and generally an expensive time-waster that will just serve to line the pockets of tort lawyers and the politically connected.  If things turn out like the tobacco settlement, the oil companies may jump on board early, since the tobacco settlement has turned into a state-enforced oligopoly for the major tobacco companies.  On the bright side, this might be an opportunity to subpoena the details of a bunch of climate work that is currently kept secret.

Balanced on the Knife Edge

OK, obviously I am not going to be able to stop posting on climate.  TigerHawk has a nice article on the global cooling panic from the April
28, 1975 issue of Newsweek
. 
However, rather than highlight the fact that climatologists have
reversed themselves on cooling vs. warming, because that sometimes
happens in science, I want to highlight what they described as the
effects of global cooling: 

They begin
by noting the slight drop in over-all temperature that produces large numbers
of pressure centers in the upper atmosphere. These break up the smooth flow of westerly winds over temperate
areas. The stagnant air produced in this
way causes an increase in extremes of local weather such as droughts, floods,
extended dry spells, long freezes, delayed monsoons and even local temperature
increases "“ all of which have a direct impact on food supplies.

So
cooling will cause more droughts, floods, extreme weather, and even
local temperature increases.  And we have been told constantly that
warming
will
cause more droughts, floods, extreme weather, and even local
temperature decreases.  So does this mean that we are currently
balanced on the knife edge of the perfect climate, and any change
cooler or warmer will make it worse?  Or could it be that the
weather-disaster-hype-machine has a defined playbook and these are its
elements?