Posts tagged ‘temperature’

This Shouldn't Be Necessary, But Here Is Some Information on CO2 and Tornadoes

Well, I have zero desire to score political points off the tragedy in Oklahoma, but unfortunately others are more than eager to do so.  As a result, it is necessary to put a few facts on the table to refute the absurd claim that this tornado is somehow attributable to CO2.

  1. I really should not have to say this, but there is no mechanism by which CO2 has ever been accused of causing tornadoes except via the intervening step of warming.  Without warming, CO2 can't be the cause (even with warming, the evidence is weak, since tornadoes are cause more by temperature differentials, than by temperature per se).  So it is worth noting that there have been no unusually warm temperatures in the area of late, and in fact the US has had one of its coolest springs in several decades.
  2. I should also not have to say this, but major tornadoes occurred in Oklahoma at much lower CO2 levels.

    torgraph-big

  3. In fact, if anything the trend in major tornadoes in the US over the last several decades is down
  4. And, this is actually a really, really low tornado year so far.  So its hard to figure an argument that says that global warming reduced tornadoes in general but caused this one in particular

EF3-EF5


Much more at this link

Update:  In 1975, tornado outbreaks blamed in Newsweek on global cooling

Best and the Brightest May Finally Be Open To Considering Lower Climate Sensitivity Numbers

For years, readers of this site know that I have argued that:

  • CO2 is indeed a greenhouse gas, and since man is increasing its atmospheric concentration, there is likely some anthropogenic contribution to warming
  • Most forecasts, including those of the IPCC, grossly exaggerate temperature sensitivity to CO2 by assuming absurd levels of net positive feedback in the climate system
  • Past temperature changes are not consistent with high climate sensitivities

Recently, there have been a whole spate of studies based on actual observations rather than computer models that have been arriving at climate sensitivity numbers far below the IPCC number.   While the IPCC settled on 3C per doubling of CO2, it strongly implied that all the risk was to the upside, and many other prominent folks who typically get fawning attention in the media have proposed much higher numbers.

In fact, recent studies are coming in closer to 1.5C - 2C.  I actually still think these numbers will turn out to be high.  For several years now my money has been on a number from 0.8 to 1 C, sensitivity numbers that imply a small amount of negative feedback rather than positive feedback, a safer choice in my mind since most long-term stable natural systems are dominated by negative feedback.

Anyway, in an article that was as surprising as it is welcome, NY Times climate writer Andy Revkin has quite an article recently, finally acknowledging in the paper of record that maybe those skeptics who have argued for alower sensitivity number kind of sort of have a point.

Worse than we thought” has been one of the most durable phrases lately among those pushing for urgent action to stem the buildup of greenhouse gases linked to global warming.

But on one critically important metric — how hot the planet will get from a doubling of the pre-industrial concentration of greenhouse gases, a k a “climate sensitivity” — someclimate researchers with substantial publication records are shifting toward the lower end of the warming spectrum.

By the way, this is the only metric that matters.  All the other BS about "climate change" and "dirty weather" are meaningless without warming.  CO2 cannot change the climate  or raise sea levels or any of that other stuff by any mechanism we understand or that has even been postulated, except via warming.  Anyway, to continue:

There’s still plenty of global warming and centuries of coastal retreats in the pipeline, so this is hardly a “benign” situation, as some have cast it.

But while plenty of other climate scientists hold firm to the idea that the full range of possible outcomes, including a disruptively dangerous warming of more than 4.5 degrees C. (8 degrees F.), remain in play, it’s getting harder to see why the high-end projections are given much weight.

This is also not a “single-study syndrome” situation, where one outlier research paper is used to cast doubt on a bigger body of work — as Skeptical Science asserted over the weekend. That post focused on the as-yet-unpublished paper finding lower sensitivity that was inadvisedly promoted recently by the Research Council of Norway.

In fact, there is an accumulating body of reviewed, published researchshaving away the high end of the range of possible warming estimates from doubled carbon dioxide levels. Chief among climate scientists critical of the high-sensitivity holdouts is James Annan, an experienced climate modeler based in Japan who contributed to the 2007 science report from the Intergovernmental Panel on Climate Change. By 2006, he was already diverging from his colleagues a bit.

The whole thing is good.  Of course, for Revkin, this is no excuse to slow down all the actions supposedly demanded by global warming, such as substantially raising the price and scarcity of hydrocarbons.  Which to me simply demonstrates that people who have been against hydrocarbons have always been against them as an almost aesthetic choice, and climate change and global warming were mere excuses to push the agenda.  After all, as there certainly are tradeoffs to limiting economic growth and energy use and raising the price of energy, how can a reduction in postulated harms from fossil fuels NOT change the balance point one chooses in managing their use?

PS-  I thought this was a great post mortem on Hurricane Sandy and the whole notion that this one data point proves the global warming trend:

In this case several factors not directly related to climate change converged to generate the event. On Sandy’s way north, it ran into a vast high-pressure system over Canada, which prevented it from continuing in that direction, as hurricanes normally do, and forced it to turn west. Then, because it traveled about 300 miles over open water before making landfall, it piled up an unusually large storm surge. An infrequent jet-stream reversal helped maintain and fuel the storm. As if all that weren’t bad enough, a full moon was occurring, so the moon, the earth, and the sun were in a straight line, increasing the moon’s and sun’s gravitational effects on the tides, thus lifting the high tide even higher. Add to this that the wind and water, though not quite at hurricane levels, struck an area rarely hit by storms of this magnitude so the structures were more vulnerable and a disaster occurred.

The last one is a key for me -- you have cities on the Atlantic Ocean that seemed to build and act as if they were immune from ocean storms.  From my perspective growing up on the gulf coast, where one practically expects any structure one builds on the coast to be swept away every thirty years or so, this is a big contributing factor no one really talks about.

She goes on to say that rising sea levels may have made the storm worse, but I demonstrated that it couldn't have added more than a few percentage points to the surge.

Trusting Experts and Their Models

Russ Roberts over at Cafe Hayek quotes from a Cathy O’Neill review of Nate Silvers recent book:

Silver chooses to focus on individuals working in a tight competition and their motives and individual biases, which he understands and explains well. For him, modeling is a man versus wild type thing, working with your wits in a finite universe to win the chess game.

He spends very little time on the question of how people act inside larger systems, where a given modeler might be more interested in keeping their job or getting a big bonus than in making their model as accurate as possible.

In other words, Silver crafts an argument which ignores politics. This is Silver’s blind spot: in the real world politics often trump accuracy, and accurate mathematical models don’t matter as much as he hopes they would....

My conclusion: Nate Silver is a man who deeply believes in experts, even when the evidence is not good that they have aligned incentives with the public.

Distrust the experts

Call me “asinine,” but I have less faith in the experts than Nate Silver: I don’t want to trust the very people who got us into this mess, while benefitting from it, to also be in charge of cleaning it up. And, being part of the Occupy movement, I obviously think that this is the time for mass movements.

Like Ms. O'Neill, I distrust "authorities" as well, and have a real problem with debates that quickly fall into dueling appeals to authority.  She is focusing here on overt politics, but subtler pressure and signalling are important as well.  For example, since "believing" in climate alarmism in many circles is equated with a sort of positive morality (and being skeptical of such findings equated with being a bad person) there is an underlying peer pressure that is different from overt politics but just as damaging to scientific rigor.  Here is an example from the comments at Judith Curry's blog discussing research on climate sensitivity (which is the temperature response predicted if atmospheric levels of CO2 double).

While many estimates have been made, the consensus value often used is ~3°C. Like the porridge in “The Three Bears”, this value is just right – not so great as to lack credibility, and not so small as to seem benign.

Huybers (2010) showed that the treatment of clouds was the “principal source of uncertainty in models”. Indeed, his Table I shows that whereas the response of the climate system to clouds by various models varied from 0.04 to 0.37 (a wide spread), the variation of net feedback from clouds varied only from 0.49 to 0.73 (a much narrower relative range). He then examined several possible sources of compensation between climate sensitivity and radiative forcing. He concluded:

“Model conditioning need not be restricted to calibration of parameters against observations, but could also include more nebulous adjustment of parameters, for example, to fit expectations, maintain accepted conventions, or increase accord with other model results. These more nebulous adjustments are referred to as ‘tuning’.”  He suggested that one example of possible tuning is that “reported values of climate sensitivity are anchored near the 3±1.5°C range initially suggested by the ad hoc study group on carbon dioxide and climate (1979) and that these were not changed because of a lack of compelling reason to do so”.

Huybers (2010) went on to say:

“More recently reported values of climate sensitivity have not deviated substantially. The implication is that the reported values of climate sensitivity are, in a sense, tuned to maintain accepted convention.”

Translated into simple terms, the implication is that climate modelers have been heavily influenced by the early (1979) estimate that doubling of CO2 from pre-industrial levels would raise global temperatures 3±1.5°C. Modelers have chosen to compensate their widely varying estimates of climate sensitivity by adopting cloud feedback values countering the effect of climate sensitivity, thus keeping the final estimate of temperature rise due to doubling within limits preset in their minds.

There is a LOT of bad behavior out there by models.  I know that to be true because I used to be a modeler myself.  What laymen do not understand is that it is way too easy to tune and tweak and plug models to get a preconceived answer -- and the more complex the model, the easier this is to do in a non-transparent way.  Here is one example, related again to climate sensitivity

When I looked at historic temperature and CO2 levels, it was impossible for me to see how they could be in any way consistent with the high climate sensitivities that were coming out of the IPCC models.  Even if all past warming were attributed to CO2  (a heroic assertion in and of itself) the temperature increases we have seen in the past imply a climate sensitivity closer to 1 rather than 3 or 5 or even 10  (I show this analysis in more depth in this video).

My skepticism was increased when several skeptics pointed out a problem that should have been obvious.  The ten or twelve IPCC climate models all had very different climate sensitivities — how, if they have different climate sensitivities, do they all nearly exactly model past temperatures?  If each embodies a correct model of the climate, and each has a different climate sensitivity, only one (at most) should replicate observed data.  But they all do.  It is like someone saying she has ten clocks all showing a different time but asserting that all are correct (or worse, as the IPCC does, claiming that the average must be the right time).

The answer to this paradox came in a 2007 study by climate modeler Jeffrey Kiehl.  To understand his findings, we need to understand a bit of background on aerosols.  Aerosols are man-made pollutants, mainly combustion products, that are thought to have the effect of cooling the Earth’s climate.

What Kiehl demonstrated was that these aerosols are likely the answer to my old question about how models with high sensitivities are able to accurately model historic temperatures.  When simulating history, scientists add aerosols to their high-sensitivity models in sufficient quantities to cool them to match historic temperatures.  Then, since such aerosols are much easier to eliminate as combustion products than is CO2, they assume these aerosols go away in the future, allowing their models to produce enormous amounts of future warming.

Specifically, when he looked at the climate models used by the IPCC, Kiehl found they all used very different assumptions for aerosol cooling and, most significantly, he found that each of these varying assumptions were exactly what was required to combine with that model’s unique sensitivity assumptions to reproduce historical temperatures.  In my terminology, aerosol cooling was the plug variable.

By the way, this aerosol issue is central to recent work that is pointing to a much lower climate sensitivity to CO2 than has been reported in past IPCC reports.

Sandy and Global Warming

The other day I linked my Forbes column that showed that there was no upward trend in global hurricane number and strength, the number of US hurricane strikes, or the number of October hurricanes.  Given these trends, anyone who wants to claim Sandy is proof of global warming is forced to extrapolate from a single data point.

Since I wrote that, Bob Tisdale had an interesting article on Sandy.  The theoretical link between global warming and more and stronger Atlantic hurricanes has not been fully proven, but the theory says that warmer waters will provide energy for more and larger storms (like Sandy).  Thus the theory is that global warming has heated up the waters through which hurricanes pass and that feed these hurricanes' strength.

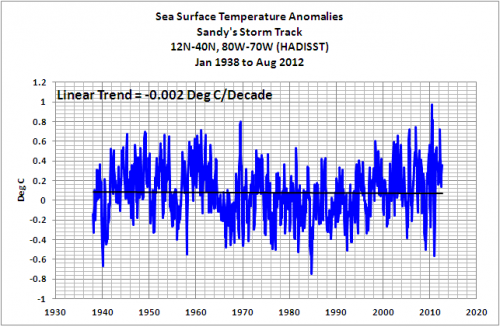
Bob Tisdale took a look at the historical trends in sea surface temperatures in the area bounded by Sandy's storm track.  These are the temperature trends for the waters that fueled Sandy.  This is what he got:

If he has done the analysis right, this means there is no warming trend over the last 60+ years in the ocean waters that fed Sandy.  This means that the unusually warm seas that fed Sandy's growth were simply a random event, an outlier which appears from this chart to be unrelated to any long-term temperature trend.

Update:  I challenge you to find any article arguing that Sandy was caused by anthropogenic global warming that actually includes a long term trend chart (other than global temperatures) in the article.  The only one I have seen is a hurricane strike chart that is cut off in the 1950's (despite data that goes back over 100 years) because this is the only cherry-picked cut off point that delivers an upward trend.  If you find one, email me the link, I would like to see it.

Extrapolating From A Single Data Point: Climate and Sandy

I have a new article up at Forbes on how crazy it is to extrapolate conclusions about the speed and direction of climate change from a single data point.

Positing a trend from a single database without any supporting historical information has become a common media practice in discussing climate.  As I wrote several months ago, the media did the same thing with the hot summer, arguing frequently that this recent hot dry summer proved a trend for extreme temperatures, drought, and forest fires.  In fact, none of these are the case — this summer was not unprecedented on any of these dimensions and no upward trend is detectable in long-term drought or fire data.   Despite a pretty clear history of warming over the last century, it is even hard to establish any trend in high temperature extremes  (in large part because much of the warming has been in warmer night-time lows rather than in daytime highs).  See here for the data.

As I said in that earlier article, when the media posits a trend, demand a trendline, not just a single data point.

To this end, I try to bring so actual trend data to the trend discussion.

I Was Reading Matt Ridley's Lecture at the Royal Society for the Arts....

... and it was fun to see my charts in it!  The lecture is reprinted here (pdf) or here (html).  The charts I did are around pages 6-7 of the pdf, the ones showing the projected curve of global warming for various climate sensitivities, and backing into what that should imply for current warming.  In short, even if you don't think warming in the surface temperature record is exaggerated, there still has not been anywhere near the amount of warming one would expect for the types of higher sensitivities in the IPCC and other climate models.  Warming to date, even if not exaggerated and all attributed to man-made and not natural causes, is consistent with far less catastrophic, and more incremental, future warming numbers.

These charts come right out of the IPCC formula for the relationship between CO2 concentrations and warming, a formula first proposed by Michael Mann.  I explained these charts in depth around the 10 minute mark of this video, and returned to them to make the point about past warming around the 62 minute mark.   This is a shorter video, just three minutes, that covers the same ground.  Watching it again, I am struck by how relevant it is as a critique five years later, and by how depressing it is that this critique still has not penetrated mainstream discussion of climate.  In fact, I am going to embed it below:

The older slides Ridley uses, which are cleaner (I went back and forth on the best way to portray this stuff) can be found here.

By the way, Ridley wrote an awesome piece for Wired more generally about catastrophism which is very much worth a read.

The Real Issue in Climate

I know I hammer this home constantly, but it is often worth a reminder.  The issue in the scientific debate over catastrophic man-made global warming theory is not whether CO2 is a greenhouse gas, or even the approximate magnitude of warming from CO2 directly, but around feedbacks.   Patrick Moore, Greenpeace founder, said it very well:

What most people don't realize, partly because the media never explains it, is that there is no dispute over whether CO2 is a greenhouse gas, and all else being equal would result in a warming of the climate. The fundamental dispute is about water in the atmosphere, either in the form of water vapour (a gas) or clouds (water in liquid form). It is generally accepted that a warmer climate will result in more water evaporating from the land and sea and therefore resulting in a higher level of water in the atmosphere, partly because the warmer the air is the more water it can hold. All of the models used by the IPCC assume that this increase in water vapour will result in a positive feedback in the order of 3-4 times the increase in temperature that would be caused by the increase in CO2 alone.

Many scientists do not agree with this, or do not agree that we know enough about the impact of increased water to predict the outcome. Some scientists believe increased water will have a negative feedback instead, due to increased cloud cover. It all depends on how much, and a t what altitudes, latitudes and times of day that water is in the form of a gas (vapour) or a liquid (clouds). So if  a certain increase in CO2 would theoretically cause a 1.0C increase in temperature, then if water caused a 3-4 times positive feedback the temperature would actually increase by 3-4C. This is why the warming predicted by the models is so large. Whereas if there was a negative feedback of 0.5 times then the temperature would only rise 0.5C.

My slightly lengthier discussions of this same issue are here and here.

Summer of the Shark, Global Warming Edition

My new column is up, comparing coverage of this summer's heat wave to "Summer of the Shark"

Before I discuss the 2012 global warming version of this process, let's take a step back to 2001 and the "Summer of the Shark."  The media hysteria began in early July, when a young boy was bitten by a shark on a beach in Florida.  Subsequent attacks received breathless media coverage, up to and including near-nightly footage from TV helicopters of swimming sharks.  Until the 9/11 attacks, sharks were the third biggest story of the year as measured by the time dedicated to it on the three major broadcast networks' news shows.

Through this coverage, Americans were left with a strong impression that something unusual was happening -- that an unprecedented number of shark attacks were occurring in that year, and the media dedicated endless coverage to speculation by various "experts" as to the cause of this sharp increase in attacks.

Except there was one problem -- there was no sharp increase in attacks.  In the year 2001, five people died in 76 shark attacks.  However, just a year earlier, 12 people had died in 85 attacks.  The data showed that 2001 actually was  a down year for shark attacks.

This summer we have been absolutely bombarded with stories about the summer heat wave in the United States.  The constant drumbeat of this coverage is being jumped on by many as evidence of catastrophic man-made global warming....

What the Summer of the Shark needed, and what this summer’s US heatwave needs, is a little context.  Specifically, if we are going to talk about supposed “trends”, then we should look at the data series in question over time.  So let’s do so.

I go on to present a number of data series on temperatures, temperature maximums, droughts, and fires.   Enjoy.

Global Warming Ate My House

This has already made the rounds but I can't resist mocking an HBS professors whose classes I assiduously avoided when I was there.  Her house was hit by lightning.  Apparently, this was not the fault of poor lightning protection for her house, but was due to your SUV:

I am not a climate change scientist, but I have come to understand that I am a climate change victim. Our daughter took the lead investigating destructive lightning in Maine. She found that the NASA Goddard Institute estimates a 5-6% change in global lightning frequencies for every 1 degree Celsius global warming. The Earth has already warmed .8 degrees Celsius since 1802 and isexpected to warm another 1.1-6.4 degrees by the end of the century. Maine's temperatures rose 1.9 degrees Celsius in the last century and another 2.24 degree rise is projected by 2104. I learned from our insurance company that while the typical thunderstorm produces around 100 lightning strikes, there were 217 strikes around our house that night. I was shocked to discover that when it comes to increased lightning frequency and destructiveness, a NASA study concluded that eastern areas of North America like Maine are especially vulnerable. Scientists confirm a 10% increase in the incidence of extreme weather events in our region since 1949.

This is one of those paragraphs that is so bad, I put off writing about it because I could write a book about all the errors.

  • The 5-6% lightning strike estimate comes from one single study that I have never seen replicated, but more importantly comes from running a computer model.  Though it may exist, I have found no empirical evidence that lightning activity has net increased with increases in temperature
  • The world has warmed about 0.8C over the last century or two. Congrats.  Infinite monkeys and Shakespeare and all that.
  • We could argue the forecasts, but they are irrelevant to this discussion as we are talking about current weather which cannot be influenced by future warming.
  • Her claim that Maine's temperature rose 1.9C in the last Century is simply absurd.  Apparently she got the data from some authoritative place called nextgenerationearth.com, but its impossible to know since in the few days since she published this article that site has taken down the page.  So we will just have to rely on a lesser source like the NOAA for Maine temperatures.  Here story is from 2009 so I used data through 2009

Annual Averages in Maine:

Oops, not a lot of warming here, and certainly not 1.9C.  In fact, there has not even been a single year that has been 1.9C above the average for the century since the early 1900s.  And 2009 was a below average year.
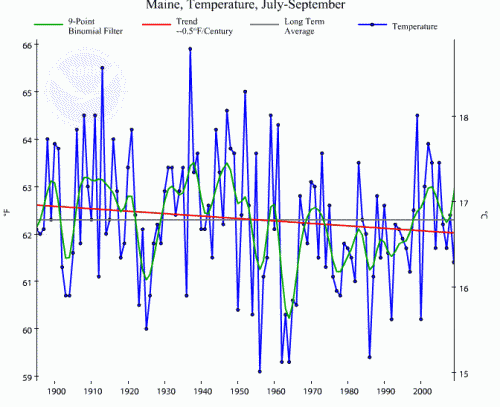
Well, she said it was in summer.  That's when we get the majority of thunderstorms.  Maybe it is just summer warming?  The NOAA does not have a way to get just summer, but I can run average temperatures for July-September of each year, which matches summer within about 8 days.

Whoa!  What's this?  A 0.3-0.4C drop in the last 100 years.   And summer of 2009 (the last data point) was well below average. Wow, I guess cooling causes lightning.  We better do something about that cooling, and fast!  Or else buy this professor some lightning rods.
And you have to love evidence like this

I learned from our insurance company that while the typical thunderstorm produces around 100 lightning strikes, there were 217 strikes around our house that night

What is this, the climate version of the Lake Wobegone Effect?  If all our storms are not below average, then that is proof of climate change.  Is this really how a Harvard professor does statistical analysis?  She can just look at a sample and the mean and determine from that one sample that the mean is shifting?

Finally, she goes on to say that extreme weather in her area is up 10% from some source called the Gulf of Maine Council on Marine Environment.  Well, of course, you can't find that fact anywhere on the source she links.  And besides, even if Maine extreme weather is up, it can't be because of warming because Maine seems to be cooling.

This is just a classic example of the observer bias that is driving the whole "extreme weather" meme.  I will show you what is going on by analogy.  This is from the Wikipedia page on "Summer of the Shark":

The media's fixation with shark attacks began on July 6, when 8-year-old Mississippi boy Jessie Arbogast was bitten by a bull shark while standing in shallow water at Santa Rosa Island's Langdon Beach. ...

Immediately after the near-fatal attack on Arbogast, another attack severed the leg of a New Yorker vacationing in The Bahamas, while a third attack on a surfer occurred about a week later on July 15, six miles from the spot where Arbogast was bitten.[6] In the following weeks, Abrogast's spectacular rescue and survival received extensive coverage in the 24-hour news cycle, which was renewed (and then redoubled) with each subsequent report of a shark incident. The media fixation continued story with a cover story in the July 30th issue of Time magazine.

In mid-August, many networks were showing footage captured by helicopters of hundreds of sharks coalescing off the southwest coast of Florida. Beach-goers were warned of the dangers of swimming,[7] despite the fact that the swarm was likely part of an annual shark migration.[8] The repeated broadcasts of the shark group has been criticized as blatant fear mongering, leading to the unwarranted belief of a so-called shark "epidemic".[8]...

In terms of absolute minutes of television coverage on the three major broadcast networks—ABCCBS, and NBCshark attacks were 2001's third "most important" news story prior toSeptember 11, behind the western United States forest fires, and the political scandal resulting from the Chandra Levy missing persons case.[11] However, the comparatively higher shock value of shark attacks left a lasting impression on the public. According to the International Shark Attack File, there were 76 shark attacks that occurred in 2001, lower than the 85 attacks documented in 2000; furthermore, although 5 people were killed in attacks in 2001, this was less than the 12 deaths caused by shark attacks the previous year.[12]

A trend in news coverage <> a trend in the underlying frequency. If these were correlated, gas prices would only go up and would never come down.

The Missing Heat

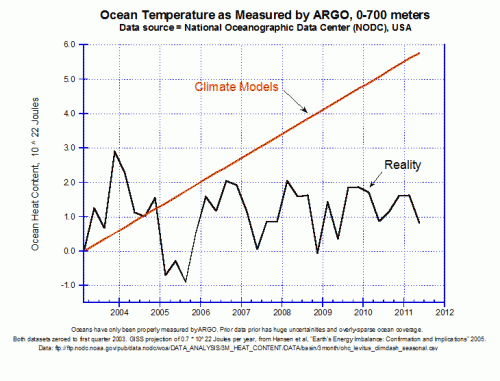
It is possible for the theory that the climate has a high sensitivity to CO2 (ie that a doubling of CO2 concentrations will lead to global temperature increases of 2.5C or higher) to be correct while still having ten years of flat to declining surface temperatures.  That is because Earth's great surface heat reservoir is the oceans, not the atmosphere, and so the extra heat from the greenhouse effect could be going into the oceans rather than into near-surface air.

However, it is NOT possible, as least as we (and by "we" I mean everyone, skeptics and alarmists alike) understand the climate, for CO2 to be holding a lot of extra heat and it not show up either in surface temperatures or ocean heat content.  The greenhouse effect does not turn off -- its effects may be masked in the chaotic weather systems, perhaps for years, but if the climate sensitivity to CO2 is really as high as the IPCC says, there has to be new heat going somewhere.

That is why a number of folks, including Roger Pielke, have argued for years that the best way to monitor whether we are truly seeing an additional forcing or heat input to the climate is to look at ocean heat content.  Understand, changes in ocean heat content would not tell us where the heat is coming from (e.g. anthropogenic CO2 vs. solar activity).  But it is pretty much impossible for us to imagine a new heat input to the Earth's surface, like greenhouse gas forcing from anthropogenic CO2, without observing its effect in ocean heat content.

I will turn over the story to Jo Nova, who has a good post on the new tools we have to measure ocean heat content since 2003.  In short, though, we have seen no rise in measured ocean heat content since we started measuring with technology dedicated to the task.  This means, if those who believe the climate has a high sensitivity to CO2 are right, something like 50,000 quintillion joules of energy have gone missing since 2003.  This is the "missing heat", and though climate scientists sometimes discuss it in private, they almost never do so in public.  Ocean heat is the dinosaur bone fossil that the creationists simply don't want to acknowledge.

Read the whole thing.  It is very simple and well-written and written.

PS- note in the chart above, the y-axis is mis-labelled a bit, it is not absolute heat content but changes in heat content from some base period.  Scientists call this the "anomaly."  This is typical of many climate charts.

Phil Jones Hoping for Warming

I feel the need to reproduce this email in its entirety.  Here is Phil Jones actively hoping the world will warm (an outcome he has publicly stated would be catastrophic).  The tribalism has gotten so intense that it is more important for his alarmist tribe to count coup on the skeptics than to hope for a good outcome for the Earth.

>From: Phil Jones [mailto:p.jones@uea.ac.uk]
>Sent: 05 January 2009 16:18
>To: Johns, Tim; Folland, Chris
>Cc: Smith, Doug; Johns, Tim
>Subject: Re: FW: Temperatures in 2009
>
>
>   Tim, Chris,
>     I hope you're not right about the lack of warming lasting
>   till about 2020. I'd rather hoped to see the earlier Met Office
>   press release with Doug's paper that said something like -
>   half the years to 2014 would exceed the warmest year currently on
> record, 1998!
>     Still a way to go before 2014.
>
>     I seem to be getting an email a week from skeptics saying
>   where's the warming gone. I know the warming is on the decadal
>   scale, but it would be nice to wear their smug grins away.
>
>     Chris - I presume the Met Office
> continually monitor the weather forecasts.
>    Maybe because I'm in my 50s, but the language used in the forecasts seems
>    a bit over the top re the cold. Where I've been for the last 20
> days (in Norfolk)
>    it doesn't seem to have been as cold as the forecasts.
>
>     I've just submitted a paper on the UHI for London - it is 1.6 deg
> C for the LWC.
>   It comes out to 2.6 deg C for night-time minimums. The BBC forecasts has
>   the countryside 5-6 deg C cooler than city centres on recent nights.
> The paper
>   shows the UHI hasn't got any worse since 1901 (based on St James Park
>   and Rothamsted).
>
>   Cheers
>   Phil

Is this better or worse than rooting for a bad economy to get your favorite politicians elected?  Anthony Watt has more in this same tone, showing how climate scientists were working to shift messages and invent new science to protect the warming hypothesis.

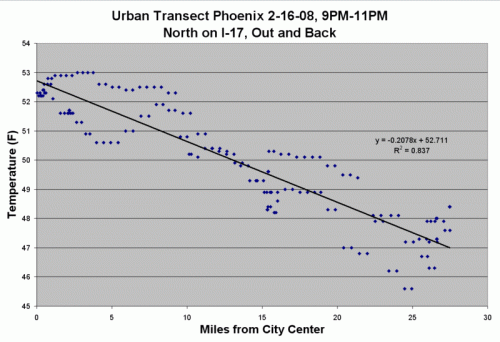
The last part about the UHI (urban heat island) study is interesting.  I don't remember this study.  But it is interesting that he accepts a UHI of as high as 1.6C (my son and I found evening UHI in Phoenix around 4-6C, about in line with his London results).    It looks like he is trying to say that UHI should not matter to temperature measurement, since it has not changed in London since 1900  (a bias in temperature measurement that does not change does not affect the temperature anomaly, which is what tends to be important).  But the point is that many other temperature stations in the Hadley CRUT data base are in cities that are now large today but were much smaller than London in 1900 (Tucson is a great example).  In these cases, there is a changing measurement bias that can affect the anomaly, so I am not sure what Jones was trying to get at.

Update on My Comment Policy: It's Not This

In the Climategate 2.0 emails, Michael Mann confirms what we already knew - there is absolutely no tolerance for dissent, even the scientifically thoughtful sort, among climate alarmists.  Writing about their mother-site, RealClimate, Mann says

 I suspect you've both seen the latest attack against [Keith Briffa's] Yamal work by McIntyre.    Gavin and I (having consulted also w/ Malcolm) are wondering what to make of this, and what sort of response---if any---is necessary and appropriate. So far, we've simply deleted  all of the attempts by McIntyre and his minions to draw attention to this at RealClimate.

Note that the knee-jerk, default action is to purge, hide, and delete criticism, even before it is understood.  They make absolutely no attempt to understand the argument, reading it just enough to know that it is critical and therefore must be deleted.  The second action is to find someone to refute it, again even before the critique is understood.  It is critical of us so it must be wrong.  QED.

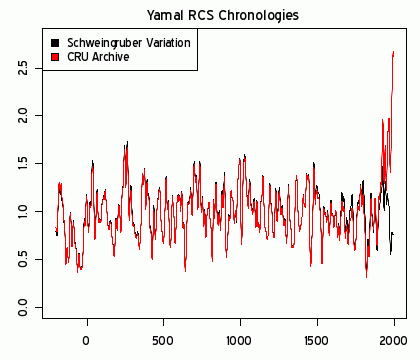
Here is one of the original McIntyre posts where he outlines the problem he found in Briff's work.  He argues that the findings in Briffa are not very robust, as substitution of a larger sample of trees (this is a tree-ring temperature reconstruction study, like the hockey stick) from the same area for Briffa's apparently small, hand-picked sample have an astoundingly large effect on the study's findings (the red study line below, McIntyre's reconstruction in black).

Perhaps McIntyre was missing something (though over the 2 years since no one involved has suggested what that might be).  But the tone of the article is certainly scientific and thoughtful.   It has no resemblance to the unscientific polemic that alarmists often use as an excuse to excise skeptical comments from their web sites.

Stupid Math Tricks

James Hansen, head of NASA's GISS and technical adviser on An Inconvenient Truth, wrote recently

Thus there is no need to equivocate about the summer heat waves in Texas in 2011 and Moscow in 2010, which exceeded 3σ – it is nearly certain that they would not have occurred in the absence of global warming. If global warming is not slowed from its current pace, by mid-century 3σ events will be the new norm and 5σ events will be common.

This statement alone should be enough for any thoughtful person who here-to-fore has bought in to global warming hysteria out of vague respect for "science" to question their beliefs.

First, he is basically arguing that a 3σ event proves (makes it "nearly certain") that some shift has occurred in the underlying process.  In particular, he is arguing that one single sample's value is due to a mean shift in the system.  I don't have a ton of experience in process control and quality, but my gut feel is that a 3σ event can be just that, a 3σ event.  One should expect a 3σ event to occur, on average, once in every 300 samples of a system with a normal distribution of outcomes.

Second, and a much bigger problem, is that Hansen is gaming the sampling process.  First, he is picking an isolated period.  Let's say, to be generous, that this 3σ event stretched over 3 months and was unprecedented in the last century.  But there are 400 3-month periods in the last hundred years.  So he is saying in these two locations there was a 3σ temperature excursion once out of 400 samples.  Uh, ok.  Pretty much what one would expect.

Or, if you don't like the historic approach, lets focus on just this year.  He treats Moscow and Texas like they are the only places being sampled, but in fact they are two of hundreds or even thousands of places on Earth.  Since he does not focus on any of the others, we can assume these are the only two that have so-called 3σ temperature events this summer.

It's hard to know how large to define "Texas"  (since the high temperatures did not cover the whole state) or "Moscow" (since clearly the high temperatures likely reached beyond the suburbs of just that city).

Let's say that the 3σ event occurred in a circular area 500km in diameter.  That is an area of 196,250 sq km each.  But the land surface area of the Earth (we will leave out the oceans for now since heat waves there don't tend to make the headlines) is about 150 million sq km.   This means that each of these areas represent about 1/764th of the land surface area of the Earth.  Or said another way, this summer there were 764 500km diameter land areas we could sample, and 2 had 3σ events.  Again, exactly as expected.

In other words, Hansen's that something unusual is going on in the system is that he found two 3σ events that happened once every 300 or 400 samples.  You feeling better about the science yet?

Luboš Motl has a more sophisticated discussion of the same statement, and gets into other issues with Hansen's statement.

Postscript:  One other issue -- the mean shift in temperatures over the last 30 years has been, at most, about 0.5C  (a small number compared to the Moscow temperature excursion from the norm).  Applying that new mean and the historic standard deviation, my guess is that the Moscow event would have still been a 2.5σ event.  So its not clear how an event that would have been unlikely even with global warming but slightly more unlikely without global warming tells us much of anything about changes in the underlying system, or how Hansen could possible assign blame for the even with near certainty to anthropogenic CO2.

I Don't Think This is Settled

For those who have read my climate work or seen the video, the key question in climate science revolves around the feedback effects in the climate system to Co2 warming.

Skeptics, like alarmists, generally agree that a doubling of Co2 concentrations might warm the Earth about a degree Celsius, absent any other effects.  But we can imagine all sorts of feedback effects, the most important of which are in water vapor and cloud formation.  Warming that forms more clouds might have negative feedback, as clouds offset some of the warming.  Warming that increases humidity could lead to more warming, as water vapor is a strong greenhouse gas.

The difference, then, between minor warming and catastrophe is in the feedbacks, and most importantly in clouds and water vapor.  All the research the government is funding on whether warming will cause sterility in tree frogs is tangential to this key question.

And this question is far from decided.  I won't get into all the arguments here, but to the extent there is any consensus, it is that man' CO2 is probably causing some warming.  Whether this is a catastrophe or a nuisance depends on feedbacks which are not well understood.

This week there has been a lot of interesting back and forth over a paper by Roy Spencer several months ago arguing that cloud feedback was negative and would serve to limit the total amount of man-made warming.  Just how central this issue is can be seen in the fuss this paper has caused, including editors forced to resign for even daring to publish such heresy, and the speed with which a counter-paper flew through peer review.

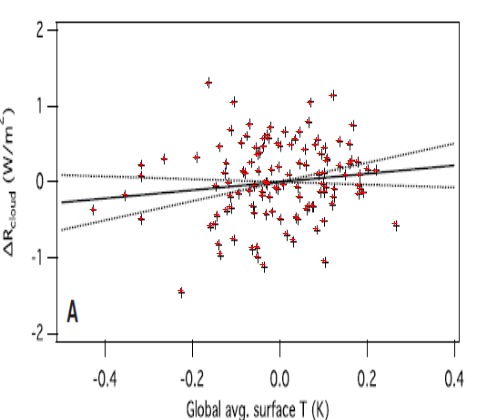
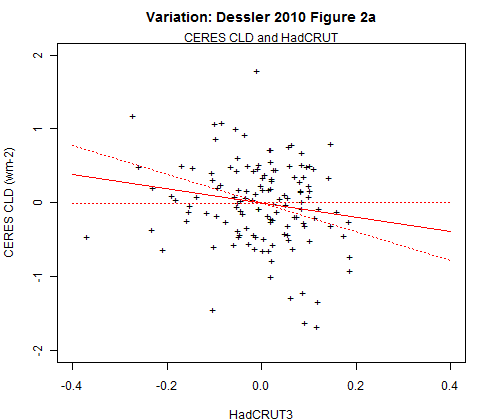
I won't get into the depths of this, except to show two charts.  The first is from Dessler in the alarmist camp, the second is the same chart but using a different data series.  I won't explain the axes,  just trust the relationship between these two variables is key to diagnosing the size and direction of feedback.

So we get opposite results (the slope of the regression) simply by using temperature and radiative flux data from to different agencies.  And note how thin the fit is in both -- basically drawing a line through a cloud.  Neither of these likely has an R-squared higher than about .05.

So there you have it, the most important question in climate - really, the only important question associated with anthropogenic global warming.  Settled science, indeed.

Did CLOUD Just Rain on the Global Warming Parade?

Today in Forbes, I have an article bringing the layman up to speed on Henrik Svensmark and this theory of cosmic ray cloud seeding.  Since his theory helped explain some 20th century warming via natural effects rather than anthropogenic ones, he and fellow researchers have face an uphill climb even getting funding to test his hypothesis.  But today, CERN in Geneva has released study results confirming most of Svensmark's hypothesis, though crucially, it is impossible to infer from this work how much of 20th century temperature changes can be traced to the effect (this is the same problem global warming alarmists face -- CO2 greenhouse warming can be demonstrated in a lab, but its hard to figure out its actual effect in a complex climate system).

From the article:

Much of the debate revolves around the  role of the sun, and though holding opposing positions, both skeptics and alarmists have had good points in the debate.  Skeptics have argued that it is absurd to downplay the role of the sun, as it is the energy source driving the entire climate system.  Michael Mann notwithstanding, there is good evidence that unusually cold periods have been recorded in times of reduced solar activity, and that the warming of the second half of the 20th century has coincided with a series of unusually strong solar cycles.

Global warming advocates have responded, in turn, that while the sun has indeed been more active in the last half of the century, the actual percentage change in solar irradiance is tiny, and hardly seems large enough to explain measured increases in temperatures and ocean heat content.

And thus the debate stood, until a Danish scientist named Henrik Svensmark suggested something outrageous -- that cosmic rays might seed cloud formation.  The implications, if true, had potentially enormous implications for the debate about natural causes of warming.

When the sun is very active, it can be thought of as pushing away cosmic rays from the Earth, reducing their incidence.  When the sun is less active, we see more cosmic rays.  This is fairly well understood.  But if Svensmark was correct, it would mean that periods of high solar output should coincide with reduced cloud formation (due to reduced cosmic race incidence), which in turn would have a warming effect on the Earth, since less sunlight would be reflected back into space before hitting the Earth.

Here was a theory, then, that would increase the theoretical impact on climate of an active sun, and better explain why solar irradiance changes might be underestimating the effect of solar output changes on climate and temperatures.

I go on to discuss the recent CERN CLOUD study and what it has apparently found.

Using Computer Models To Launder Certainty

For a while, I have criticized the practice both in climate and economics of using computer models to increase our apparent certainty about natural phenomenon.   We take shaky assumptions and guesstimates of certain constants and natural variables and plug them into computer models that produce projections with triple-decimal precision.   We then treat the output with a reverence that does not match the quality of the inputs.

I have had trouble explaining this sort of knowledge laundering and finding precisely the right words to explain it.  But this week I have been presented with an excellent example from climate science, courtesy of Roger Pielke, Sr.  This is an excerpt from a recent study trying to figure out if a high climate sensitivity to CO2 can be reconciled with the lack of ocean warming over the last 10 years (bold added).

“Observations of the sea water temperature show that the upper ocean has not warmed since 2003. This is remarkable as it is expected the ocean would store that the lion’s share of the extra heat retained by the Earth due to the increased concentrations of greenhouse gases. The observation that the upper 700 meter of the world ocean have not warmed for the last eight years gives rise to two fundamental questions:

  1. What is the probability that the upper ocean does not warm for eight years as greenhouse gas concentrations continue to rise?
  2. As the heat has not been not stored in the upper ocean over the last eight years, where did it go instead?

These question cannot be answered using observations alone, as the available time series are too short and the data not accurate enough. We therefore used climate model output generated in the ESSENCE project, a collaboration of KNMI and Utrecht University that generated 17 simulations of the climate with the ECHAM5/MPI-OM model to sample the natural variability of the climate system. When compared to the available observations, the model describes the ocean temperature rise and variability well.”

Pielke goes on to deconstruct the study, but just compare the two bolded statements.  First, that there is not sufficiently extensive and accurate observational data to test a hypothesis.  BUT, then we will create a model, and this model is validated against this same observational data.  Then the model is used to draw all kinds of conclusions about the problem being studied.

This is the clearest, simplest example of certainty laundering I have ever seen.  If there is not sufficient data to draw conclusions about how a system operates, then how can there be enough data to validate a computer model which, in code, just embodies a series of hypotheses about how a system operates?

A model is no different than a hypothesis embodied in code.   If I have a hypothesis that the average width of neckties in this year's Armani collection drives stock market prices, creating a computer program that predicts stock market prices falling as ties get thinner does nothing to increase my certainty of this hypothesis  (though it may be enough to get me media attention).  The model is merely a software implementation of my original hypothesis.  In fact, the model likely has to embody even more unproven assumptions than my hypothesis, because in addition to assuming a causal relationship, it also has to be programmed with specific values for this correlation.

This is not just a climate problem.  The White House studies on the effects of the stimulus were absolutely identical.  They had a hypothesis that government deficit spending would increase total economic activity.  After they spent the money, how did they claim success?  Did they measure changes to economic activity through observational data?  No, they had a model that was programmed with the hypothesis that government spending increased job creation, ran the model, and pulled a number out that said, surprise, the stimulus created millions of jobs (despite falling employment).  And the press reported it like it was a real number.

The Dog That Didn't Bark

There may be something interesting coming out in the climate front over the next few weeks from CERN.

Years ago, a researcher named Henrik Svensmark developed a hypothesis that cosmic rays can seed cloud formation, and thus when there are more cosmic rays, there may be more clouds.  This is interesting because it may act as a sort of solar amplification.

Changes in the sun's output through varying solar cycles are measurable, but seem to some scientists to be too small to drive substantial temperature changes on Earth.  But a more active sun tends to blow cosmic rays away from the Earth, thus reducing their incidence.  Therefore, if a more active sun reduced cooling clouds, and a less active sun increased cooling clouds, this might explain a larger effect for the sun.

I have avoided discussing Svensmark much, since the evidence seemed thin, though several labs recently have confirmed his hypothesis, at least in the laboratory.  But Svensmark is definitely a topic among some climate skeptics.  The reason is that higher solar activity levels  in the second half of the twentieth century coincided with much of the 20th century warming that is blamed on manmade CO2.  Svensmark's theory, if true, might force scientists to apportion more of the historic warming to natural causes, thus reducing the estimated sensitivity of the climate to man-made CO2.

But apparently the CERN lab has been undertaking a substantial study to confirm or deny Svensmark's hypothesis.  The results have not been released, but skeptics are beginning to anticipate that CERN's work has confirmed the hypothesis of cosmic ray cloud seeding.  Why?  Because of the dog that did not bark, or rather was told not to bark.

Via Watts Up With That:

CERN Director General Rolf-Dieter Heuer told Welt Online that the scientists should refrain from drawing conclusions from the latest experiment.

“I have asked the colleagues to present the results clearly, but not to interpret them,” reports veteran science editor Nigel Calder on his blog. Why?

Because, Heuer says, “That would go immediately into the highly political arena of the climate change debate. One has to make clear that cosmic radiation is only one of many parameters.”

Skeptics are suggesting that had CERN disproved Svensmark, and thus protected the hypothesis that CO2 is driving most current warming, they would not have hesitated to draw exactly this conclusion in public.  Only a finding considered more consistent with the skeptical position would cause them to go silent, trying to avoid the taint from the politically correct intelligentsia that would come from even partially confirming a skeptic talking point.

I have to agree that Heuer's comments seem to telegraph the result.  I have read a ton of global warming related studies.  And every single one I have read that has ever published negative results vis a vis the hypothesis of catastrophic manmade global warming has felt obligated to put in a sentence at the end that says something like "but of course this does not in any way disprove the hypothesis of anthropogenic global warming and we fully support that hypothesis despite these results."  The absolute fear of becoming an outcast for coming up with the "wrong" result is palpable in reading these papers, sort of like the very careful language a report in Soviet Russia might have used to even mildly criticize some aspect of the state.  Of course, no such disclaimer can be found with narrow positive results - these are always immediately extrapolated  (in fact over-extrapolated in press releases) to be the final nail in the coffin proving once and for all that man is changing the climate in dire ways.

Global Warming Hype Process

Here is the current global warming hype process as it exists today:

  1. Identify a 2 or 3 sigma weather event.  Since there are 365 days in the year and hundreds of different regions in the world, the laws of probability say that some event in the tail of the normal distribution (local high, local low, local flood, local drought, local snow, local tornado, local hurricane, etc) should be regularly occurring somewhere.
  2. Play weather event all over press, closely linked as often as possible with supposition that this is due to manmade CO2.  If the connection to global warming is too outlandish to make with a straight face (e.g. cold weather) use term "climate change" or "climate disruption" instead of global warming.
  3. Skeptics will point to actual data that this event is not part of a long term trend, e.g. there is no rise in tornado activity correlated with 20th century rise in temperatures so blaming one year of high tornadoes on global warming makes no sense.    Ignore this.
  4. Peer reviewed literature will emerge 6-12 months later demonstrating that the event was not likely due to man-made global warming.  Ignore this as well.  Never, ever go back and revisit failed catastrophic predictions.
  5. Repeat

Last year's Russian heat wave is a classic example.  Here is an example of the hype and the tie to man-made global warming in Time.  And here, 12 months later, is the study saying that weather was just weather:

Reference
Dole, R., Hoerling, M., Perlwitz, J., Eischeid, J., Pegion, P., Zhang, T., Quan, X.-W., Xu, T. and Murray, D. 2011. Was there a basis for anticipating the 2010 Russian heat wave? Geophysical Research Letters38: 10.1029/2010GL046582.

Background
The authors write that "the 2010 summer heat wave in western Russia was extraordinary, with the region experiencing the warmest July since at least 1880 and numerous locations setting all-time maximum temperature records." And as a result, they say that "questions of vital societal interest are whether the 2010 Russian heat wave might have been anticipated, and to what extent human-caused greenhouse gas emissions played a role."

What was learned
The nine U.S. researchers determined that "analysis of forced model simulations indicates that neither human influences nor other slowly evolving ocean boundary conditions contributed substantially to the magnitude of the heat wave." In fact, they say that the model simulations provided "evidence that such an intense event could be produced through natural variability alone." Similarly, on the observation front, they state that "July surface temperatures for the region impacted by the 2010 Russian heat wave show no significant warming trend over the prior 130-year period from 1880-2009," noting, in fact, that "a linear trend calculation yields a total temperature change over the 130 years of -0.1°C." In addition, they indicate that "no significant difference exists between July temperatures over western Russia averaged for the last 65 years (1945-2009) versus the prior 65 years (1880-1944)," and they state that "there is also no clear indication of a trend toward increasing warm extremes." Last of all, they say that although there was a slightly higher variability in temperature in the latter period, the increase was "not statistically significant."

Not sure I find the computer model work comforting one way or the other but the complete lack of any observational trend seems compelling.

Digging into the Climate Models

My article this week at Forbes.com digs into some fundamental flaws of climate models

When I looked at historic temperature and CO2 levels, it was impossible for me to see how they could be in any way consistent with the high climate sensitivities that were coming out of the IPCC models.  Even if all past warming were attributed to CO2  (a heroic acertion in and of itself) the temperature increases we have seen in the past imply a climate sensitivity closer to 1 rather than 3 or 5 or even 10  (I show this analysis in more depth in this video).

My skepticism was increased when several skeptics pointed out a problem that should have been obvious.  The ten or twelve IPCC climate models all had very different climate sensitivities — how, if they have different climate sensitivities, do they all nearly exactly model past temperatures?  If each embodies a correct model of the climate, and each has a different climate sensitivity, only one (at most) should replicate observed data.  But they all do.  It is like someone saying she has ten clocks all showing a different time but asserting that all are correct (or worse, as the IPCC does, claiming that the average must be the right time).

The answer to this paradox came in a 2007 study by climate modeler Jeffrey Kiehl.  To understand his findings, we need to understand a bit of background on aerosols.  Aerosols are man-made pollutants, mainly combustion products, that are thought to have the effect of cooling the Earth’s climate.

What Kiehl demonstrated was that these aerosols are likely the answer to my old question about how models with high sensitivities are able to accurately model historic temperatures.  When simulating history, scientists add aerosols to their high-sensitivity models in sufficient quantities to cool them to match historic temperatures.  Then, since such aerosols are much easier to eliminate as combustion products than is CO2, they assume these aerosols go away in the future, allowing their models to produce enormous amounts of future warming.

Specifically, when he looked at the climate models used by the IPCC, Kiehl found they all used very different assumptions for aerosol cooling and, most significantly, he found that each of these varying assumptions were exactly what was required to combine with that model’s unique sensitivity assumptions to reproduce historical temperatures.  In my terminology, aerosol cooling was the plug variable.

Correlation in Political Views

(via Popehat) one of the writers at Balloon Juice offers this test of a "reasonable" Conservative blog

1) Do you believe in evolution?

2) Do you believe that the average temperature on earth has increased over the past 30 years?

A few semi-random thoughts:

  • Count me as a yes for both
  • Is the best test of the likely reasonableness of a political blog really to ask two questions about science that such a blog might never even touch?  This is not an entirely rhetorical question -- just the other day I linked the data that suggested that asking your date about beer might be the best way to test their views on sex.  Sometimes odd cross-correlations exist, but I don't think these would be my first test
  • I find the Left's obsession with evolution as a litmus test for political thought to be funny, as the theory of evolution is largely irrelevant to any political questions except fairly narrowly the question of teaching evolution in schools.   I find it funny as much of the Left does not believe in a science - micro economics (very specifically differentiated from macro) - that is also fairly old and well understood and is much more relevant to typical political blog discourse.  I had a debate on national TV a few weeks ago with a man who claimed, as many on the Left will, that raising the minimum wage will increase employment.   If we want to test blogs based on scientific questions, why wouldn't a far more relevant question in public discourse be "do you believe demand curves slope down" or perhaps something like "do you believe breaking windows stimulates the economy?"
  • The second test is not a bad test of any site writing about global warming and climate change.  I don't know many science-based skeptics who would deny that global temperatures have likely increased over the last 30 years  (from a data base without UHI or alarmist manual adjustments or large data holes, the trend is something like 0.1C per decade).   I say "likely" because it could be argued that 0.1C is within the error bar of the measurement. Even so, this wouldn't be my first test, even for climate sites
  • I would tend to have four tests of the liberal and conservative sites I read
    • Is it interesting to read (after all, this is a freaking unpaid hobby)
    • Is the data-analysis-to-name-calling ratio fairly high
    • Are they willing to step out of team politics and question their own team from time to time
    • Do they have interesting perspectives on individual liberty.  I can plow through Marxist economic posts on progressive sites if from time to time they have a useful perspective on, say, indefinite detentions or gay marriage.  I can plow through some social Conservatism if they have useful posts on economics and fiscal policy.

This post from Nick Gillespie is sort of relevent, in which he talks about CPAC and social conservatives.  One line that struck me

A person's choice of sexual partner in no way means he or she can't be in favor of less spending on farm subsidies.

If I weeded out every blog that held some sort of view with which I disagree (or might even call "unreasonable") I would be down to about 3 blogs in my reader.

Science and Complexity: The Convergence of Climate and Economics

I continue to be fascinated by the similarity between climate science and macro-economics.  Both study unbelievably complex multi-variable systems where we would really like to isolate the effect of one variable.  Because we only have one each of climates and economies  (we can define smaller subsets, but they are always going to be subject to boundary effects from the larger system) it is really hard to define good controlled experiments to isolate single variables.  And all of this is done in a highly charged political environment where certain groups are predisposed to believe their variable is the key element.

In this post by Russ Roberts, one could easily substitute "climate" for "economy" and "temperature" for "unemployment."

Suppose the economy does well this year–growth is robust and unemployment falls. What is the reason for the improvement? Will it be because of the natural rebound of an economy after a downturn that has lasted longer than people thought? The impact of the stimulus finally kicking in? The psychological or real impact of extending the Bush tax cuts? The psychological or real impact of the November election results? The steady hand of Obama at the tiller? All of the above? Can any model of the economy pass the test and answer these questions?

The reason macroeconomics is not a science and not even scientific is that the question I pose above is not answerable. If the economy improves, there will be much talk about the reason. Data and evidence will be trotted out in support of the speaker’s viewpoint. But that is not science. We don’t have a way of distinguishing between those different theories or of giving them weights to measure their independent contribution.

I’m with Arnold Kling. This is a time for humility. It should be at the heart of our discipline. The people who yell the loudest and with the most certainty are the least trustworthy. And the reason for that goes back to Hayek. We can’t measure many of the things we would have to measure to have any reasonable amount of certainty about the chains of connection and causation.

I have heard it said that the only way nowadays to advance pure science is to be working on arcana like the first microsecond of the universe or behavior of the 9th dimension in string theory.   There is still room for a ton of useful work on the analysis, solution, and forecasting of complex multi-variable systems, even if it is just a Goedel-like proof of where the boundaries of our potential understanding can be drawn.

By the way, I wrote my own piece about the limits of macroeconomics here.

WTF?

I obviously need to go out and buy an SUV to reverse this:

Phoenix-area temperatures could drop as low as the mid-20s early Tuesday morning, possibly breaking the record low temperature of 30 degrees set in 1911.

Missing the Point

One aspect of the TSA debate I find hilarious as a libertarian is that we get to see yet another example of partisans switching sides on an issues based on whose team is in the White House.  Since when have Republicans had this deeply held concern about liberty and privacy vs. security against terrorism.  And now leftie Kevin Drum steps up to say that all the extract screening makes sense (to my college roommate Brink Lindsey:  Sorry, but the whole liberaltarian thing is a myth.  When in power, they seem to act just as authoritarian on social and civil rights issues as Conservatives).

Anyway, Drum is certainly not full-bore backing the TSA, but he does write

I hate the TSA screening process. Everyone hates the TSA screening process. You'd be crazy not to. It's intrusive, annoying, and time-wasting. It treats us all like common criminals even though most of us are just ordinary schlubs trying to get on a plane and go somewhere.

But guess what? The fact that you personally are annoyed "” you! an educated white-collar professional! "” doesn't mean that the process is idiotic. I've heard it called "security theater" so many times I'd be rich if I had a nickel for each time it popped up in my browser, but although the anti-TSA rants are often cathartic and amusing, they've never made much sense to me. All the crap that TSA goes through actually seems pretty clearly directed at improving the security of air travel.

The point is not, as implied by Drum, that current TSA screening isn't protection against certain types of threats. Let's be generous and assume that the TSA's screening, generally concocted in a barn-door approach after someone tries a particular approach, is effective at catching the threats it is designed to catch.

The point is that nearly anyone with a room temperature IQ can think of 20 ways to attack an airplane that is not covered by the screening. If there are, say, a hundred imaginable threats, how much privacy do you want to give up to protect yourself from 35 of them?

For example, you know what is in the cargo hold below your seat? The US Mail. You know how much screening is performed on the US Mail? Zero. How hard would it be to wire up a package with a bomb and an altimeter, or perhaps just a noise sensor, and send it off airmail.  They screen the crap out of your bags and body and then throw them on the plane right next to a bunch of anonymous, unscrutinized cargo.  And that is just one example.

Sure-Fire Science Fair Project

In 8th grade, my son won his science fair with this easy and fun project to measure the urban heat island effect around our city.  I know parents and kids alike can struggle to find a good project.  This is one that not only is interesting, but helps to prove the existence of a phenomenon that many climate alarmists work hard to deny.  Imagine a temperature measurement point in downtown Phoenix, which we found to be 7-10F hotter than the outlying areas just 30 miles away.

What did that thermometer read 100 years ago?  How much of measured global warming is due to this effect, particularly since our airport, the typical place where temperature records are based for large cities, is right in the center of town?

Anyway, we had to kluge together some stuff to make this work, but the Weather Shop now offers a simple kit. The site suggests keeping track of position in a log vs. time, which is what we did the first time and works just fine.  However, the second time through, we got fancy and also had a GPS logger.

Room Temperature Ice

Some scientists claim to be able to make room temperature ice (yes, I presume at 1 atm pressure).  Not sure what to make of it:

Earth's climate is strongly influenced by the presence of particles of different shapes and origins "” in the form of dust, ice and pollutants "” that find their way into the lowest portion of the atmosphere, the troposphere. There, water adsorbed on the surface of these particles can freeze at higher temperatures than pure water droplets, triggering rain and snow.Researchers at Spain's Centre d'Investigació en Nanociència i Nanotecnologia (CIN2) have studied the underlying mechanisms of water condensation in the troposphere and found a way to make artificial materials to control water condensation and trigger ice formation at room temperature. Described in the Journal of Chemical Physics, which is published by the American Institute of Physics, their work may lead to new additives for snowmaking, improved freezer systems, or new coatings that help grow ice for skating rinks.

The next step? The researchers' goal now is to produce environmentally-friendly synthetic materials for efficiently inducing snow. "If water condenses in an ordered way, such as a hexagonal structure, on such surfaces at ambient conditions, the term "˜room temperature ice' would be fully justified," adds Verdaguer. "The solid phase, ice, would be produced by a surface effect rather than as a consequence of temperature. In the long term, we intend to prepare smart materials, "˜intelligent surfaces,' that will react to water in a predefined way."

I remember some work on how water boiling could be suppressed by polishing surfaces where bubbles form (watch a pot of water boiling, the bubbles appear on the pan surfaces).  I presume this may be a related effect.