Posts tagged ‘PDO’

What is Normal?

I titled my very first climate video "What is Normal," alluding to the fact that climate doomsayers argue that we have shifted aspects of the climate (temperature, hurricanes, etc.) from "normal" without us even having enough historical perspective to say what "normal" is.

A more sophisticated way to restate this same point would be to say that natural phenomenon tend to show various periodicities, and without observing nature through the whole of these cycles, it is easy to mistake short term cyclical variations for long-term trends.

A paper in the journal Water Resources Research makes just this point using over 200 years of precipitation data:

We analyze long-term fluctuations of rainfall extremes in 268 years of daily observations (Padova, Italy, 1725-2006), to our knowledge the longest existing instrumental time series of its kind. We identify multidecadal oscillations in extremes estimated by fitting the GEV distribution, with approximate periodicities of about 17-21 years, 30-38 years, 49-68 years, 85-94 years, and 145-172 years. The amplitudes of these oscillations far exceed the changes associated with the observed trend in intensity. This finding implies that, even if climatic trends are absent or negligible, rainfall and its extremes exhibit an apparent non-stationarity if analyzed over time intervals shorter than the longest periodicity in the data (about 170 years for the case analyzed here). These results suggest that, because long-term periodicities may likely be present elsewhere, in the absence of observational time series with length comparable to such periodicities (possibly exceeding one century), past observations cannot be considered to be representative of future extremes. We also find that observed fluctuations in extreme events in Padova are linked to the North Atlantic Oscillation: increases in the NAO Index are on average associated with an intensification of daily extreme rainfall events. This link with the NAO global pattern is highly suggestive of implications of general relevance: long-term fluctuations in rainfall extremes connected with large-scale oscillating atmospheric patterns are likely to be widely present, and undermine the very basic idea of using a single stationary distribution to infer future extremes from past observations.

Trying to work with data series that are too short is simply a fact of life -- everyone in climate would love a 1000-year detailed data set, but we don't have it.  We use what we have, but it is important to understand the limitations.  There is less excuse for the media that likes to use single data points, e.g. one storm, to "prove" long term climate trends.

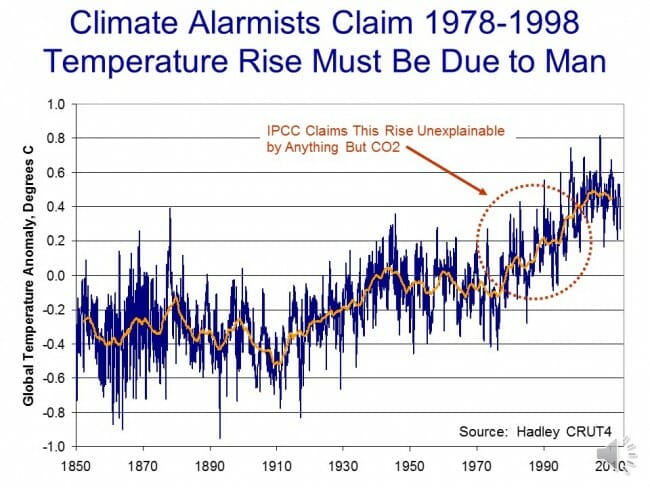
A good example of why this is relevant is the global temperature trend.  This chart is a year or so old and has not been updated in that time, but it shows the global temperature trend using the most popular surface temperature data set.  The global warming movement really got fired up around 1998, at the end of the twenty year temperature trend circled in red.

click to enlarge


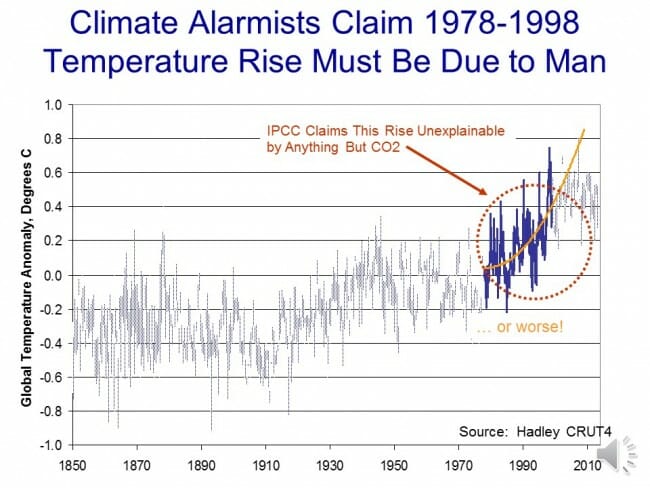
They then took the trends from these 20 years and extrapolated them into the future:

click to enlarge

But what if that 20 years was merely the upward leg of a 40-60 year cyclic variation?  Ignoring the cyclic functions would cause one to overestimate the long term trend.  This is exactly what climate models do, ignoring important cyclic functions like the AMO and PDO.

In fact, you can get a very good fit with actual temperature by modeling them as three functions:  A 63-year sine wave, a 0.4C per century long-term linear trend  (e.g. recovery from the little ice age) and a new trend starting in 1945 of an additional 0.35C, possibly from manmade CO2.Slide52
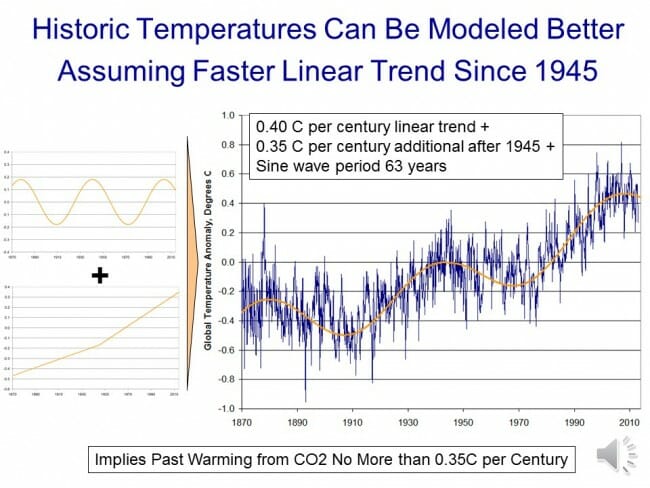
In this case, a long-term trend still appears to exist but it is exaggerated by only trying to measure it in the upward part of the cycle (e.g. from 1978-1998).
 

Update On My Climate Model (Spoiler: It's Doing a Lot Better than the Pros)

In this post, I want to discuss my just-for-fun model of global temperatures I developed 6 years ago.  But more importantly, I am going to come back to some lessons about natural climate drivers and historic temperature trends that should have great relevance to the upcoming IPCC report.

In 2007, for my first climate video, I created an admittedly simplistic model of global temperatures.  I did not try to model any details within the climate system.  Instead, I attempted to tease out a very few (it ended up being three) trends from the historic temperature data and simply projected them forward.  Each of these trends has a logic grounded in physical processes, but the values I used were pure regression rather than any bottom up calculation from physics.  Here they are:

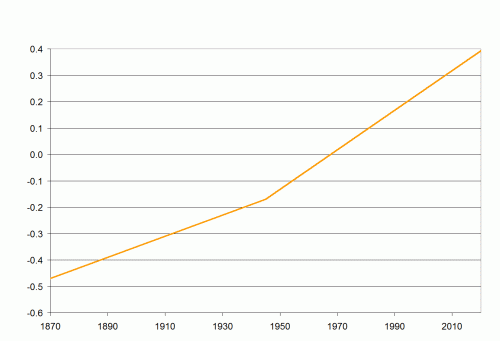
  • A long term trend of 0.4C warming per century.  This can be thought of as a sort of base natural rate for the post-little ice age era.
  • An additional linear trend beginning in 1945 of an additional 0.35C per century.  This represents combined effects of CO2 (whose effects should largely appear after mid-century) and higher solar activity in the second half of the 20th century  (Note that this is way, way below the mainstream estimates in the IPCC of the historic contribution of CO2, as it implies the maximum historic contribution is less than 0.2C)
  • A cyclic trend that looks like a sine wave centered on zero (such that over time it adds nothing to the long term trend) with a period of about 63 years.  Think of this as representing the net effect of cyclical climate processes such as the PDO and AMO.

Put in graphical form, here are these three drivers (the left axis in both is degrees C, re-centered to match the centering of Hadley CRUT4 temperature anomalies).  The two linear trends (click on any image in this post to enlarge it)

click to enlarge


And the cyclic trend:

click to enlarge

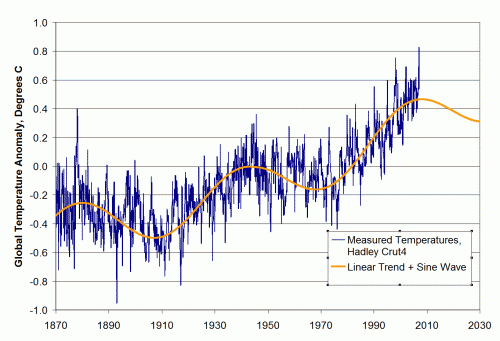
These two charts are simply added and then can be compared to actual temperatures.  This is the way the comparison looked in 2007 when I first created this "model"

click to enlarge

The historic match is no great feat.  The model was admittedly tuned to match history (yes, unlike the pros who all tune their models, I admit it).  The linear trends as well as the sine wave period and amplitude were adjusted to make the fit work.

However, it is instructive to note that a simple model of a linear trend plus sine wave matches history so well, particularly since it assumes such a small contribution from CO2 (yet matches history well) and since in prior IPCC reports, the IPCC and most modelers simply refused to include cyclic functions like AMO and PDO in their models.  You will note that the Coyote Climate Model was projecting a flattening, even a decrease in temperatures when everyone else in the climate community was projecting that blue temperature line heading up and to the right.

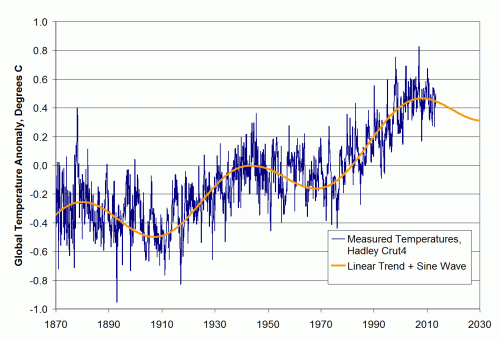
So, how are we doing?  I never really meant the model to have predictive power.  I built it just to make some points about the potential role of cyclic functions in the historic temperature trend.  But based on updated Hadley CRUT4 data through July, 2013, this is how we are doing:

click to enlarge


Not too shabby.  Anyway, I do not insist on the model, but I do want to come back to a few points about temperature modeling and cyclic climate processes in light of the new IPCC report coming soon.

The decisions of climate modelers do not always make sense or seem consistent.  The best framework I can find for explaining their choices is to hypothesize that every choice is driven by trying to make the forecast future temperature increase as large as possible.  In past IPCC reports, modelers refused to acknowledge any natural or cyclic effects on global temperatures, and actually made statements that a) variations in the sun's output were too small to change temperatures in any measurable way and b) it was not necessary to include cyclic processes like the PDO and AMO in their climate models.

I do not know why these decisions were made, but they had the effect of maximizing the amount of past warming that could be attributed to CO2, thus maximizing potential climate sensitivity numbers and future warming forecasts.  The reason for this was that the IPCC based nearly the totality of their conclusions about past warming rates and CO2 from the period 1978-1998.  They may talk about "since 1950", but you can see from the chart above that all of the warming since 1950 actually happened in that narrow 20 year window.  During that 20-year window, though, solar activity, the PDO and the AMO were also all peaking or in their warm phases.  So if the IPCC were to acknowledge that any of those natural effects had any influence on temperatures, they would have to reduce the amount of warming scored to CO2 between 1978 and 1998 and thus their large future warming forecasts would have become even harder to justify.

Now, fast forward to today.  Global temperatures have been flat since about 1998, or for about 15 years or so.  This is difficult to explain for the IPCC, since about none of the 60+ models in their ensembles predicted this kind of pause in warming.  In fact, temperature trends over the last 15 years have fallen below the 95% confidence level of nearly every climate model used by the IPCC.  So scientists must either change their models (eek!) or else they must explain why they still are correct but missed the last 15 years of flat temperatures.

The IPCC is likely to take the latter course.  Rumor has it that they will attribute the warming pause to... ocean cycles and the sun (those things the IPCC said last time were irrelevant).  As you can see from my model above, this is entirely plausible.  My model has an underlying 0.75C per century trend after 1945, but even with this trend actual temperatures hit a 30-year flat spot after the year 2000.   So it is entirely possible for an underlying trend to be temporarily masked by cyclical factors.

BUT.  And this is a big but.  You can also see from my model that you can't assume that these factors caused the current "pause" in warming without also acknowledging that they contributed to the warming from 1978-1998, something the IPCC seems loath to do.  I do not know how the ICC is going to deal with this.  I hate to think the worst of people, but I do not think it is beyond them to say that these factors offset greenhouse warming for the last 15 years but did not increase warming the 20 years before that.

We shall see.  To be continued....

Update:  Seriously, on a relative basis, I am kicking ass

click to enlarge

Real Climate Change We Might Want to Worry About

The sun follows an (approximately) 11-year cycle as sunspots ebb and flow.  The peak of these cycles, ie the number of sunspots at the cycle's maximum, is thought to correlate with the strength of the sun's output.  In the past, periods with very low sunspot activity through an entire cycle have correlated with very cold temperatures (e.g. the Maunder Minimum and the Little Ice Age).

Well, NASA has updated its forecast for this cycle and it does not look good:

Current prediction for the next sunspot cycle maximum gives a smoothed sunspot number maximum of about 62 in July of 2013. We are currently over two years into Cycle 24. The predicted size would make this the smallest sunspot cycle in nearly 200 years.

The low cycle 200 years ago coincided with a decade or more of wicked-cold temperatures, particularly in Northern Europe  (think Napoleon's army freezing to death in 1812).

One of the reasons this probably has not gotten much coverage is that climate scientists have worked hard in the media to attribute the vast majority of past warming, particularly in the period 1978-1998, to ppm changes in CO2 concentration.  But this same 2-decade period saw extremely high solar activity (as measured by sunspots) and ocean cycles like the PDO in the warm phase.  To maximize how much past warming was attributed to CO2, warming alarmists had to take the fairly absurd position that these ocean cycles and changes in solar output had only trivial effects on temperatures (much more here).

Well, we may find out over the next few years just how trivial Mr. Sun is or is not to the climate.  And we may well find out something else many skeptics have said for years -- for activities like agriculture, cooling is way more damaging than warming.  In the Middle Ages, agriculture boomed from 1100-1300 even as temperatures rose higher than they are today (at least in Europe).  In the first decades of the 1300's, cooling led to agricultural failure and famine, famines that are often credited for weakening the population and thus increasing the mortality from the Black Death a few years later.

A New Scientific Low

I am really just amazed by these remarks by NCAR's Dr. Ken Trenberth to be given, apparently planned for the American Meteorological Society gathering this month.   The and Anthony Watt has reprinted it on his blog.

It is hard to know where to start, but the following excerpt is an outstanding example of climate science process where 1.  Conclusions are assumed; 2.  Conclusions are deemed unequivocal by reference to authority; 3. Debate rules are proposed wherin it is impossible to refute the conclusion; 4.  All weather events that make the news are assumed to be caused or made worse by man-made warming, and thereby, in circular fashion, further prove the theory.

Normally, when I cite the above as the process, I get grief from folks who say I am mis-interpreting things, as usually I am boiling a complex argument down to this summary.   The great thing about alarmist Trenberth's piece is that no interpretation is necessary.   He outlines this process right in a single paragraph.  I will label the four steps above

Given that global warming is “unequivocal” [1], to quote the 2007 IPCC report [2], the null hypothesis should now be reversed, thereby placing the burden of proof on showing that there is no human influence [3]. Such a null hypothesis is trickier because one has to hypothesize something specific, such as “precipitation has increased by 5%” and then prove that it hasn’t. Because of large natural variability, the first approach results in an outcome suggesting that it is appropriate to conclude that there is no increase in precipitation by human influences, although the correct interpretation is that there is simply not enough evidence (not a long enough time series). However, the second approach also concludes that one cannot say there is not a 5% increase in precipitation. Given that global warming is happening and is pervasive, the first approach should no longer be used. As a whole the community is making too many type II errors [4].

Are you kidding me -- if already every damn event in the tails of the normal distribution is taken by the core climate community as a proof of their hypothesis, how is there even room for type II errors?  Next up -- "Our beautiful, seasonal weather -- proof of global warming?"

Remember that the IPCC's conclusion of human-caused warming was based mainly on computer modelling.  The IPCC defenders will not admit this immediately, but press them hard enough on side arguments and it comes down to the models.

The summary of their argument is this:  for the period after 1950, they claim their computer models cannot explain warming patterns without including a large effect from anthropogenic CO2.  Since almost all the warming in the latter half of the century really occurred between 1978 and 1998, the IPCC core argument boils down to "we are unable to attribute the global temperature increase in these 20 years to natural factors, so it must have been caused by man-made CO2."  See my video here for a deeper discussion.

This seems to be a fairly thin reed.  After all, it may just be that after only a decade or two of serious study, we still do not understand climate variability very well, natural or not.  It is a particularly odd conclusion when one discovers that the models ignore a number of factors (like the PDO, ENSO, etc) that affect temperatures on a decadal scale.

We therefore have a hypothesis that is not based on observational data, and where those who hold the hypothesis claim that observational data should no longer be used to test their hypothesis.    He is hilarious when he says that reversing the null hypothesis would make it trickier for his critics.  It would make it freaking impossible, as he very well knows.  This is an unbelievingly disingenuous suggestion.  There are invisible aliens in my closet Dr. Trenberth -- prove me wrong.  It is always hard to prove a negative, and impossible in the complex climate system.  There are simply too many variables in flux to nail down cause and effect in any kind of definitive way, at least at our level of understanding  (we have studied economics much longer and we still have wild disagreements about cause and effect in macroeconomics).

He continues:

So we frequently hear that “while this event is consistent with what we expect from climate change, no single event can be attributed to human induced global warming”. Such murky statements should be abolished. On the contrary, the odds have changed to make certain kinds of events more likely. For precipitation, the pervasive increase in water vapor changes precipitation events with no doubt whatsoever. Yes, all events! Even if temperatures or sea surface temperatures are below normal, they are still higher than they would have been, and so too is the atmospheric water vapor amount and thus the moisture available for storms. Granted, the climate deals with averages. However, those averages are made up of specific events of all shapes and sizes now operating in a different environment. It is not a well posed question to ask “Is it caused by global warming?” Or “Is it caused by natural variability?” Because it is always both.

At some level, this is useless.   The climate system is horrendously complex.  I am sure everything affects everything.  So to say that it affects the probability is a true but unhelpful statement.   The concern is that warming will affect the rate of these events, or the severity of these events, in a substantial and noticeable way.

It is worth considering whether the odds of the particular event have changed sufficiently that one can make the alternative statement “It is unlikely that this event would have occurred without global warming.” For instance, this probably applies to the extremes that occurred in the summer of 2010: the floods in Pakistan, India, and China and the drought, heat waves and wild fires in Russia.

Now he has gone totally off the scientific reservation into astrology or the occult or something.   He is saying that there is a high probability that if CO2 levels were 120ppm lower that, for example, the floods in Pakistan would not have occurred.  This is pure conjecture, absolutely without facts, and probably bad conjecture at that.  After all, similar events of similar magnitude have occurred through all of recorded history in exactly these locations.

Some Notes

1.  For those unfamiliar with the issues, few skeptics deny that man's CO2 has no effect on warming, but believe the effect is being enormously exaggerated.  There is a bait and switch here, where the alarmist claims that "man is causing some warming" is the key conclusion, and once accepted, they can head off and start controlling the world's economy (and population, as seems to be desired by Trenberth).   But the fact that CO2 causes some greenhouse warming is a trivial conclusion.  The hard part is, in the complex climate system, how much does it cause.  There is a an argument to be made, as I have, that this warming is less than 1C over the next century.  This number actually has observational data on its side, as actual warming over the last century, given past CO2 increases, is much more consistent with my lower number than various alarmist forecasts of doom.  Again, this is discussed in much more depth here.

2.  One interesting fact is that alarmists have to deal with the lack of warming or increase in ocean heat content over the last 12 years or so.  They will argue that this is just a temporary aberration, and a much shorter time frame than they are working on.  But in effect, the core IPCC conclusions were really based on the warming over the 20 years from 1978-1998.  So while 12 years is admittedly short compared to many natural cycles in climate, and might be considered a dangerously short period to draw conclusions from, it is fairly large compared to the 20 year period that drove the IPCC conclusions.

Update: More thoughts from the Reference Frame.

Explaining Temperature History

I post most of my more detailed climate work over at my other blog.  But I wanted to repost here something I wrote in response to a number of request for a brief version of what is driving global temperatures.

My sense is that medium to long scale 20th century temperature trends can be explained mostly through three drivers:

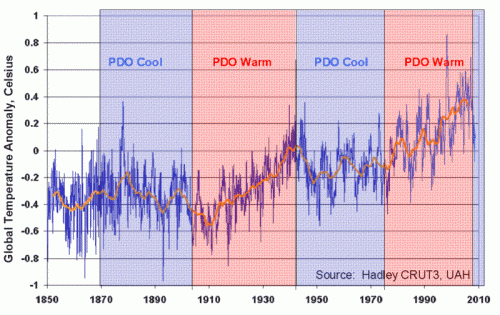
1.  A cyclical variation driven by multi-decade oceanic cycles like the Pacific Decadal Oscillation (PDO):

pdo

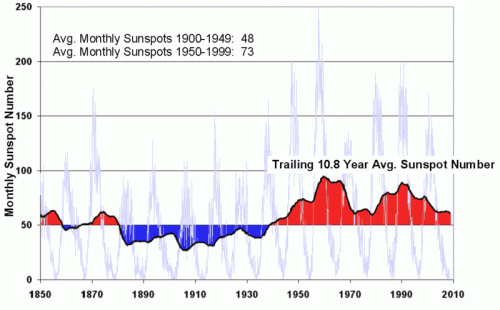
2.  Changes in solar output, either directly as increased heating or indirectly via a variety of theories on things like cosmic rays and cloud formation:

sunspot

3.  A long term trend of up to +0.05C per decade that may include a CO2-warming component.

I am willing to posit a CO2 impact net of feedbacks of perhaps 0.5-1.0C over the next century.  This may appear low, but is the only scale of number reasonably supported by history.  Any higher number would result in temperatures way too high historically.  And even assuming a number this high runs into the following problem:  There was probably a trend of about this magnitude emerging from the little ice age 200+ years ago and extending into the 20th century.  You can see it in the glacier numbers below:  (source)

glacier

Those that want to assign the temperature trend, once the sun and the PDO are removed, post-1950 to CO2, need to explain what effect was causing the nearly exact same trend from 1800-1950, and why that trend conveniently switched off at the exact moment man's CO2 takes over.  In the context of the glacier chart, what was causing the glaciers to retreat in 1880, and why is that effect not the one at work today?

With evidence that the PDO has reversed to its cool phase and that the sun may be shifting into low gear, I think it is reasonable to posit warming no more than 0.5-1.0C over the next century.  For those who have not seen it, Roy Spencer has a new paper on the PDO, clouds and temperature history.   My video on why climate models overstate future warming through absurd assumptions of high positive feedbacks is here.