My (Mostly Contrarian) Thoughts on AI
I am not an expert in AI, but I have seen a lot of waves software-based productivity innovations in my lifetime, and have developed some intuition as to how fast or slow they can penetrate corporate America.
I think the impact of AI over the next 5 years, particularly on productivity, has been exaggerated. Which should be no surprise as the impact of PC's and later the Internet also undershot their productivity expectations for the first 5 years.
On the positive side, current AI models have an immense ability to improve decision-making. Clearly the ability to do faster and sometimes better research supports all kinds of decision-making. In my old world of hospitality, I can see immediate application to things like better dynamic pricing decisions and (in peaky/seasonal businesses) better staffing predictions. Investment decisions, trading, inventory management, sales force targeting, and many other such data-intensive decisions likely can be improved with current AI models. But these are mostly cases where the financial impact is NOT based on workforce reduction and labor productivity.
From a pure person-replacement perspective, the best use case I have seen is in startups. AI can be a godsend for entrepreneurs and small startups that are trying to perform business activities that large companies have whole departments for, but for them might be a quarter person -- eg website design and maintenance. Given that these startups have no legacy systems or organizations, AI could conceivably become the backbone of a large company some day as they grow.
The problem with AI is its current untrustworthiness and error rate. If a startup has some crazy glitch on an AI-generated web site, it probably is not that damaging but the stakes are much higher for established companies. The problem in my mind boils down to the AI's lack of skepticism.
Everyone has heard of Descartes "I think therefore I am," but his actual logic was a bit different. It can best be summarized as "I doubt, therefore I think, therefore I am." The core of thinking for Descartes was doubt, or as I call it, skepticism. By Descartes' definition, can AI be actually thinking without skepticism?
This isn't a problem limited to AI -- much of the human race seems to have lost the ability to be skeptical. It seems everyone is really good at a knee-jerk skepticism of anything originating across the political aisle, but the capacity for skepticism for one's own work or for inputs that reinforce one's core beliefs is limited.
For several years in the 1990's I managed consulting teams at McKinsey. When analysts and associates came back to me with estimates and models, my role was frequently to demand that they have some skepticism about their own results -- does this final number make any sense at all? I remember one associate (who eventually rose much higher in the Firm than I did) bringing me a market model and proudly showing an addressable market in the trillions of dollars (this was before the SpaceX IPO when they -- with a straight face -- claimed an addressable market of $28.5 trillion). I asked him if this number made any sense at all to him. He said that's what came out of the spreadsheet. I said that when you saw that number, your first reaction should have been to think "wow, there is something wrong in my spreadsheet."
Without any built-in capacity to be skeptical or to reality-check its own results, AI has already been leading some companies over the cliff
- Almost every day in the legal world we see firms getting sanctioned by judges for including non-existent cases and references in their briefs, obviously a result of some AI hallucination. This has become so common that I actually considered a business a year ago that would hire itself out to review legal briefs for firms and scrub out the AI influence. When I talked earlier of there being higher stakes in existing businesses, this is a good example -- cases are being thrown out and attorneys are being sanctioned and disbarred over AI failures.
- I know some young people in the same sorts of consulting jobs I was in 30 years ago and they report that as a case manager a lot of their time is spent scrubbing out AI crap from the analysis submitted by their associates. I have a standing prediction that a public embarrassment is coming soon to one of the major consulting companies as a client cries foul over paying millions in consulting fees for ChatGPT output.
- The #1 cited use case for AI to reduce manpower is in writing code. And this makes some sense to me, programming after all is just writing with its own language and grammar and punctuation. But I still am skeptical companies in high stakes situations are going to let AI write mission-critical code. There have already been a few public failures (I believe AI agents created an AWS outage a while back) and I will not be surprised to see more
My point is not that AI cannot do useful things -- it is that it will be hard (at least in the current state of things) for AI to really get rid of a lot of workers either because the stakes will be too high to chance it's substitution or because almost as many workers will have to be hired to check the results.
This is not a unique opinion -- Apollo's chief economist Torsten Slok observed (paraphrased at Zero Hedge)
But that [software] is the exception. Across most of the economy, and especially in capital-intensive, heavily regulated sectors, deep process re-engineering and data governance requirements could delay structural productivity gains well beyond what the market currently projects. The list of slow-moving sectors is long, spanning health care, banking and insurance, energy and utilities, defense and aerospace, pharma and life sciences, manufacturing, transportation and logistics, construction and real estate, education, legal and the public sector.
For heaven's sakes, much of the government and a lot of the financial sector (including as many as 95% of the ATM's) run on COBOL. This is not just switching costs, it is a deep understanding of the cost of failure that drives reliance on a well-understood, reliable language platform.
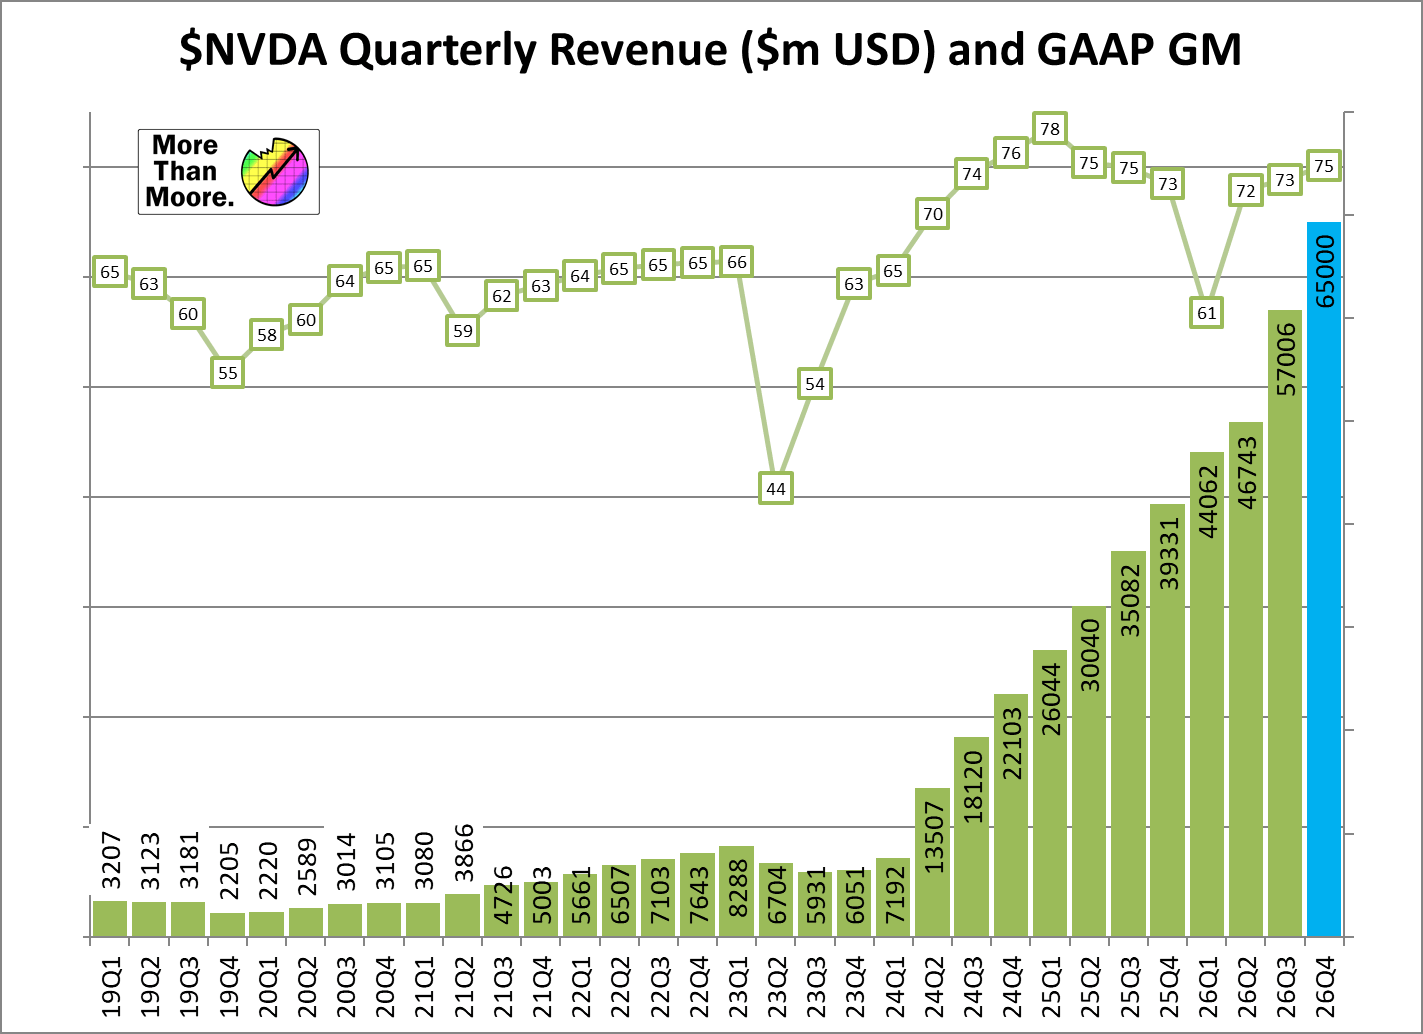
AI will still be adopted in these businesses, but as an add-on decision-making aid overlayed over the top of existing systems. Which leads me to the question of what will happen to SAAS companies like Salesforce or Oracle. The stock market has hammered these companies on the theory that corporations are going to adopt AI to replace their functionality. This seems ridiculous to me. Salesforce and Oracle applications are deeply embedded in corporation workflows and they are largely trusted by their customers. These SAAS apps already have their fingers in all the corporate data after years of integration efforts. If corporations are going to adopt AI for better decision-making, are they going to hire some 21-year-old startup guys to do AI (several of whom have pitched me) or are they going to go to Salesforce and Oracle and look at their AI offerings? Two years ago I saw the Salesforce CEO speaking at HBS, and his entire pitch was on AI and what Salesforce is doing to integrate AI into its offerings.
One final thought -- these corporations are NOT going to need the most token- and memory-hungry bleeding-edge AI models to do most of what they want to do. They want something less error-prone, sure, but the mid-tier product is going to be good enough (think of it this way, few computers bought by large corporations have super-high-end graphics cards or processors). And the mid-tier good enough AI already uses a lot fewer processing resources than the bleeding edge ones, and they will continue to get more compact and efficient over time. The point being is that the great data center scramble is likely something of a bubble in the same way companies like Enron were left wondering what happened to that big potential broadband market.
Postscript: The specific case of AI for resume screening is an interesting and evolving example. There is clearly a huge time saving (and perhaps quality improvement) if one can reliably plop 200 incoming resumes and have AI sort it down to the best 10 or so. The error problem is not a huge issue (at least for the company) as missing one good candidate out of the 200 is not fatal (there are still 10 others) and putting one bad candidate in the 10 is also not fatal (they will be human screened as a next step anyway). But then job seekers learned about AI screening and use AI now to optimize their resumes, LinkedIn pages, and cover letters to pass corporate AI screens. Soon hiring will be worker AIs talking to corporate AIs. My prediction is that the ultimate productivity savings will be low, as companies are going to have to get human to human contact to screen potential employees.