Archive for the ‘Climate’ Category.

Trend That Is Not A Trend: Wildfires (At Least Not This Year)

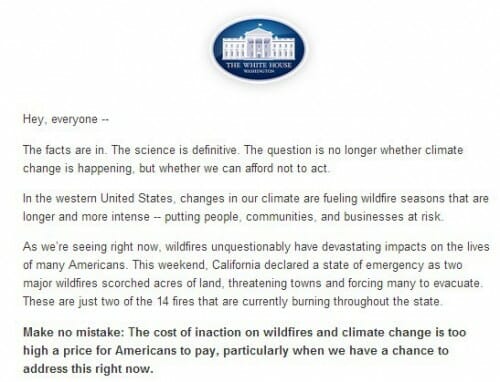
From the White House:

click to enlarge

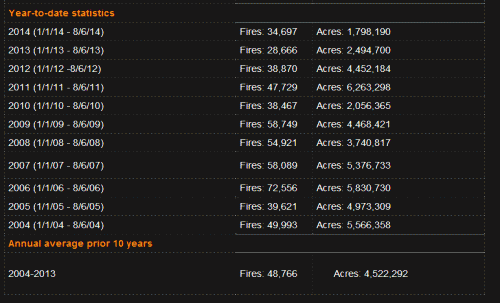
From the Federal Government's National Inter-agency Fire Center wildfire tracking page today

click to enlarge


The White House letter demonstrates the behavior that drives me crazy and caused me to start this feature in the first place.  They point to 14 fires in California and imply that this proves some kind of trend.  But how can an individual data point say anything about a trend?  In fact, as you can see above, there almost 50,000 wildfires by this point each year.  So what does the existence of 14 mean, one way or another, in establishing a trend?

Just to show that I don't underestimate the impact of fire, one of these two fires referenced in the White House letter is actually threatening my business near Burney, California and has caused us substantial losses due to lost revenue (for some odd reason people don't like to come out to a park when the air is filled with smoke and ash -- go figure).


PS -- There is an upward trend in the data vs. the 1950s and 1960s which is likely tied somewhat to climate but also somewhat to forest management practices.  Academics have had trouble separating the two.


Reconciling Seemingly Contradictory Climate Claims

At Real Science, Steven Goddard claims this is the coolest summer on record in the US.

The NOAA reports that both May and June were the hottest on record.

It used to be the the media would reconcile such claims and one might learn something interesting from that reconciliation, but now all we have are mostly-crappy fact checks with Pinocchio counts.  Both these claims have truth on their side, though the NOAA report is more comprehensively correct.  Still, we can learn something by putting these analyses in context and by reconciling them.

The NOAA temperature data for the globe does indeed show May and June as the hottest on record.  However, one should note a couple of things

  • The two monthly records do not change the trend over the last 10-15 years, which has basically been flat.  We are hitting records because we are sitting on a plateau that is higher than the rest of the last century (at least in the NOAA data).  It only takes small positive excursions to reach all-time highs
  • There are a number of different temperature data bases that measure the temperature in different ways (e.g. satellite vs. ground stations) and then adjust those raw readings using different methodologies.  While the NOAA data base is showing all time highs, other data bases, such as satellite-based ones, are not.
  • The NOAA database has been criticized for manual adjustments to temperatures in the past which increase the warming trend.  Without these adjustments, temperatures during certain parts of the 1930's (think: Dust Bowl) would be higher than today.  This was discussed here in more depth.  As is usual when looking at such things, some of these adjustments are absolutely appropriate and some can be questioned.  However, blaming the whole of the warming signal on such adjustments is just wrong -- satellite data bases which have no similar adjustment issues have shown warming, at least between 1979 and 1999.

The Time article linked above illustrated the story of these record months with a video partially on wildfires.  This is a great example of how temperatures are indeed rising but media stories about knock-on effects, such as hurricanes and fires, can be full of it.  2014 has actually been a low fire year so far in the US.

So the world is undeniably on the warm side of average (I won't way warmer than normal because what is "normal"?)  So how does Goddard get this as the coolest summer on record for the US?

Well, the first answer, and it is an important one to remember, is that US temperatures do not have to follow global temperatures, at least not tightly.  While the world warmed 0.5-0.7 degrees C from 1979-1999, the US temperatures moved much less.  Other times, the US has warmed or cooled more than the world has.  The US is well under 5% of the world's surface area.  It is certainly possible to have isolated effects in such an area.  Remember the same holds true the other way -- heat waves in one part of the world don't necessarily mean the world is warming.

But we can also learn something that is seldom discussed in the media by looking at Goddard's chart:

click to enlarge

First, I will say that I am skeptical of any chart that uses "all USHCN" stations because the number of stations and their locations change so much.  At some level this is an apples to oranges comparison -- I would be much more comfortable to see a chart that looks at only USHCN stations with, say, at least 80 years of continuous data.  In other words, this chart may be an artifact of the mess that is the USHCN database.

However, it is possible that this is correct even with a better data set and against a backdrop of warming temperatures.  Why?  Because this is a metric of high temperatures.  It looks at the number of times a data station reads a high temperature over 90F.  At some level this is a clever chart, because it takes advantage of a misconception most people, including most people in the media have -- that global warming plays out in higher daytime high temperatures.

But in fact this does not appear to be the case.  Most of the warming we have seen over the last 50 years has manifested itself as higher nighttime lows and higher winter temperatures.  Both of these raise the average, but neither will change Goddard's metric of days above 90F.  So it is perfectly possible Goddard's chart is right even if the US is seeing a warming trend over the same period.  Which is why we have not seen any more local all-time daily high temperature records set recently than in past decades.  But we have seen a lot of new records for high low temperature, if that term makes sense.  Also, this explains why the ratio of daily high records to daily low records has risen -- not necessarily because there are a lot of new high records, but because we are setting fewer low records.  We can argue about daytime temperatures but nighttime temperatures are certainly warmer.

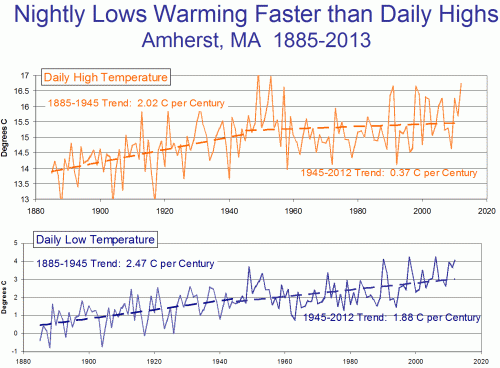
This chart shows an example with low and high temperatures over time at Amherst, MA  (chosen at random because I was speaking there).  Note that recently, most warming has been at night, rather than in daily highs.

Computer Modeling as "Evidence"

The BBC has decided not to every talk to climate skeptics again, in part based on the "evidence" of computer modelling

Climate change skeptics are being banned from BBC News, according to a new report, for fear of misinforming people and to create more of a "balance" when discussing man-made climate change.

The latest casualty is Nigel Lawson, former London chancellor and climate change skeptic, who has just recently been barred from appearing on BBC. Lord Lawson, who has written about climate change, said the corporation is silencing the debate on global warming since he discussed the topic on its Radio 4 Today program in February.

This skeptic accuses "Stalinist" BBC of succumbing to pressure from those with renewable energy interests, like the Green Party, in an editorial for the Daily Mail.

He appeared on February 13 debating with scientist Sir Brian Hoskins, chairman of the Grantham Institute for Climate Change at Imperial College, London, to discuss recent flooding that supposedly was linked to man-made climate change.

Despite the fact that the two intellectuals had a "thoroughly civilized discussion," BBC was "overwhelmed by a well-organized deluge of complaints" following the program. Naysayers harped on the fact that Lawson was not a scientist and said he had no business voicing his opinion on the subject.

...

Among the objections, including one from Green Party politician Chit Chong, were that Lawson's views were not supported by evidence from computer modeling.

I see this all the time.  A lot of things astound me in the climate debate, but perhaps the most astounding has been to be accused of being "anti-science" by people who have such a poor grasp of the scientific process.

Computer models and their output are not evidence of anything.  Computer models are extremely useful when we have hypotheses about complex, multi-variable systems.  It may not be immediately obvious how to test these hypotheses, so computer models can take these hypothesized formulas and generate predicted values of measurable variables that can then be used to compare to actual physical observations.

This is no different (except in speed and scale) from a person in the 18th century sitting down with Newton's gravitational equations and grinding out five years of predicted positions for Venus (in fact, the original meaning of the word "computer" was a human being who ground out numbers in just his way).  That person and his calculations are the exact equivalent of today's computer models.  We wouldn't say that those lists of predictions for Venus were "evidence" that Newton was correct.  We would use these predictions and compare them to actual measurements of Venus's position over the next five years.  If they matched, we would consider that match to be the real evidence that Newton may be correct.

So it is not the existence of the models or their output that are evidence that catastrophic man-made global warming theory is correct.  It would be evidence that the output of these predictive models actually match what plays out in reality.  Which is why skeptics think the fact that the divergence between climate model temperature forecasts and actual temperatures is important, but we will leave that topic for other days.

The other problem with models

The other problem with computer models, besides the fact that they are not and cannot constitute evidence in and of themselves, is that their results are often sensitive to small changes in tuning or setting of variables, and that these decisions about tuning are often totally opaque to outsiders.

I did computer modelling for years, though of markets and economics rather than climate.  But the techniques are substantially the same.  And the pitfalls.

Confession time.  In my very early days as a consultant, I did something I am not proud of.  I was responsible for a complex market model based on a lot of market research and customer service data.  Less than a day before the big presentation, and with all the charts and conclusions made, I found a mistake that skewed the results.  In later years I would have the moral courage and confidence to cry foul and halt the process, but at the time I ended up tweaking a few key variables to make the model continue to spit out results consistent with our conclusion.  It is embarrassing enough I have trouble writing this for public consumption 25 years later.

But it was so easy.  A few tweaks to assumptions and I could get the answer I wanted.  And no one would ever know.  Someone could stare at the model for an hour and not recognize the tuning.

Robert Caprara has similar thoughts in the WSJ (probably behind a paywall)  Hat tip to a reader

The computer model was huge—it analyzed every river, sewer treatment plant and drinking-water intake (the places in rivers where municipalities draw their water) in the country. I'll spare you the details, but the model showed huge gains from the program as water quality improved dramatically. By the late 1980s, however, any gains from upgrading sewer treatments would be offset by the additional pollution load coming from people who moved from on-site septic tanks to public sewers, which dump the waste into rivers. Basically the model said we had hit the point of diminishing returns.

When I presented the results to the EPA official in charge, he said that I should go back and "sharpen my pencil." I did. I reviewed assumptions, tweaked coefficients and recalibrated data. But when I reran everything the numbers didn't change much. At our next meeting he told me to run the numbers again.

After three iterations I finally blurted out, "What number are you looking for?" He didn't miss a beat: He told me that he needed to show $2 billion of benefits to get the program renewed. I finally turned enough knobs to get the answer he wanted, and everyone was happy...

I realized that my work for the EPA wasn't that of a scientist, at least in the popular imagination of what a scientist does. It was more like that of a lawyer. My job, as a modeler, was to build the best case for my client's position. The opposition will build its best case for the counter argument and ultimately the truth should prevail.

If opponents don't like what I did with the coefficients, then they should challenge them. And during my decade as an environmental consultant, I was often hired to do just that to someone else's model. But there is no denying that anyone who makes a living building computer models likely does so for the cause of advocacy, not the search for truth.
The Real Money in the Climate Debate

I have yet to meet a skeptic who reports getting any money from mysterious climate skeptics.  A few years ago Greenpeace had a press release that was picked up everywhere about how Exxon was spending big money on climate denialism, with numbers that turned out to be in the tens of thousands of dollars a year.

The big money has always been in climate alarmism.  Climate skeptics are outspent a thousand to one.  Here is just one example

It sounds like the makings of a political-action thriller. The National Geospatial Intelligence Agency (NGA) has awarded Arizona State University a five-year, $20 million agreement to research the effects of climate change and its propensity to cause civil and political unrest.

The agreement is known as the Foresight Initiative. The goal is to understand how climate-caused disruptions and the depletion of natural resources including water, land and energy will impact political instability.

The plan is to create visually appealing computer models and simulations using large quantities of real-time data to guide policymakers in their decisions.

To understand the impacts of climate change, ASU is using the latest advances in cloud computing and storage technologies, natural user interfaces and machine learning to create real-time computer models and simulations, said Nadya Bliss, principal investigator for the Foresight Initiative and assistant vice president with ASU's Office of Knowledge and Development.

I can tell you the answer to this study already.  How do I know?  If they say the security risks are minimal, there will be zero follow-up funding.  If they say the security risks are huge, it will almost demand more and larger follow-up studies.  What is your guess of the results, especially since the results will all be based on opaque computer models whose results will be extremely sensitive to small changes in certain inputs?

Postscript:  I can just imagine a practical joke where the researchers give university officials a preview of results.  They say that the dangers are minimal.  It would be hilarious to see the disappointment in the eyes of all the University administrators.  Never in history would such a positive result be received with so much depression.  And then the researchers would say "Just kidding, of course it will be a catastrophe, it will be much worse than predicted, the badness will be accelerating, etc."

Another Plea to Global Warming Alarmists on the Phrase "Climate Denier"

Stop calling me and other skeptics "climate deniers".  No one denies that there is a climate.  It is a stupid phrase.

I am willing, even at the risk of the obvious parallel that is being drawn to the Holocaust deniers, to accept the "denier" label, but it has to be attached to a proposition I actually deny, or that can even be denied.

As help in doing so, here are a few reminders (these would also apply to many mainstream skeptics -- I am not an outlier)

  • I don't deny that climate changes over time -- who could?  So I am not a climate change denier
  • I don't deny that the Earth has warmed over the last century (something like 0.7C).  So I am not a global warming denier
  • I don't deny that man's CO2 has some incremental effect on warming, and perhaps climate change (in fact, man effects climate with many more of his activities other than just CO2 -- land use, with cities on the one hand and irrigated agriculture on the other, has measurable effects on the climate).  So I am not a man-made climate change or man-made global warming denier.

What I deny is the catastrophe -- the proposition that man-made global warming** will cause catastrophic climate changes whose adverse affects will outweigh both the benefits of warming as well as the costs of mitigation.  I believe that warming forecasts have been substantially exaggerated (in part due to positive feedback assumptions) and that tales of current climate change trends are greatly exaggerated and based more on noting individual outlier events and not through real data on trends (see hurricanes, for example).

Though it loses some of this nuance, I would probably accept "man-made climate catastrophe denier" as a title.

** Postscript -- as a reminder, there is absolutely no science that CO2 can change the climate except through the intermediate step of warming.   If you believe it is possible for CO2 to change the climate without there being warming (in the air, in the oceans, somewhere), then you have no right to call anyone else anti-science and you should go review your subject before you continue to embarrass yourself and your allies.

On The Steven Goddard Claim of "Fabricated" Temperature Data

Steven Goddard of the Real Science blog has a study that claims that US real temperature data is being replaced by fabricated data.  Christopher Booker has a sympathetic overview of the claims.

I believe that there is both wheat and chaff in this claim, and I would like to try to separate the two as best I can.  I don't have time to write a well-organized article, so here is just a list of thoughts

  1. At some level it is surprising that this is suddenly news.  Skeptics have criticized the adjustments in the surface temperature database for years
  2. There is certainly a signal to noise ratio issue here that mainstream climate scientists have always seemed insufficiently concerned about.  Specifically, the raw data for US temperatures is mostly flat, such that the manual adjustments to the temperature data set are about equal in magnitude to the total warming signal.  When the entire signal one is trying to measure is equal to the manual adjustments one is making to measurements, it probably makes sense to put a LOT of scrutiny on the adjustments.  (This is a post from 7 years ago discussing these adjustments.  Note that these adjustments are less than current ones in the data base as they have been increased, though I cannot find a similar chart any more from the NOAA discussing the adjustments)
  3. The NOAA HAS made adjustments to US temperature data over the last few years that has increased the apparent warming trend.  These changes in adjustments have not been well-explained.  In fact, they have not really be explained at all, and have only been detected by skeptics who happened to archive old NOAA charts and created comparisons like the one below.  Here is the before and after animation (pre-2000 NOAA US temperature history vs. post-2000).  History has been cooled and modern temperatures have been warmed from where they were being shown previously by the NOAA.  This does not mean the current version  is wrong, but since the entire US warming signal was effectively created by these changes, it is not unreasonable to act for a detailed reconciliation (particularly when those folks preparing the chart all believe that temperatures are going up, so would be predisposed to treating a flat temperature chart like the earlier version as wrong and in need of correction.
    1998changesannotated
  4. However, manual adjustments are not, as some skeptics seem to argue, wrong or biased in all cases.  There are real reasons for manual adjustments to data -- for example, if GPS signal data was not adjusted for relativistic effects, the position data would quickly get out of whack.  In the case of temperature data:
    • Data is adjusted for shifts in the start/end time for a day of measurement away from local midnight (ie if you average 24 hours starting and stopping at noon).  This is called Time of Observation or TOBS.  When I first encountered this, I was just sure it had to be BS.  For a month of data, you are only shifting the data set by 12 hours or about 1/60 of the month.  Fortunately for my self-respect, before I embarrassed myself I created a spreadsheet to monte carlo some temperature data and play around with this issue.  I convinced myself the Time of Observation adjustment is valid in theory, though I have no way to validate its magnitude  (one of the problems with all of these adjustments is that NOAA and other data authorities do not release the source code or raw data to show how they come up with these adjustments).   I do think it is valid in science to question a finding, even without proof that it is wrong, when the authors of the finding refuse to share replication data.  Steven Goddard, by the way, believes time of observation adjustments are exaggerated and do not follow NOAA's own specification.
    • Stations move over time.  A simple example is if it is on the roof of a building and that building is demolished, it has to move somewhere else.  In an extreme example the station might move to a new altitude or a slightly different micro-climate.  There are adjustments in the data base for these sort of changes.  Skeptics have occasionally challenged these, but I have no reason to believe that the authors are not using best efforts to correct for these effects (though again the authors of these adjustments bring criticism on themselves for not sharing replication data).
    • The technology the station uses for measurement changes (e.g. thermometers to electronic devices, one type of electronic device to another, etc.)   These measurement technologies sometimes have known biases.  Correcting for such biases is perfectly reasonable  (though a frustrated skeptic could argue that the government is diligent in correcting for new cooling biases but seldom corrects for warming biases, such as in the switch from bucket to water intake measurement of sea surface temperatures).
    • Even if the temperature station does not move, the location can degrade.  The clearest example is a measurement point that once was in the country but has been engulfed by development  (here is one example -- this at one time was the USHCN measurement point with the most warming since 1900, but it was located in an open field in 1900 and ended up in an asphalt parking lot in the middle of Tucson.)   Since urban heat islands can add as much as 10 degrees F to nighttime temperatures, this can create a warming signal over time that is related to a particular location, and not the climate as a whole.  The effect is undeniable -- my son easily measured it in a science fair project.  The effect it has on temperature measurement is hotly debated between warmists and skeptics.  Al Gore originally argued that there was no bias because all measurement points were in parks, which led Anthony Watts to pursue the surface station project where every USHCN station was photographed and documented.  The net results was that most of the sites were pretty poor.  Whatever the case, there is almost no correction in the official measurement numbers for urban heat island effects, and in fact last time I looked at it the adjustment went the other way, implying urban heat islands have become less of an issue since 1930.  The folks who put together the indexes argue that they have smoothing algorithms that find and remove these biases.  Skeptics argue that they just smear the bias around over multiple stations.  The debate continues.
  5. Overall, many mainstream skeptics believe that actual surface warming in the US and the world has been about half what is shown in traditional indices, an amount that is then exaggerated by poorly crafted adjustments and uncorrected heat island effects.  But note that almost no skeptic I know believes that the Earth has not actually warmed over the last 100 years.  Further, warming since about 1980 is hard to deny because we have a second, independent way to measure global temperatures in satellites.  These devices may have their own issues, but they are not subject to urban heat biases or location biases and further actually measure most of the Earth's surface, rather than just individual points that are sometimes scores or hundreds of miles apart.  This independent method of measurement has shown undoubted warming since 1979, though not since the late 1990's.
  6. As is usual in such debates, I find words like "fabrication", "lies",  and "myth" to be less than helpful.  People can be totally wrong, and refuse to confront their biases, without being evil or nefarious.

Postscript:  Not exactly on topic, but one thing that is never, ever mentioned in the press but is generally true about temperature trends -- almost all of the warming we have seen is in nighttime temperatures, rather than day time.  Here is an example from Amherst, MA (because I just presented up there).  This is one reason why, despite claims in the media, we are not hitting any more all time daytime highs than we would expect from a normal distribution.  If you look at temperature stations for which we have 80+ years of data, fewer than 10% of the 100-year highs were set in the last 10 years.  We are setting an unusual number of records for high low temperature, if that makes sense.

click to enlarge


Trend That Is Not A Trend: Changes in Data Definition or Measurement Technology

This chart illustrates a data analysis mistake that is absolutely endemic to many of the most famous climate charts.  Marc Morano screencapped this from a new EPA web site  (update:  Actually originally from Pat Michaels at Cato)

The figure below is a portion of a screen capture from the “Heat-Related Deaths” section of the EPA’s new “Climate Change Indicators” website. It is labeled “Deaths Classified as ‘Heat-Related’ in the United States, 1979–2010.”

click to enlarge

The key is in the footnote, which says

Between 1998 and 1999, the World Health Organization revised the international codes used to classify causes of death. As a result, data from earlier than 1999 cannot easily be compared with data from 1999 and later.

So, in other words, this chart is totally bogus.  There is an essentially flat trend up to the 1998 switch in data definition and an essentially flat trend after 1998.  There is a step-change upwards in 1998 due to the data redefinition.  This makes this chart useless unless your purpose is to fool generally ignorant people that there is an upwards trend, and then it is very useful.  It is not, however, good science.

Other examples of this step change in a metric occurring at a data redefinition or change in measurement technique can be found in

  • The hockey stick  (and here)
  • Ocean heat content  (sorry, can't find the link but the shift from using thermometers in pails dipped from ships to the ARGO floats caused a one time step change in ocean heat content measurements)
  • Tornadoes
  • Hurricanes

Memorial Day Icebergs

Taken from a campground we operate in the UP of Michigan on Lake Superior, the white stuff is ice on the lake on May 28

click to enlarge

Great Moments in "Science"

You know that relative of yours, who last Thanksgiving called you anti-science because you had not fully bought into global warming alarm?

Well, it appears that the reason we keep getting called "anti-science" is because climate scientists have a really funny idea of what exactly "science" is.

Apparently, a number of folks have been trying for years to get articles published in peer reviewed journals comparing the IPCC temperature models to actual measurements, and in the process highlighting the divergence of the two.  And they keep getting rejected.

Now, the publisher of Environmental Research Letters has explained why.  Apparently, in climate science it is "an error" to attempt to compare computer temperature forecasts with the temperatures that actually occurred.  In fact, he says that trying to do so "is harmful as it opens the door for oversimplified claims of 'errors' and worse from the climate sceptics media side".  Apparently, the purpose of scientific inquiry is to win media wars, and not necessarily to discover truth.

Here is something everyone in climate should remember:  The output of models merely represents a hypothesis.  When we have complicated hypotheses in complicated systems, and where such hypotheses may encompass many interrelated assumptions, computer models are an important tool for playing out, computationally, what results those hypotheses might translate to in the physical world.  It is no different than if Newton had had a computer and took his equation Gmm/R^2 and used the computer to project future orbits for the Earth and other planets (which he and others did, but by hand).   But these projections would have no value until they were checked against actual observations.  That is how we knew we liked Newton's models better than Ptolemy's -- because they checked out better against actual measurements.

But climate scientists are trying to create some kind of weird world where model results have some sort of independent reality, where in fact the model results should be trusted over measurements when the two diverge.  If this is science -- which it is not -- but if it were, then I would be anti-science.

Skeptics -- Don't Be That Guy Who Gets Us All Tarred as Anti-Science

Alarmists have adopted the seemingly farcical but oddly effective technique of finding the most absurd skeptic argument they can, then beating the carp out of this straw man, and then claiming that this proves that all skeptics are anti-science.

Don't believe me?  Kevin Drum did it yesterday, bravely taking on a claim -- that atmospheric CO2 concentrations have not increased in the last century -- that I have never seen a skeptic make and I am pretty active in the community.  Having beaten up on this odd, outlier position, he then claims this tars everyone who does not agree with him

Nonetheless, there you have it. In the tea party precincts of the conservative movement, even the simplest version of reality doesn't matter. If cheese denial is how you demonstrate you're part of the tribe, then anyone who denies cheese is a hero. The fact that you happen to be happily munching away on a slice of pizza at the time doesn't faze you at all.

Awesome.  So by this logic, everything Kevin Drum says about the environment is wrong because some moron environmental activists signed a petition against dihydrogen monoxide in a Penn and Teller Bullshit! episode

So, as a public service, I wanted to link to Roy Spencer's list of 10 skeptic arguments that don't hold water.  There are quality scientific arguments against catastrophic man-made warming theory.  You don't need to rely on ones that are wrong.

I agree with all of these.  I will say that I used to believe a version of #5, but I have been convinced as to why it is wrong.  However, it is still true that CO2 has a diminishing return effect on warming such that each additional molecule has less effect on warming than the last.  That is why climate sensitivity is most often shown as degrees of warming per doubling of concentration of CO2, meaning 400-800 ppm has the same effect as 800-1600ppm.

Postscript:  Drum choose to lampoon a position that is such an outlier it did not even make Spencer's list.  Spencer assumes even the craziest skeptics accept that CO2 is increasing, such that the bad science he is refuting in #7 relates to the causes of that increase.

Climate Alarmists Coming Around to At Least One Skeptic Position

As early as 2009 (and many other more prominent skeptics were discussing it much earlier) I reported on why measuring ocean heat content was a potentially much better measure of greenhouse gas changes to the Earth rather than measuring surface air temperatures.  Roger Pielke, in particular, has been arguing this for as long as I can remember.

The simplest explanation for why this is true is that greenhouse gasses increase the energy added to the surface of the Earth, so that is what we would really like to measure, that extra energy.  But in fact the vast, vast majority of the heat retention capacity of the Earth's surface is in the oceans, not in the air.  Air temperatures may be more immediately sensitive to changes in heat flux, but they are also sensitive to a lot of other noise that tends to mask long-term signals.    The best analog I can think of is to imagine that you have two assets, a checking account and your investment portfolio.  Looking at surface air temperatures to measure long-term changes in surface heat content is a bit like trying to infer long-term changes in your net worth by looking only at your checking account, whose balance is very volatile, vs. looking at the changing size of your investment portfolio.

Apparently, the alarmists are coming around to this point

Has global warming come to a halt? For the last decade or so the average global surface temperature has been stabilising at around 0.5°C above the long-term average. Can we all relax and assume global warming isn't going to be so bad after all?

Unfortunately not. Instead we appear to be measuring the wrong thing. Doug McNeall and Matthew Palmer, both from the Met Office Hadley Centre in Exeter, have analysed climate simulations and shown that both ocean heat content and net radiation (at the top of the atmosphere) continue to rise, while surface temperature goes in fits and starts. "In my view net radiation is the most fundamental measure of global warming since it directly represents the accumulation of excess solar energy in the Earth system," says Palmer, whose findings are published in the journal Environmental Research Letters.

First, of course, we welcome past ocean heat content deniers to the club.  But second, those betting on ocean heat content to save their bacon and keep alarmism alive should consider why skeptics latched onto the metric with such passion.   In fact, ocean heat content may be rising more than surface air temperatures, but it has been rising MUCH less than would be predicted from high-sensitivity climate models.

Wherein I Almost Agree With Thomas Friedman on a Climate Issue

Thomas Friedman outlines what he would do first to attack climate change

Well, the first thing we would do is actually slash income taxes and corporate taxes and replace them with a carbon tax so we actually encourage people to stop doing what we don't want, which is emitting carbon, and start doing what we do want, which is hiring more workers and getting corporations to invest more in America.

Friedman is a bit disingenuous here, as he proposes this in a way that implies that deniers (and probably evil Republicans and libertarians) oppose this common sense approach.  Some may, but I would observe that no one on the alarmist side or the Left side of the aisle is actually proposing a carbon tax that 1:1 reduces other taxes.  The only person I know who has proposed this is Republican Jeff Flake, who proposed a carbon tax that would 1:1 reduce payroll taxes.

As I said back then, I am not a big fan of taxes and think that the alarm for global warming is overblown, but I could easily get behind such a plan.  Payroll taxes are consumption taxes on labor.  I can't think of anything much more detrimental to employment and economic health.  So Flake's proposed shift from a consumption tax on labor to a consumption tax on carbon-based energy sources is something I could get behind.  I probably would do the same for Friedman's idea of shifting taxes from income to carbon.  But again, no one is proposing that for real in Congress.  The only plan that came close to a vote was a cap and trade system where the incremental payments would go into essentially a crony slush fund, not reduce other taxes.

Of course, since this is Friedman, he can't get away without saying the government should invest more in infrastructure

 the federal government would borrow money at almost 0 percent and invest it in infrastructure to make our cities not only more resilient, but more efficient.

In TARP and the stimulus and various other clean energy bills, the government borrowed almost a trillion dollars at 0% interest.  How much good infrastructure got done?  About zero.  Most of it just went to feed government bureaucrats and planning studies or ended up as crony payments to well-protected entities (Solyndra, anyone?).  The issues with government infrastructure investments, which Friedman has never addressed despite zillions of articles on infrastructure, are not the borrowing rate but

  • The incentive and information problems the government has in making investments of any sort.
  • The vast environmental, licensing, and NIMBY factors that make it virtually impossible to do infrastructure projects any more, at least in any reasonable time frame.

OK, Can You Start Tomorrow?

Bill McKibben suggest climate alarmists go on strike until we start listening to them:

So at this point it’s absurd to keep asking the scientific community to churn out more reports. In fact, it might almost be more useful if they went on strike: until you pay attention to what we’ve already told you, we won’t be telling you more. Work with what you’ve got. We’re a quarter-century ahead – when you deal with the trouble we’ve already described then we’ll tell you what’s coming next.

Is Their a Guinsess Record for the Longest Correction?

This correction by Michel Taylor of something called the Australian Independent Media Network has got to be the longest correction in history.  You know it is an incredible correction when this is just a tiny part of the errors admitted:

  • Evans does not believe, and has never believed, that 9/11 was an inside job perpetrated by the Rothschild family, that US President Barack Obama is a secret Jew, that the Holocaust never happened or that Jewish bankers and the Rothschild family have assassinated at least two US Presidents.

The author also admits to getting Evans' education, occupation, organization, and sources of funding wrong.

In part I suppose kudos are owed to Mr. Taylor for being so honest, but seriously, how can one be so comprehensively wrong? (I will actually explain why in a minute).  The correction runs on so long in part because he Taylor also has to correct an earlier correction where he blamed one of his original sources for being intentionally misleading.  He also apologizes for that.

I would likely have posted this anyway just because it is sort of funny.  But it just so happens to tie into what I wrote yesterday here.  Because it is clear that Mr. Taylor's core mistake is that he researched the positions of a climate skeptic (Mr. Evans) solely by asking climate alarmists (and climate alarmist web sites) what this skeptic believed.  He felt no need to hear the skeptic case from the skeptic himself.  And what do you know, the descriptions of Mr. Evans' beliefs as portrayed by his ideological enemies were full of errors, exaggerations, straw men, and outright lies.  Who would have thought?

We can laugh at Mr. Taylor, but at least he admitted his mistakes in great depth.  But outlets such as the LA Times and the BBC have recently made it a rule they will never allow skeptic voices into their reporting.  They have institutionalized Mr. Taylor's mistake.

Climate Alarmism In One Statement: "Limited Evidence, High Agreement"

From James Delingpole:

The draft version of the report's Summary For Policymakers made the startling admission that the economic damage caused by "climate change" would be between 0.2 and 2 percent of global GDP - significantly less than the doomsday predictions made in the 2006 Stern report (which estimated the damage at between 5 and 20 percent of global GDP).

But this reduced estimate did not suit the alarmist narrative of several of the government delegations at the recent IPCC talks in Yokahama, Japan. Among them was the British one, comprising several members of the deep green Department of Energy and Climate Change (DECC), which insisted on doctoring this section of the Summary For Policymakers in order to exaggerate the potential for more serious economic damage.

"Losses are more likely than not to be greater, rather than smaller, than this range (limited evidence, high agreement)"

There was no evidence whatsoever in the body of the report to justify this statement.

I find it fascinating that there can be "high agreement" to a statement for which there is limited or no evidence.  Fortunately these are all self-proclaimed defenders of science or I might think this was purely a political statement.

Note that the most recent IPCC reports and new published studies on climate sensitivity tend to say that 1) warming in the next century will be 1-2C, not the much higher numbers previously forecast; 2)  That warming will not be particularly expensive to manage and mitigate and 3) we are increasingly less sure that warming is causing all sorts of negative knock-on effects like more hurricanes.  In other words, opinion is shifting to where science-based skeptics have been all along (since 2007 in my case).  No surprise or shame here.  What is shameful though is that as evidence points more and more to the lukewarmer skeptic position, we are still called evil heretical deniers that should be locked in jail.  Like telling Galileo, "you were right about that whole heliocentric thing but we still think you are evil for suggesting it."

Ideological Turing Tests, Climate, and Minimum Wage

Yesterday I was interviewed for a student radio show, I believe from the USC Annenberg school.  I have no quarrel with the staff I worked with, they were all friendly and intelligent.

What depressed me though, as I went through my usual bullet points describing the "lukewarmer" position that is increasingly common among skeptics, was that most of what I said seemed to be new to the interviewer.   It was amazing to see that someone presumably well-exposed to the climate debate would actually not have any real idea what one of the two positions really entailed (see here and here for what I outlined).  This gets me back to the notion I wrote about a while ago about people relying on their allies to tell them everything they need to know about their opponent's position, without ever actually listening to the opponents.

This topic comes up in the blogosphere from time to time, often framed as being able to pass an ideological Touring test.  Can, say, a Republican write a defense of the minimum wage that a reader of the Daily Kos would accept, or will it just come out sounding like a straw man?  I feel like I could do it pretty well, despite being a libertarian opposed to the minimum wage.  For example:

There is a substantial power imbalance between minimum wage workers and employers, such that employers are able to pay such workers far less than their labor is worth, and far less than they would be willing to pay if they had to.  The minimum wage corrects this power imbalance and prevents employers from unfairly exploiting this power imbalance.  It forces employers to pay employees something closer to a living wage, though at $7.25 an hour the minimum wage is still too low to be humane and needs to be raised.  When companies pay below a living wage, they not only exploit workers but taxpayers as well, since they are accepting a form of corporate welfare when taxpayers (through food stamps and Medicare and the like) help sustain their underpaid workers.

Opponents of the minimum wage will sometimes argue that higher minimum wages reduce employment.  However, since in most cases employers of low-skilled workers are paying workers less than they are willing and able to pay, raising the minimum wage has little effect on employment.  Studies of the fast food industry by Card and Walker demonstrated that raising the minimum wage had little effect on employment levels.  And any loss of employment from higher minimum wages would be more than offset by the Keynesian stimulative effect to the economy as a whole of increasing wages among lower income workers, who tend to consume nearly 100% of incremental income.

Despite the fact that I disagree with this position, I feel I understand it pretty well -- far better, I would say, than most global warming alarmists or even media members bother to try to understand the skeptic position.  (I must say that looking back over my argument, it strikes me as more cogent and persuasive than most of the stuff on Daily Kos, so to pass a true Turing test I might have to make it a bit more incoherent).

Back in my consulting days at McKinsey & Company, we had this tradition (in hindsight I would call it almost an affectation) of giving interviewees business cases** to discuss and solve in our job interviews.  If I were running a news outlet, I would require interviewees to take an ideological Touring test - take an issue and give me the argument for each side in the way that each side would present it.

This, by the way, is probably why Paul Krugman is my least favorite person in journalism.  He knows very well that his opponents have a fairly thoughtful and (to them) well intention-ed argument but pretends to his readers that no such position exists.  Which is ironic because in some sense Krugman started the dialog on ideological Turing tests, arguing that liberals can do it easily for conservative positions but conservatives fail at it for liberal positions.


** Want an example?  Many of these cases were just strategic choices in some of our consulting work.  But some were more generic, meant to test how one might break down and attack a problem.  One I used from time to time was, "what is the size of the window glass market in Mexico?"  Most applicants were ready for this kind of BS, but I do treasure the look on a few faces of students who had not been warned about such questions.  The point of course was to think it through out loud, ie "well there are different sectors, like buildings and autos.  Each would have both a new and replacement market. Within buildings there is residential and commercial.  Taking one of these, the new residential market would be driven by new home construction times some factor representing windows per house.  One might need to understand if Mexican houses used pre-manufactured windows or constructed them from components on the building site."  etc. etc.

We Are All Lukewarmers Now

Matt Ridley has another very good editorial in the WSJ that again does a great job of outlining what I think of as the core skeptic position.  Read the whole thing, but a few excerpts:

The United Nations' Intergovernmental Panel on Climate Change will shortly publish the second part of its latest report, on the likely impact of climate change. Government representatives are meeting with scientists in Japan to sex up—sorry, rewrite—a summary of the scientists' accounts of storms, droughts and diseases to come. But the actual report, known as AR5-WGII, is less frightening than its predecessor seven years ago.

The 2007 report was riddled with errors about Himalayan glaciers, the Amazon rain forest, African agriculture, water shortages and other matters, all of which erred in the direction of alarm. This led to a critical appraisal of the report-writing process from a council of national science academies, some of whose recommendations were simply ignored.

Others, however, hit home. According to leaks, this time the full report is much more cautious and vague about worsening cyclones, changes in rainfall, climate-change refugees, and the overall cost of global warming.

It puts the overall cost at less than 2% of GDP for a 2.5 degrees Centigrade (or 4.5 degrees Fahrenheit) temperature increase during this century. This is vastly less than the much heralded prediction of Lord Stern, who said climate change would cost 5%-20% of world GDP in his influential 2006 report for the British government.

It is certainly a strange branch of science where major reports omit a conclusion because that conclusion is not what they wanted to see

The IPCC's September 2013 report abandoned any attempt to estimate the most likely "sensitivity" of the climate to a doubling of atmospheric carbon dioxide. The explanation, buried in a technical summary not published until January, is that "estimates derived from observed climate change tend to best fit the observed surface and ocean warming for [sensitivity] values in the lower part of the likely range." Translation: The data suggest we probably face less warming than the models indicate, but we would rather not say so.

Readers of this site will recognize this statement

None of this contradicts basic physics. Doubling carbon dioxide cannot on its own generate more than about 1.1C (2F) of warming, however long it takes. All the putative warming above that level would come from amplifying factors, chiefly related to water vapor and clouds. The net effect of these factors is the subject of contentious debate.

I have reluctantly accepted the lukewarmer title, though I think it is a bit lame.

In climate science, the real debate has never been between "deniers" and the rest, but between "lukewarmers," who think man-made climate change is real but fairly harmless, and those who think the future is alarming. Scientists like Judith Curry of the Georgia Institute of Technology and Richard Lindzen of MIT have moved steadily toward lukewarm views in recent years.

When I make presentations, I like to start with the following (because it gets everyone's attention):  "Yes, I am a denier.  But to say 'denier', implies that one is denying some specific proposition.  What is that proposition?  It can't be 'global warming' because propositions need verbs, otherwise it is like saying one denies weather.  I don't deny that the world has warmed over the last century.  I don't deny that natural factors play a role in this (though many alarmists seem to).  I don't even deny that man has contributed incrementally to this warming.  What I deny is the catastrophe.  Specifically, I deny that man's CO2 will warm the Earth enough to create a catastrophe.  I define "catastrophe" as an outcome where the costs of immediately reducing CO2 output with the associated loss in economic growth would be substantially less than the cost of future adaption and abatement. "

These Are the Same Folks Who Denounced the Koch Brothers' Political Participation the Other Day

An excellent editorial from Tim Carney

Democrats occupied the Senate floor all night Monday, talking aboutclimate change. They didn't try to advance any legislation, and they didn't even try very hard to get media attention.

“The members know that serious climate change legislation stands no chance of passage in this divided Congress,” wrote the New York Times' climate-change reporter, Coral Davenport. Beyond that, Democrats know that action on climate legislation would help Republicans take the Senate in 2014.

So why occupy the Senate floor talking about the issue? In short: Faith, identity and cash.

The liberal climate cause is easier to understand if you think of it as a religion. Monday’s talkathon sounded at times like a religious revival. Senators spoke about the faithful who “believe in wind” and “believe in renewable” energy. Sen. Chris Coons, D-Del., said climate for him is “a faith issue.”

One doctrine in the Church of Climate is sola fide. In the words of Reformation theology: Justification comes through faith alone. “Good works” are irrelevant....

Beyond exercises in faith and identity politics, the Democratic all-nighter should be understood as a very odd fundraiser. Most fundraisers feature one or two politicians speaking to dozens of donors. Monday night featured a dozen politicians speaking to one donor: Energy billionaire Tom Steyer.

Steyer, having made his riches partly in green energy and fossil fuels, has decided to spend his billions electing Democrats who will pass climate legislation. He says he’s divested from his energy holdings, signifying his intentions are sincere.

Steyer spent $8 million to help elect Terry McAuliffe governor of Virginia last fall. “Steyer will inject millions into assorted races” in 2014, reports Joe Hagan in Men's Journal. Steyer has made it very clear what a politician needs to do to get his money: Make a big deal about climate change.

By the way, kudos to Carney for getting this correct.  It seems like an easy nuance to get accurately, but no one in the media ever does

Democrats called Republicans “deniers” 28 times during the talkathon. Majority Leader Harry Reidframed his speech this way: “Despite overwhelming scientific evidence and overwhelming public opinion, climate change deniers still exist.”

There’s an ounce of truth to this attack: Some Republicans wrongly deny that carbon dioxide and similar gasses exert a net upward pressure on atmospheric temperature, and that this has affected the climate.

But liberals hurl the term “climate denier” at anyone who doubts the hyperbolic catastrophic predictions of Al Gore, posits that non-manmade factors (like the sun) may also drive climate change, or opposes Democrats policies — the same policies Democrats aren’t actually trying to pass.

I have actually learned to embrace the "denier" label.  When it is applied to me, I agree that I am, but that one has to be careful what exact proposition I am denying.  I don't deny that the world has warmed over the last 100 years or that man-made CO2 has contributed incrementally to that warming, both now and in the future.  What I deny is the catastrophe.

A Bad Chart From My Allies

I try to make it a habit to criticize bad analyses from "my side" of certain debates.  I find this to be a good habit that keeps one from falling for poorly constructed but ideologically tempting arguments.

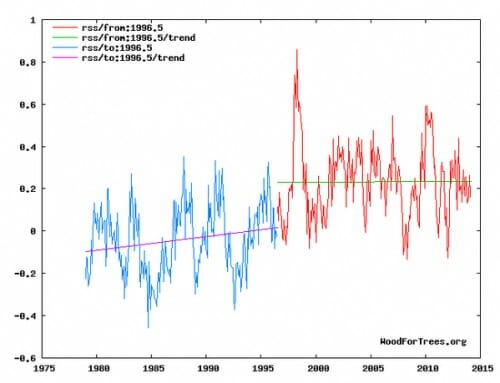
Here is my example this week, from climate skeptic Steven Goddard.  I generally enjoy his work, and have quoted him before, but this is a bad chart (this is global temperatures as measured by satellite and aggregated by RSS).

click to enlarge


He is trying to show that the last 17+ years has no temperature trend.  Fine.  But by trying to put a trend line on the earlier period, it results in a mess that understates warming in earlier years.    He ends up with 17 years with a zero trend and 20 years with a 0.05 per decade trend.  Add these up and one would expect 0.1C total warming.   But in fact over this entire period there was, by this data set, 0.3C-0.4C of warming.  He left most of the warming out in the the step between the two lines.

Now there are times this might be appropriate.  For example, in the measurement of ocean heat content, there is a step change that occurs right at the point where the measurement approach changed from ship records to the ARGO floats.  One might argue that it is wrong to make a trend through the transition point because the step change was an artifact of the measurement change.  But in this case there was no such measurement change.  And while there was a crazy El Nino year in 1998, I have heard no argument from any quarter as to why there might have been some fundamental change in the climate system around 1997.

So I call foul.  Take the trend line off the blue portion and the graph is much better.

A Proposal For Better Management of the (Soon to Be) California Climate Slush Fund

California is about to implement a new climate tax via a cap and trade system, where revenues from the tax are supposed to be dedicated to carbon reduction projects.  Forget for a moment all my concerns with climate dangers being overhyped, or the practical problems (read cronyism) inherent in a cap-and-trade system vs. a straight carbon tax.  There is one improvement California can and should make to this system.

Anyone who can remember the history of the tobacco settlement will know that the theory of that settlement was that the funds were needed to pay for additional medical expenses driven by smoking.  Well, about zero of these funds actually went to health care or even to smoking reduction programs  (smoking reduction programs turn out to be fiscally irresponsible for states, since they lead to reduced tax revenues from tobacco taxes).  These funds just became a general slush fund for legislators.   Some states (New York among them, if I remember correctly), spent the entire 20 year windfall in one year to close budget gaps.

If California is serious that these new taxes on energy should go to carbon reduction programs, then these programs need to be scored by a neutral body as to their cost per ton of CO2 reduction.  I may think the program misguided, but given that it exists, it might as well be run in a scientific manner, right?  I would really prefer that there be a legislated hurdle rate, e.g. all programs must have a cost per ton reduction of $45 of less -- or whatever.  But even publishing scores in a transparent way would help.

This would, for example, likely highlight what a terrible investment this would be in reducing CO2.


The Thought Experiment That First Made Me A Climate Skeptic

Please check out my Forbes post today.  Here is how it begins:

Last night, the accumulated years of being called an evil-Koch-funded-anti-science-tobacco-lawyer-Holocaust-Denier finally caught up with me.  I wrote something like 3000 words of indignation about climate alarmists corrupting the very definition of science by declaring their work “settled”, answering difficult scientific questions with the equivalent of voting, and telling everyone the way to be pro-science is to listen to self-designated authorities and shut up.  I looked at the draft this morning and while I agreed with everything written, I decided not to publish a whiny ode of victimization.  There are plenty of those floating around already.

And then, out of the blue, I received an email from a stranger.  Last year I had helped to sponsor a proposal to legalize gay marriage in Arizona.  I was doing some outreach to folks in the libertarian community who had no problem with gay marriage (after all, they are libertarians) but were concerned that marriage licensing should not be a government activity at all and were therefore lukewarm about our proposition.  I suppose I could have called them bigots, or homophobic, or in the pay of Big Hetero — but instead I gathered and presented data on the number of different laws, such as inheritance, where rights and privileges were tied to marriage.  I argued that the government was already deeply involved with marriage, and fairness therefore demanded that more people have access to these rights and privileges.  Just yesterday I had a reader send me an email that said, simply, “you changed my mind on gay marriage.”  It made my day.  If only climate discussion could work this way.

So I decided the right way to drive change in the climate debate is not to rant about it but instead to continue to model what I consider good behavior — fact-based discussion and a recognition that reasonable people can disagree without that disagreement implying one or the other has evil intentions or is mean-spirited.

This analysis was originally published about 8 years ago, and there is no longer an online version.  So for fun, I thought I would reproduce my original thought experiment on climate models that led me to the climate dark side.

I have been flattered over time that folks like Matt Ridley have picked up on bits and pieces of this analysis.  See it all here.

Want to Make Your Reputation in Academia? Here is an Important Class of Problem For Which We Have No Solution Approach

Here is the problem:  There exists a highly dynamic, multi- multi- variable system.  One input is changed.  How much, and in what ways, did that change affect the system?

Here are two examples:

  • The government makes a trillion dollars in deficit spending to try to boost the economy.  Did it do so?  By how much? (This Reason article got me thinking about it)
  • Man's actions increase the amount of CO2 in the atmosphere.  We are fairly confident that this has some warming effect, but how how much?  There are big policy differences between the response to a lot and a little.

The difficulty, of course, is that there is no way to do a controlled study, and while one's studied variable is changing, so are thousands, even millions of others.  These two examples have a number of things in common:

  • We know feedbacks play a large role in the answer, but the system is so hard to pin down that we are not even sure of the sign, much less the magnitude, of the feedback.  Do positive feedbacks such as ice melting and cloud formation multiply CO2 warming many times, or is warming offset by negative feedback from things like cloud formation?  Similarly in the economy, does deficit spending get multiplied many times as the money gets respent over and over, or is it offset by declines in other categories of spending like business investment?
  • In both examples, we have recent cases where the system has not behaved as expected (at least by some).  The economy remained at best flat after the recent stimulus.  We have not seen global temperatures increase for 15-20 years despite a lot of CO2 prodcution.  Are these evidence that the hypothesized relationship between cause and effect does not exist (or is small), or simply evidence that other effects independently drove the system in the opposite direction such that, for example, the economy would have been even worse without the stimulus or the world would have cooled without CO2 additions.
  • In both examples, we use computer models not only to predict the future, but to explain the past.  When the government said that the stimulus had worked, they did so based on a computer model whose core assumptions were that stimulus works.  In both fields, we get this sort of circular proof, with the output of computer models that assume a causal relationship being used to prove the causal relationship

So, for those of you who may think that we are at the end of math (or science), here is a class of problem that is clearly, just from these two examples, enormously important.  And we cannot solve it -- we can't even come close, despite the hubris of Paul Krugman or Michael Mann who may argue differently.    We are explaining fire with Phlogiston.

I have no idea where the solution lies.  Perhaps all we can hope for is a Goedel to tell us the problem is impossible to solve so stop trying.  Perhaps the seeds of a solution exist but they are buried in another discipline (God knows the climate science field often lacks even the most basic connection to math and statistics knowledge).

Maybe I am missing something, but who is even working on this?  By "working on it" I do not mean trying to build incrementally "better" economics or climate models.  Plenty of folks doing that.  But who is working on new approaches to tease out relationships in complex multi-variable systems?

Global Warming Updates

I have not been blogging climate much because none of the debates ever change.  So here are some quick updates

  • 67% to 90% of all warming in climate forecasts still from assumptions of strong positive feedback in the climate system, rather than from CO2 warming per se (ie models still assuming about 1 degree in CO2 warming is multiplied 3-10 times by positive feedbacks)
  • Studies are still mixed about the direction of feedbacks, with as many showing negative as positive feedback.  No study that I have seen supports positive feedbacks as large as those used in many climate models
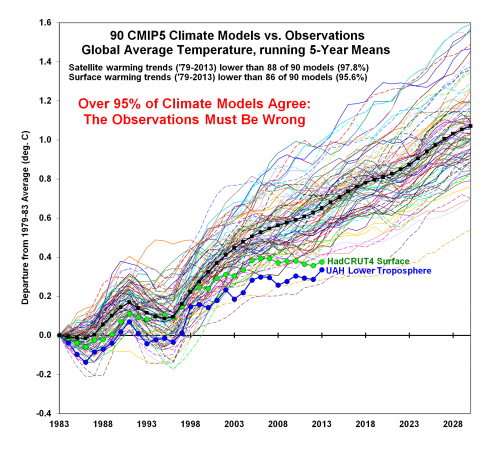
  • As a result, climate models are systematically exaggerating warming (from Roy Spenser, click to enlarge).  Note that the conformance through 1998 is nothing to get excited about -- most models were rewritten after that date and likely had plugs and adjustments to force the historical match.

click to enlarge


  • To defend the forecasts, modellers are increasingly blaming natural effects like solar cycles on the miss, natural effects that the same modellers insisted were inherently trivial contributions when skeptics used them to explain part of the temperature rise from 1978-1998.
  • By the way, 1978-1998 is still the only period since 1940 when temperatures actually rose, such that increasingly all catastrophic forecasts rely on extrapolations from this one 20-year period. Seriously, look for yourself.
  • Alarmists are still blaming every two or three sigma weather pattern on CO2 on global warming (polar vortex, sigh).
  • Even when weather is moderate, media hyping of weather events has everyone convinced weather is more extreme, when it is not. (effect explained in context of Summer of the Shark)
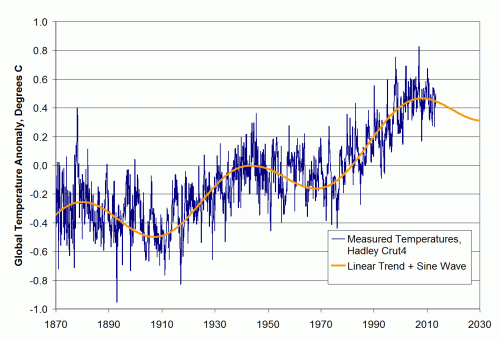
  • My temperature forecast from 2007 still is doing well.   Back in '07 I regressed temperature history to a linear trend plus a sine wave.

click to enlarge

Temperature Trends and the Farmer Error

My dad grew up in farm country in Iowa.  He told me stories of the early days of commodity futures when a number of farmers lost a lot of money betting the wrong way.  The error they made is that they would look at their local weather and assume everyone was experiencing the same.  For example, some guy in Iowa would be experiencing a drought and facing a poor corn crop, and would buy corn futures assuming the crop would be bad everywhere.  Unfortunately, this was often not the case.

A few climate sites have monthly contests to predict the next month's average global temperature anomaly.   Apparently, everyone really missed in the January betting.  Since most of the participants were American, they assumed that really cold weather in the US would translate to falling global temperatures.  They were wrong.  The global temperature anomaly in January actually rose a bit.

This is a variation of the same effect I often point out in the opposite direction -- that heat waves in even seemingly large areas do not necessarily mean anything for global temperatures.  The US is only about 2% of the global surface area (land and ocean) and since the cold spell was in the eastern half of the US, it therefore affected perhaps 1% of the globe.  And remember, on average, some area representing 1% of the globe should constantly be seeing a 100-year high or low for that particular day.  It's just how averages work.

No particularly point here, except to emphasize just how facile it is to try to draw conclusions about global temperature trends from regional weather events.

Marginal Economics Fail

How much more carbon does filling a marginal open seat on a bus produce vs. filling a marginal open seat on an airplane.  My guess is the answer rounds to zero even with a lot of decimal places.

Story here.