The Silicon Valley of Begging

Stephen Dubner's roundtable on the Economics of Street Charity got me thinking about a recent experience visiting Boulder, Colorado, an odd but lovely town in which I used to live.

Here in Phoenix, most of our panhandlers show little or no innovation.  They are still using the "will work for food" or "Vietnam vet" cardboard signs that were an innovation years ago, but now are tired and hard to believe.  All the signs were generic.  None of them seemed tailored to the local audience. 

So where is the innovation in begging occurring?  Someone must have first thought of the "will work for food" come-on which I presume was so initially successful, since everyone copied it, just as they copy any successful innovation in the marketplace?

My vote for the Silicon Valley of Begging is Boulder, Colorado, and specifically on the Pearl Street Mall.  I have recently visited homeless capital Santa Monica, and San Francisco, as well as New York and Boston, and none of their beggers hold a candle to those in Boulder.  Here is why:

  • Their come-ons were unique -- I never saw the same one twice
  • Their come-ons were well tailored to the local audience.  "Need Money for Pot" is not going to get one anywhere in Oklahoma, but it is very likely to elicit a chuckle and a buck from a UC college student or sixties-survivor Boulder resident.  Given that President Bush has about a 0.01% approval rating in Boulder, many of the come-ons led one to believe that giving the beggar a buck would show one's disdain for GWB.

Breaking News: Recent US Temperature Numbers Revised Downwards Today

This is really big news, and a fabulous example of why two-way scientific discourse is still valuable, in the same week that both Newsweek and Al Gore tried to make the case that climate skeptics were counter-productive and evil. 

Climate scientist Michael Mann (famous for the hockey stick chart) once made the statement that  the 1990's were the
warmest decade in a millennia and that "there is a 95 to 99% certainty
that 1998 was the hottest year in the last one thousand years." (By
the way, Mann now denies he ever made this claim, though you can watch him say
these exact words in the CBC documentary Global
Warming:  Doomsday Called Off
).

Well, it turns out, according to the NASA GISS database, that 1998 was not even the hottest year of the last century.  This is because many temperatures from recent decades that appeared to show substantial warming have been revised downwards.  Here is how that happened (if you want to skip the story, make sure to look at the numbers at the bottom).

One of the most cited and used historical surface temperature databases is that of NASA/Goddard's GISS.  This is not some weird skeptics site.  It is considered one of the premier world temperature data bases, and it is maintained by anthropogenic global warming true believers.  It has consistently shown more warming than any other data base, and is thus a favorite source for folks like Al Gore.  These GISS readings in the US rely mainly on the US Historical Climate Network (USHCN) which is a network of about 1000 weather stations taking temperatures, a number of which have been in place for over 100 years.

Frequent readers will know that I have been a participant in an effort led by Anthony Watts at SurfaceStations.org to photo-document these temperature stations as an aid to scientists in evaluating the measurement quality of each station.  The effort has been eye-opening, as it has uncovered many very poor instrument sitings that would bias temperature measurements upwards, as I found in Tucson and Watts has documented numerous times on his blog.

One photo on Watt's blog got people talking - a station in MN with a huge jump in temperature about the same time some air conditioning units were installed nearby.   Others disagreed, and argued that such a jump could not be from the air conditioners, since a lot of the jump happened with winter temperatures when the AC was dormant.  Steve McIntyre, the Canadian statistician who helped to expose massive holes in Michael Mann's hockey stick methodology, looked into it.  After some poking around, he began to suspect that the GISS data base had a year 2000 bug in one of their data adjustments.

One of the interesting aspects of these temperature data bases is that they do not just use the raw temperature measurements from each station.  Both the NOAA (which maintains the USHCN stations) and the GISS apply many layers of adjustments, which I discussed here.  One of the purposes of Watt's project is to help educate climate scientists that many of the adjustments they make to the data back in the office does not necessarily represent the true condition of the temperature stations.  In particular, GISS adjustments imply instrument sitings are in more natural settings than they were in say 1905, an outrageous assumption on its face that is totally in conflict to the condition of the stations in Watt's data base.  Basically, surface temperature measurements have a low signal to noise ratio, and climate scientists have been overly casual about how they try to tease out the signal.

Anyway, McIntyre suspected that one of these adjustments had a bug, and had had this bug for years.  Unfortunately, it was hard to prove.  Why?  Well, that highlights one of the great travesties of climate science.  Government scientists using taxpayer money to develop the GISS temperature data base at taxpayer expense refuse to publicly release their temperature adjustment algorithms or software (In much the same way Michael Mann refused to release the details for scrutiny of his methodology behind the hockey stick).  Using the data, though, McIntyre made a compelling case that the GISS data base had systematic discontinuities that bore all the hallmarks of a software bug.

Today, the GISS admitted that McIntyre was correct, and has started to republish its data with the bug fixed.  And the numbers are changing a lot.  Before today, GISS would have said 1998 was the hottest year on record (Mann, remember, said with up to 99% certainty it was the hottest year in 1000 years) and that 2006 was the second hottest.  Well, no more.  Here are the new rankings for the 10 hottest years in the US, starting with #1:

1934, 1998, 1921, 2006, 1931, 1999, 1953, 1990, 1938, 1939

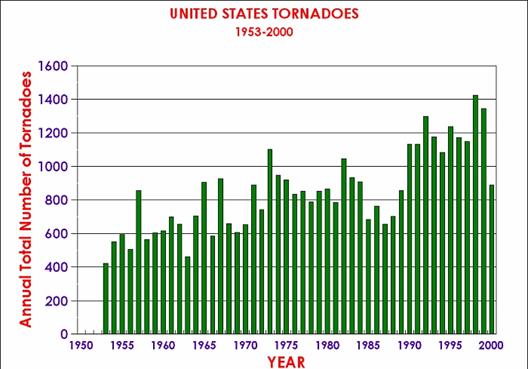
Three of the top 10 are in the last decade.  Four of the top ten are in the 1930's, before either the IPCC or the GISS really think man had any discernible impact on temperatures.  Here is the chart for all the years in the data base:
New_giss

There are a number of things we need to remember:

  • This is not the end but the beginning of the total reexamination that needs to occur of the USHCN and GISS data bases.  The poor correction for site location and urbanization are still huge issues that bias recent numbers upwards.  The GISS also has issues with how it aggregates multiple stations, apparently averaging known good stations with bad stations a process that by no means eliminates biases.  As a first step, we must demand that NOAA and GISS release their methodology and computer algorithms to the general public for detailed scrutiny by other scientists.
  • The GISS today makes it clear that these adjustments only affect US data and do not change any of their conclusions about worldwide data.  But consider this:  For all of its faults, the US has the most robust historical climate network in the world.  If we have these problems, what would we find in the data from, say, China?  And the US and parts of Europe are the only major parts of the world that actually have 100 years of data at rural locations.  No one was measuring temperature reliably in rural China or Paraguay or the Congo in 1900.  That means much of the world is relying on urban temperature measurement points that have substantial biases from urban heat.
  • All of these necessary revisions to surface temperatures will likely not make warming trends go away completely.  What it may do is bring the warming down to match the much lower satellite measured warming numbers we have, and will make current warming look more like past natural warming trends (e.g. early in this century) rather than a catastrophe created by man.  In my global warming book, I argue that future man-made warming probably will exist, but will be more like a half to one degree over the coming decades than the media-hyped numbers that are ten times higher.

So how is this possible?  How can the global warming numbers used in critical policy decisions and scientific models be so wrong with so basic of an error?  And how can this error have gone undetected for the better part of a decade?  The answer to the latter question is because the global warming  and climate community resist scrutiny.  This weeks Newsweek article and statements by Al Gore are basically aimed at suppressing any scientific criticism or challenge to global warming research.  That is why NASA can keep its temperature algorithms secret, with no outside complaint, something that would cause howls of protest in any other area of scientific inquiry.

As to the first question, I will leave the explanation to Mr. McIntyre:

While acolytes may call these guys "professionals", the process of
data adjustment is really a matter of statistics and even accounting.
In these fields, Hansen and Mann are not "professionals" - Mann
admitted this to the NAS panel explaining that he was "not a
statistician". As someone who has read their works closely, I do not
regard any of these people as "professional". Much of their reluctance
to provide source code for their methodology arises, in my opinion,
because the methods are essentially trivial and they derive a certain
satisfaction out of making things appear more complicated than they
are, a little like the Wizard of Oz. And like the Wizard of Oz, they
are not necessarily bad men, just not very good wizards.

For more, please see my Guide to Anthropogenic Global Warming or, if you have less time, my 60-second argument for why one should be skeptical of catastrophic man-made global warming theory.

Update:
Nothing new, just thinking about this more, I cannot get over the irony that in the same week Newsweek makes the case that climate science is settled and there is no room for skepticism, skeptics discover a gaping hole and error in the global warming numbers.

Update #2:  I know people get upset when we criticize scientists.  I get a lot of "they are not biased, they just made a mistake."  Fine.  But I have zero sympathy for a group of scientists who refuse to let other scientists review their methodology, and then find that they have been making a dumb methodology mistake for years that has corrupted the data of nearly every climate study in the last decade.

Update #3:  I labeled this "breaking news," but don't expect to see it in the NY Times anytime soon.  We all know this is one of those asymmetric story lines, where if the opposite had occurred (ie things found to be even worse/warmer than thought) it would be on the front page immediately, but a lowered threat will never make the news.

Oh, and by he way.  This is GOOD news.  Though many won't treat it that way.  I understand this point fairly well because, in a somewhat parallel situation, I seem to be the last anti-war guy who treats progress in Iraq as good news.

Update #4: I should have mentioned that the hero of the Newsweek story is catastrophic man-made global warming cheerleader James Hansen, who runs the GISS and is most responsible for the database in question as well as the GISS policy not to release its temperature aggregation and adjustment methodologies.  From IBD, via CNN Money:

Newsweek portrays James Hansen, director of NASA's Goddard Institute for Space Studies, as untainted by corporate bribery.

Hansen
was once profiled on CBS' "60 Minutes" as the "world's leading
researcher on global warming." Not mentioned by Newsweek was that
Hansen had acted as a consultant to Al Gore's slide-show presentations
on global warming, that he had endorsed John Kerry for president, and
had received a $250,000 grant from the foundation headed by Teresa
Heinz Kerry.

Update #5: My letter to the editor at Newsweek.  For those worried that this is some weird skeptic's fevered dream, Hansen and company kind of sort of recognize the error in the first paragraph under background here.  Their US temperature chart with what appears is the revised data is here.

Update #6: Several posts are calling this a "scandal."  It is not a scandal.  It is a mistake from which we should draw two lessons:

  1. We always need to have people of opposing opinions looking at a problem.  Man-made global warming hawks expected to see a lot of warming after the year 2000, so they never questioned the numbers.  It took folks with different hypotheses about climate to see the jump in the numbers for what it was - a programming error.
  2. Climate scientists are going to have to get over their need to hold their adjustments, formulas, algorithms and software secret.  It's just not how science is done.  James Hansen saying "trust me, the numbers are right, I don't need to tell you how I got them" reminds me of the mathematician Fermat saying he had a proof of his last theorem, but it wouldn't fit in the margin.  How many man-hours of genius mathematicians was wasted because Fermat refused to show his proof (which was most likely wrong, given how the theorem was eventually proved).

Final Update:  Some parting thoughts, and recommendations, here.

Food Miles Stupidity

Via the New York Times:

THE term "food miles" "” how far food has traveled before you buy it "” has entered the enlightened lexicon.

Which should tell you all you need to know about the "enlightened."

There are many good reasons for eating local "” freshness, purity,
taste, community cohesion and preserving open space "” but none of these
benefits compares to the much-touted claim that eating local reduces
fossil fuel consumption. In this respect eating local joins recycling,
biking to work and driving a hybrid as a realistic way that we can, as individuals, shrink our carbon footprint and be good stewards of the environment.

Actually, most recycling, with the exception of aluminum which takes tons of electricity to manufacture in the first place, does nothing to reduce our carbon footprint.  And I must say that I often enjoy buying from farmers markets and such.  But does "food miles" mean anything?  And should we really care?  Well, here is an early hint:  The ultimate reduction in food miles, the big winner on this enlightened metric, is subsistence farming.  Anyone ready to go there yet?  These are the economics Ghandi promoted in India, and it set that country back generations.

Well, lets go back to economics 101.  The reason we do not all grow our own food, make our own clothes, etc. is because the global division of labor allows food and clothing and everything else to be produced more efficiently by people who specialize and invest in those activities than by all of us alone in our homes.  So instead of each of us growing our own corn, in whatever quality soil we happen to have around our house, some guy in Iowa grows it for thousands of us, and because he specialized and grows a lot, he invests in equipment and knowledge to do it better every year.  The cost of fuel to move the corn or corn products to Phoenix from Iowa are trivial compared to the difference in efficiency that guy in Iowa has over me trying to grow corn in my back yard.  Back to the New York Times:

On its face, the connection between lowering food miles and decreasing greenhouse gas emissions is a no-brainer.

Sure, if you look at complex systems as single-variable linear equations.  Those of us who don't immediately treated the food mile concept as suspect.  It turns out, for good reason:

It all depends on how you wield the carbon calculator. Instead of
measuring a product's carbon footprint through food miles alone, the
Lincoln University scientists expanded their equations to include other
energy-consuming aspects of production "” what economists call "factor
inputs and externalities" "” like water use, harvesting techniques,
fertilizer outlays, renewable energy applications, means of
transportation (and the kind of fuel used), the amount of carbon
dioxide absorbed during photosynthesis, disposal of packaging, storage
procedures and dozens of other cultivation inputs.

Incorporating
these measurements into their assessments, scientists reached
surprising conclusions. Most notably, they found that lamb raised on
New Zealand's clover-choked pastures and shipped 11,000 miles by boat
to Britain produced 1,520 pounds of carbon dioxide emissions per ton
while British lamb produced 6,280 pounds of carbon dioxide per ton, in
part because poorer British pastures force farmers to use feed. In
other words, it is four times more energy-efficient for Londoners to
buy lamb imported from the other side of the world than to buy it from
a producer in their backyard. Similar figures were found for dairy
products and fruit.

All I can say is just how frightening it is that the paper of record could find this result "surprising."  The price mechanism does a pretty good job of sorting this stuff out.  If fuel prices rise a lot, then agriculture might move more local, but probably not by much.  The economies to scale and location just dwarf the price of fuel. 

By the way, one reason this food-mile thing is not going away, no matter how stupid it is, has to do with the history of the global warming movement.  Remember all those anti-globalization folks who rampaged in Seattle?  Where did they all go?  Well, they did not get sensible all of a sudden.  They joined the environmental movement.  One reason a core group of folks in the catastrophic man-made global warming camp react so poorly to any criticism of the science is that they need and want it to be true that man is causing catastrophic warming -- anti-corporate and anti-globalization activists jumped into the global warming environmental movement, seeing in it a vehicle to achieve their aims of rolling back economic growth, global trade, and capitalism in general.  Food miles appeals to their disdain for world trade, and global warming and carbon footprints are just a convenient excuse for trying to sell the concept to other people.

A little while back, I posted a similar finding in regards to packaging, that is worth repeating here for comparison.

Contrary to current wisdom, packaging can reduce total rubbish
produced. The average household in the United States generates one
third
less trash each year than does the average household in Mexico,
partly because packaging reduces breakage and food waste. Turning a
live chicken into a meal creates food waste. When chickens are
processed commercially, the waste goes into marketable products
(such as pet food), instead of into a landfill. Commercial processing
of 1,000 chickens requires about 17 pounds of packaging, but it also
recycles at least 2,000 pounds of by-products.

More victories for the worldwide division of labor.  So has the NY Times seen the light and accepted the benefits of capitalism?  Of course not.  With the New Zealand example in hand, the writer ... suggests we need more state action to compel similar situations.

Given these problems, wouldn't it make more sense to stop obsessing
over food miles and work to strengthen comparative geographical
advantages? And what if we did this while streamlining transportation
services according to fuel-efficient standards? Shouldn't we create
development incentives for regional nodes of food production that can
provide sustainable produce for the less sustainable parts of the
nation and the world as a whole? Might it be more logical to
conceptualize a hub-and-spoke system of food production and
distribution, with the hubs in a food system's naturally fertile hot
spots and the spokes, which travel through the arid zones, connecting
them while using hybrid engines and alternative sources of energy?

Does anyone even know what this crap means?  You gotta love technocratic statists -- they just never give up.  Every one of them thinks they are smarter than the the sum of billions of individual minds working together of their own free will to create our current world production patterns.

Postscript: There is one thing the government could do tomorrow to promote even more worldwide agricultural efficiency:  Drop subsidies and protections on agriculture.   You would immediately get more of this kind of activity, for example with Latin America and the Caribbean supplying more/all of the US's sugar and other parts of Asia providing more/all of Japan's rice.

Competitor or Enemy

I heard Obama get asked a question at the AFL-CIO yesterday whether he thought China was a competitor or an enemy.  I am not very good at parsing politician-speak, but he seemed to answer "both." 

How about neither?  Let's try "partner in the worldwide division of labor" or maybe "home of a billion people who would like to trade with us 300 million individuals to our mutual self interest."   Or maybe "One reason we have full employment AND low prices."

Our trade with Canada is 60% higher than with China.  Does that make them an enemy?  Yes, for some of the Democratic candidates.

Wherein I Answer Lou Dobbs and Suspect He Is A Chinese Agent

It is always dangerous to argue with the insane, but I am actually willing to answer Lou Dobbs question:

And what I can't quite figure out amongst these geniuses who are
so-called free traders is, why do they think that about a 35 percent to
40 percent undervaluation of the Chinese yuan to the dollar is free
trade? Why do they think 25 percent duties in tariffs on American
products entering China is free trade?

I will leave aside the question of how he or anybody else knows the yuan is undervalued by this much.  I will accept his premise on the basis that we know the Chinese government spends money to keep the yuan lower than it might be otherwise.  Here is my answer:

Yes, it is not perfectly free trade.  But we let it continue because the freaking Chinese government, its consumers, and its taxpayers are subsidizing Americans.  The Chinese government is making all of its consumers pay higher prices and higher taxes just so American consumers can have lower prices.  Napoleon advised that one never should interrupt an enemy when he is making a mistake -- after all, this same strategy managed to earn Japan a decade and a half long recession.  Our correct response is not tariffs, it is to say, "gee, thanks."  This is for the Chinese people to stop, not our government. 

Why is China doing this?  Because it government is using monetary policy to help out a few favored exporters who have political influence at the expense of all of their consumers and exporters.  And Lou Dobbs wants the US to respond exactly the same way, to punish our consumers to favor some of our favored politically-connected exporters so the Chinese consumers can have lower prices.  Great plan.  Is Lou Dobbs an Chinese agent?

Storm Frequency

I already discussed Newsweek's happy little ad hominem attack on climate skeptics here.  However, as promised, I wanted to talk about the actual, you know, science for a bit, starting from the Newsweek author's throwaway statement that she felt required no
proof, "The frequency of Atlantic hurricanes has already doubled in the
last century."

This is really a very interesting topic, much more interesting than following $10,000 of skeptics' money around in a global warming industry spending billions on research.  One would think the answer to this hurricane question is simple.  Can we just look up the numbers?  Well, let's start there.  Total number of Atlantic hurricanes form the HURDAT data base, first and last half of the last century:

1905-1955 = 366
1956-2006 = 458

First, you can see nothing like a doubling.  This is an increase of 25%.  So already, we see that in an effort to discredit skeptics for fooling America about the facts, Newsweek threw out a whopper that absolutely no one in climate science, warming skeptic or true believer, would agree with.

But let's go further, because there is much more to the story.  Because 25% is a lot, and could be damning in and of itself.  But there are problems with this data.  If you think about storm tracking technology in 1905 vs. 2005, you might see the problem.  To make it really clear, I want to talk about tornadoes for a moment.

In An Inconvenient Truth, Al Gore and company said that global warming was increasing the number of tornadoes in the US.  He claimed 2004 was the highest year ever for tornadoes in the US.  In his PowerPoint slide deck (on which the movie was based) he sometimes uses this chart (form the NOAA):

Whoa, that's scary.  Any moron can see there is a trend there.  Its like a silver bullet against skeptics or something.  But wait.  Hasn't tornado detection technology changed over the last 50 years?  Today, we have doppler radar, so we can detect even smaller size 1 tornadoes, even if no one on the ground actually spots them (which happens fairly often).  But how did they measure smaller tornadoes in 1955 if no one spotted them?  Answer:  They didn't.  In effect, this graph is measuring apples and oranges.  It is measuring all the tornadoes we spotted by human eye in 1955 with all the tornadoes we spotted with doppler radar in 2000.   The NOAA tries to make this problem clear on their web site.

With increased national doppler
radar coverage, increasing population, and greater attention to tornado
reporting, there has been an increase in the number of tornado reports over the
past several decades. This can create a misleading appearance of an increasing
trend in tornado frequency. To better understand the true variability and trend
in tornado frequency in the US, the total number of strong to violent tornadoes
(F3 to F5 category on the Fujita scale) can be analyzed. These are the
tornadoes that would have likely been reported even during the decades before
Dopplar radar use became widespread and practices resulted in increasing
tornado reports. The bar chart below indicates there has been little trend in
the strongest tornadoes over the past 55 years.

So itt turns out there is a decent way to correct for this.  We don't think that folks in 1955 were missing many of the larger class 3-5 tornadoes, so comparing 1955 and 2000 data for these larger tornadoes should be more apples to apples (via NOAA).

Well, that certainly is different (note 2004 in particular, given the movie claim).  No upward trend at all when you get the data right.  I wonder if Al Gore knows this?  I am sure he is anxious to set the record straight.

OK, back to hurricanes.  Generally, whether in 1905 or 2005, we know if a hurricane hits land in the US.  However, what about all the hurricanes that don't hit land or hit land in some undeveloped area?  Might it be that we can detect these better in 2006 with satellites than we could in 1905?  Just like the tornadoes?

Well, one metric we have is US landfall.  Here is that graph  (data form the National Weather Service -- I have just extrapolated the current decade based on the first several years).

Not much of a trend there, though the current decade is high, in part due to the fact that it does not incorporate the light 2006 season nor the light-so-far 2007 season.  The second half of the 20th century is actually lower than the first half, and certainly not "twice as large".  But again, this is only a proxy.  There may be reasons more storms are formed but don't make landfall (though I would argue most Americans only care about the latter).

But what about hurricane damages?  Everyone knows that the dollar damages from hurricanes is way up.  Well, yes.  But the amount of valuable real estate on the United State's coast is also way up.  Roger Pielke and Chris Landsea (you gotta love a guy studying hurricane strikes named Landsea) took a shot at correcting hurricane damages for inflation and the increased real estate value on the coasts.  This is what they got:

Anyway, back to our very first data, several scientists are trying to correct the data for missing storms, particularly in earlier periods.  There is an active debate here about corrections I won't get into, but suffice it to say the difference between the first half of the 20th century to the latter half in terms of Atlantic hurricane formations is probably either none or perhaps a percentage increase in the single digits (but nowhere near 100% increase as reported by Newsweek).

Debate continues, because there was a spike in hurricanes from 1995-2005 over the previous 20 years.  Is this anomalous, or is it similar to the spike that occurred in the thirties and forties?  No one is sure, but isn't this a lot more interesting than figuring out how the least funded side of a debate gets their money?  And by the way, congratulations again to MSM fact-checkers.

My layman's guide to skepticism of catastrophic man-made global warming is here.  A shorter, 60-second version of the best climate skeptic's arguments is here.

Update:  If the author bothered to have a source for her statement, it would probably be Holland and Webster, a recent study that pretty much everyone disagrees with and many think was sloppy.  And even they didn't say activity had doubled.  Note the only way to get a doubling is to cherry-pick a low decade in the first half of the century and a high decade in the last half of the century and compare just those two decades -- you can see this in third paragraph of the Scientific American article.  This study bears all the hallmarks -- cherry picking data, ignoring scientific consensus, massaging results to fit an agenda -- that the Newsweek authors were accusing skeptics of.

Update #2:  The best metric for hurricane activity is not strikes or numbers but accumulated cyclonic energy.  Here is the ACE trend, as measured by Florida State.  As you can see, no upward trend.

6a00e54eeb9dc1883400e553bfddf188338

I Was Teenage Warming-Denying Werewolf

Update:  My post on breaking news about downward revisions to US temperature numbers is here.

Well, I finally read Newsweek's long ad hominem attack on climate skeptics in the recent issue.  It is basically yet another take on the global-warming-skeptics-are-all-funded-by-Exxon meme.  The authors breathlessly "follow the money to show how certain scientists have taken as much as $10,000 (gasp) from fossil-fuel related companies to publish skeptical work.  Further, despite years of hand-wringing about using emotionally charged words like "terrorist" in their news articles, Newsweek happily latches onto "denier" as a label for skeptics, a word chosen to parallel the term "Holocaust denier" -- nope, no emotional content there.

I'm not even going to get into it again, except to make the same observation I have made in the past:  Arguing that the global warming debate is "tainted" by money from skeptics is like saying the 2008 presidential election is tainted by Mike Gravel's spending.  Money from skeptics is so trivial, by orders of magnitude, compared to spending by catastrophic warming believers that it is absolutely amazing folks like Newsweek could feel so threatened by it.  In my Layman's Guide To Man-Made Global Warming Skepticism, I estimated skeptics were being outspent 1000:1.  I have no way to check his figures, but Senator Inhofe's office estimated skeptics were being outspent $50 billion to 19 million, which is about the same order of magnitude as my estimate.

Given this skew in spending, and the fact that most of the major media accepts catastrophic man-made  global warming as a given, this was incredible:

Look for the next round of debate to center on what Americans are
willing to pay and do to stave off the worst of global warming. So far
the answer seems to be, not much. The NEWSWEEK Poll finds less than half in favor of requiring high-mileage cars or energy-efficient appliances and buildings....

Although the figure is less than in earlier polls, A new NEWSWEEK Poll finds that the influence of the denial machine remains strong.39
percent of those asked say there is "a lot of disagreement among
climate scientists" on the basic question of whether the planet is
warming; 42 percent say there is a lot of disagreement that human
activities are a major cause of global warming. Only 46 percent say the
greenhouse effect is being felt today.

It has to be the "denial machine" at fault, right?  I can't possibly be because Americans think for themselves, or that they tend to reject micro-managing government regulations.  The author sounds so much like an exasperated parent "I kept telling my kids what's good for them and they just don't listen."

Yes, I could easily turn the tables here, and talk about the financial incentives in academia for producing headlines-grabbing results, or discuss the political motivations behind Marxist groups who have latched onto man-made global warming for their own ends.  But this does not really solve the interesting science questions, and ignores the fact that many catastrophic climate change believers are well meaning and thoughtful, just as many skeptics are.  The article did not even take the opportunity to thoughtfully discuss the range of skeptic's positions.  Some reject warming entirely, while others, like myself, recognize the impact man can have on climate, but see man's impact being well below catastrophic levels (explained here in 60 seconds).  Anyway, I don't have the energy to fisk it piece by piece, but Noel Sheppard does.

For those of you who are interested, I have a follow-up post on the science itself, which is so much more interesting that this garbage.  I use as a starting point the Newsweek author's throwaway statement that she felt required no proof, "The frequency of Atlantic hurricanes has already doubled in the last century."  (Hint:  the answer turns out to be closer to +5% than +100%)

Bloggers Union

A number of folks are getting a good chuckle out of the suggestion from YearlyKos that bloggers form a union.  Many, like John Scalzi, have asked, why?

I think folks are missing the point.  At its heart, those making this suggestion are not bloggers who want to be in a union, these
are people who want to run a union of bloggers. They want the power and prestige
that comes from being able to say "I represent the International
Brotherhood of Bloggers." They are trying to channel the dispersed
power of bloggers and the trendiness of blogging (such that it is) and
aggregate it to themselves.

I Too Want A Big Picture Job

TJIC has a great link to an article about a guy who doesn't want to grub around in the details, but wants a job to help a company see the big picture and move forward.  LOL.  I can't tell you how many times I get a request for that job.  People are always saying they want a job doing "business development**" or "coordination" or "performance reviews."  The common denominator when I ask people to explain to me what these jobs actually would do is that they involve driving around a lot to different recreation sites I run or might run and "checking things out."

I tell people there is no such job.  I tell them I don't have that job, and I own the company.   It's a TV-inspired view of business, like Dynasty or Dallas, where the protagonists run around and do all kinds of stuff that doesn't look like real work.

Yeah, I get to enjoy some perks now and do some cool stuff running my company.  But how did I get here?   Well, the whole story is too boring to tell, but here is one vignette:  In March of 2003 I spent about 6 straight 90-hour weeks trying to get my new company registered on the fly in 12 states and about 30 counties for tax withholding, sales tax, occupancy licenses, unemployment taxes, workers compensation, and even egg licenses just so I could use the assets I just purchased.  This was at the same time I was programming some add-ons to Quickbooks so the finances could be tracked and setting up some of our first web sites.  All while I tried to keep an unfamiliar company running.  And, oh yeah, while I was thinking all that big picture stuff.  Yes, I think about the big picture - and in fact, I have radically reshaped the positioning of this company over the past five years.  But that is what you do in the shower or on the stationary bike.

I don't explain all of this, of course, I just tell people that I don't have a big picture job to offer them.   TJIC, as usual, is a bit more direct:

Or, phrased another way: you're a useless drama queen who - instead of
compromising your principals and taking a job that doesn't match the
job title you want, and then growing the job position around your
abilities - you'd rather stay home and live off your wife's salary.

** The world's one great moment for such jobs was in the late 90's Internet craze, when every soon-to-be-on-FuckedCompany.com startup employed hordes of business development guys who ran around making grand press-release inducing deals that generated absolutely no money.  "Let's trade our proprietary online merchant services framework no one wants to buy for your proprietary online price management algorithm no one wants to buy.  OK, cool."  When I came into the waning stages of several such companies, the first thing I did was blow all these guys away, followed by a quick inventory of our soft and hard assets to see if we actually had anything anyone wanted to, you know, pay money for.  I still think the whole IT world is tainted by the memory of these glory days for produce-nothings.  Everyone wants to be Steve Jobs without having to actually first produce a salable new technology with their own hands in their garage.

Let's Make Sure Politicians Have NO Real World Experience

Via Cato and IBD:

Sen. Hillary Clinton says she wants to establish a national academy
that will train public servants. Why do re-education camps come to
mind? "¦ Somehow we doubt there will be many lectures in making
government smaller, deregulating business, cutting taxes or increasing
individual freedom. Is there a chance that this "new generation"
attending the academy will hear a single voice that isn't hailing the
glories of the nanny state? Will students being groomed for public
service ever hear the names Hayek, von Mises or Friedman during their
studies? "¦ Government at all levels is already overflowing with
bureaucrats who suck up taxpayers' money and produce little, if
anything, of economic value. More often, the bureaucracy actually gets
in the way of economic progress.

This way, government employees can know absolutely nothing about the real world or productive enterprise, and never have to be burdened with listening to anyone in school who doesn't think government is the be-all end-all, kind of like, uh, Hillary Clinton.

Democrats and Republicans United In Grabbing Power

This weekend, the Democrats in Congress passed legislation legalizing the Administration's previous grab for new wiretapping powers.  Further proving that the minority party in the US government does not really object to power grabs, they just get in a huff that the other party thought of it first.  Other examples of such behavior include the Patriot act, currently supported by Republicans and opposed by many Democrats, but most of whose provisions were originally proposed by Bill Clinton and opposed by a Republican Congress  (opposition led by John Ashcroft!)

I really don't want the president, of either party, listening to my phone calls without a warrant, and that answer does not change if I am talking  to my friends in Arizona or my friends in London.

John Scalzi has a great post reacting to the line in the article above where Democrats vow to, at some time in the future, "fix" the flaws in the law they just passed.

They wouldn't have to "fix" it if they hadn't have passed it.
Once again I am entirely flummoxed how it is that the Democrats, faced
with the president more chronically unpopular than Nixon, and so
politically weakened that the GOP candidates for president can barely
bring themselves to acknowledge that he exists, yet manage to get played by the man again and again.

If the Democrats honestly did not feel this version of the bill
should have been passed, they shouldn't have passed it. I don't see why
this is terribly complicated. And don't tell me that at least it has a
six-month "sunset" clause; all it means at this point is that in six
months, the Democrats are going to allow themselves to get played once
more, and this time they'll have given Bush the talking point of "well,
they passed it before."

My only objection to this statement is the implication the this is just a matter of the Democrats getting played.  I actually think it's exactly what the Democrats want -- they want to retain a reputation for caring about government intrusiveness without actually reducing government powers (just like Republicans want a reputation for reducing economic regulations without actually doing do when they were in power).  After all, the Dems expect to control the administration in 2 years, and they really don't want to take away any of the President's toys before that time.

Oil Trading Conspiracy -- To Reduce Prices?

A while back, I talked about a conversation I had with a friend of mine that prices for oil were set $20 dollars or more above the natural clearing price because a few oil traders controlled the market.  I argued in a long post that this was absurd, and might be possible for a few minutes in the trading day, but over multiple years it would be just impossible either to store the extra oil supply or hide the efforts to suppress supply from thousands of sources.

Well, another argument I made is that buyers in the oil markets are big boys too, and would not tolerate paying $20 a barrel too much for years or even hours.  After all, it was silver buyers and the exchange owners who stopped the Hunt's famous attempt to corner the silver market.

Anyway, one proof of this latter proposition is this
:

The alleged manipulation occured during the so-called "Platts window,"
a 30 minute interval at the end of the trading day when the energy
publishing firm Platts pulls data used to set prices for other foreign
and domestic crudes. CFTC said Marathon tried to sell oil below market
prices during the window in order to get a lower price set for oil it
intended to purchase.

Again note the timing -- trying to influence the market for minutes, not years.  If companies like Marathon are willing to risk criminal prosecution to get lower oil prices for purchase, they certainly are not going to sit back and tolerate a multi-year manipulation that raises prices $20.

Adjusting Data to Get the "Right" Answer

On several occasions, I have discussed how much of the reported temperature increases worldwide in the last century are actually the results of adjustments to the actual gauge measurements.  These upward adjustments in the numbers by climate scientists actually dwarf measured increases.

Thanks to reader Scott Brooks, here is another such example except this time with measurement of sea level increases.  Dr. Nils-Axel Morner is the head of the Paleogeophysics and Geodynamics department at Stockholm University in Sweden.  He has studied sea-level changes for 35 years (emphasis added).

Another
way of looking at what is going on is the tide gauge. Tide gauging is
very complicated, because it gives different answers for wherever you
are in the world. But we have to rely on geology when we interpret it.
So, for example, those people in the IPCC [Intergovernmental Panel on
Climate Change], choose Hong Kong, which has six tide gauges, and they
choose the record of one, which gives 2.3 mm per year rise of sea
level. Every geologist knows that that is a subsiding area. It's the
compaction of sediment; it is the only record which you shouldn't use.
And if that figure [for sea level rise] is correct, then Holland would not be subsiding, it
would be uplifting.

And
that is just ridiculous. Not even ignorance could be responsible for a
thing like that. So tide gauges, you have to treat very, very
carefully. Now, back to satellite altimetry, which shows the water, not
just the coasts, but in the whole of the ocean. And you measure it by
satellite. From 1992 to 2002, [the graph of the sea level] was a
straight line, variability along a straight line, but absolutely no
trend whatsoever. We could see those spikes: a very rapid rise, but
then in half a year, they fall back again. But absolutely no trend, and
to have a sea-level rise, you need a trend.

Then,
in 2003, the same data set, which in their [IPCC's] publications, in
their website, was a straight line suddenly it changed, and showed a
very strong line of uplift, 2.3 mm per year, the same as from the tide
gauge. And that didn't look so nice. It looked as though they had
recorded something; but they hadn't recorded anything. It was the
original one which they had suddenly twisted up, because they entered a correction factor, which they took from the tide gauge.
So it was not
a measured thing, but a figure introduced from outside.
I accused them
of this at the Academy of Sciences in Moscow I said you have
introduced factors from outside; it's not a measurement. It looks like
it is measured from the satellite, but you don't say what really
happened. And they ans-wered, that we had to do it, because otherwise
we would not have gotten any trend!

That
is terrible! As a matter of fact, it is a falsification of the data
set. Why? Because they know the answer. And there you come to the
point: They know the answer; the rest of us, we are searching for the
answer. Because we are field geologists; they are computer scientists.
So all this talk that sea level is rising, this stems from the computer
modeling, not from observations. The observations don't find it!

I have
been the expert reviewer for the IPCC, both in 2000 and last year. The
first time I read it, I was exceptionally surprised. First of all, it
had 22 authors, but none of them  none were sea-level specialists. They
were given this mission, because they promised to answer the right
thing. Again, it was a computer issue. This is the typical thing: The meteorological community works with computers, simple computers.

Geologists
don't do that! We go out in the field and observe, and then we can try
to make a model with computerization; but it's not the first thing.

I am working on my next version of a layman's guide to skeptics arguments against catastrophic man-made global warming, which you can find here.

Arizona: Saving Northerner's Lives Since 1912

New study results, via Tyler Cowen:

We estimate the effect of extreme weather on life expectancy in the US. ... However, the
increase in mortality following extreme heat appears entirely driven by
temporal displacement, while the increase in mortality following
extreme cold is long lasting. The aggregate effect of cold on mortality
is quantitatively large. We estimate that the number of annual deaths
attributable to cold temperature is 27,940 or 1.3% of total deaths in
the US. This effect is even larger in low income areas. Because the
U.S. population has been moving from cold Northeastern states to the
warmer Southwestern states, our findings have implications for
understanding the causes of long-term increases in life expectancy. We
calculate that every year, 5,400 deaths are delayed by changes in
exposure to cold temperature induced by mobility.
These longevity gains
associated with long term trends in geographical mobility account for
8%-15% of the total gains in life expectancy experienced by the US
population over the past 30 years
. Thus mobility is an important but
previously overlooked determinant of increased longevity in the United
States. We also find that the probability of moving to a state that has
fewer days of extreme cold is higher for the age groups that are
predicted to benefit more in terms of lower mortality compared to the
age groups that are predicted to benefit less.

Your welcome, America. 

Time to Switch From Meese's to Gipper's

From Daniel Griswold at Cato:

One sure sign of a hyperinflation is that the central bank must
issue new currency notes in ever higher denominations so that people
won't have to carry bags or wheelbarrows of money around to make
everyday purchases. Sure enough, the government of Zimbabwe is now
wrestling with that very question. According to the FT story:

The launch yesterday of a new large-denomination bank
note of Z$200,000"”worth [US$13] at the official exchange rate and
[US$1.30] at the more realistic parallel rate"”underlines the disarray.
The central bank had wanted to issue a Z$500,000 note, but a bank
official said this was vetoed by the finance ministry because senior
staff thought such a large denomination would have reinforced an
impression that inflation was out of control.

At a 13,000 percent rate, that cat is probably already out of the bag.

What a mess.  Explanation of the post title here.

Steve McIntyre Comments on Historical Temperature Adjustments

Steve McIntyre, the statistician than called into question much of the methodology behind the Mann Hockey Stick chart, has some observations on adjustments to US temperature records I discussed here and here.

Eli Rabett and Tamino have both advocated faith-based climate
science in respect to USHCN and GISS adjustments. They say that the
climate "professionals" know what they're doing; yes, there are
problems with siting and many sites do not meet even minimal compliance
standards, but, just as Mann's "professional" software was able to
extract a climate signal from the North American tree ring data, so
Hansen's software is able to "fix" the defects in the surface sites.
"Faith-based" because they do not believe that Hansen has any
obligation to provide anything other than a cursory description of his
software or, for that matter, the software itself. But if they are
working with data that includes known bad data, then critical
examination of the adjustment software becomes integral to the
integrity of the record - as there is obviously little integrity in
much of the raw data.

While acolytes may call these guys "professionals", the process of
data adjustment is really a matter of statistics and even accounting.
In these fields, Hansen and Mann are not "professionals" - Mann
admitted this to the NAS panel explaining that he was "not a
statistician". As someone who has read their works closely, I do not
regard any of these people as "professional". Much of their reluctance
to provide source code for their methodology arises, in my opinion,
because the methods are essentially trivial and they derive a certain
satisfaction out of making things appear more complicated than they
are, a little like the Wizard of Oz. And like the Wizard of Oz, they
are not necessarily bad men, just not very good wizards.

He goes on to investigate a specific example the "professionals" use
as a positive example, demonstrating they appear to have a Y2K error in
their algorithm.   This is difficult to do, because like Mann, government scientists maintaining a government temperature data base taken from government sites paid for with taxpayer funds refuse to release their methodology or algorithms for inspection.

In the case cited, the "professionals" also make adjustments that imply the site has
decreasing urbanization over the last 100 years, something I am not
sure one can say about any site in the US except perhaps for a few
Colorado ghost towns.  The "experts" also fail to take the basic step of actually analyzing the site itself which, if visited, would reveal recently installed air conditioning unites venting hot air on the temperature instrument.   

A rebuttal, arguing that poor siting of temperature instruments is OK and does not affect the results is here.  I find rebuttals of this sort really distressing.  I studied physics for a while, before switching to engineering, and really small procedural mistakes in measurement could easily invalidate one's results.  I find it amazing that climate scientists seek to excuse massive mistakes in measurement.  I'm sorry, but in no other branch of science are results considered "settled" when the experimental noise is greater than the signal.  I would really, really, just for once, love to see a anthropogenic global warming promoter say "well, I don't think the siting will change the results, but you are right, we really need to go back and take another pass at correcting historical temperatures based on more detailed analysis of the individual sites."

State Run Medicine: Bureaucrat Salaries Trump Patients

Italian Daniele Capezzone writes in the WSJ($):

This situation is especially dire in Italy. The
government has capped spending on pharmaceuticals at 13% of total
health-care expenditures while letting expenses for infrastructure and
staff skyrocket. From 2001 to 2005, general health expenses in Italy
grew by 31% while expenditure on medicines increased a mere 1.7%.
Italian patients might well have been better off if the reverse was the
case, but the state bureaucrats who make these decisions refuse to
acknowledge the benefits of advanced drugs....

Part of the problem is that regional authorities
manage most of Italy's health-care spending. A strike by health-care
personnel has an immediate impact on the region, but the consequences
of cutting the budget for medicines are only felt in the long term and
distributed across the nation. Hence, local authorities continue to
focus on personnel and infrastructure in an age when medical research
has become the most efficient way to improve public health.

Gee, government officials more concerned about raising government salaries than performance?  Couldn't possibly happen in the US, could it?  This is classic government management -- freeze or reduce expenses that actually provide customer service, and raise administrative costs and salaries many times faster than inflation.  This is exactly what has happened in public schools, as infrastructure and teaching aid investments have been deferred in favor of raising salaries and adding untold number of vice-principals and administrators to every school.

But the government is focused on the long-term while greedy old for-profits are short-term focused.  Right?

Unfortunately, most of today's cutting-edge research is conducted
outside Europe, which was once a pioneer in this field. About 78% of
global biotechnology research funds are spent in the U.S., compared to
just 16% in Europe. Americans therefore have better access to modern
drugs. One result is that in the U.S., the annual death rate from
cancer is 196 per 100,000 people, compared to 235 in Britain, 244 in
France, 270 in Italy and 273 in Germany.

Update:  Ronald Bailey points out that drug re importation is just a way to impose drug price controls in the US, effectively applying the most aggressive price-control regime for each drug worldwide to US prices.  Right now, drug companies tolerate price controls set as much as 2/3 under US prices or more because they can still make money at the margin, because the marginal cost of drug production is so much lower than the total cost with R&D, etc. included.  However, they cannot survive at these prices applied to US demand.  Remember, drug companies have profits margins averaging in the 18-20% range.  Perhaps you might argue they should only be making 10%, but that only gives you room for an imposed 10% price cut, not the huge cuts politicians would like.  And you would get that only at tremendous costs in terms of lost freedoms and demolished incentives for new drug development.

"Snuggles" at One

My daughter's white Maltese, embarrassingly named "Snuggles," just turned one.  Sorry we didn't really clean her up for her birthday pictures  (click to enlarge)

Snugs3

Snugs4

Update, in which I am chastised by my daughter:  I quote from my email this morning,

Why do you always have to talk about snuggles name??????? You say how
embarrassing it is and people laugh. Good for you, you make people laugh all
the time. It is funny to everyone but me. How do you think I feel,
with people laughing at me for naming snuggs that name ??? bad

OK, sorry hon.  Snuggles is actually a perfect name for this dog, who loves nothing more than to just sit in your lap.   Yes, Darwin, cuteness is a survival trait.  And Snuggles is the only other mammal in my household who will go running 3 miles with me, even when it is over 100 degrees out, and despite the fact she has a fur coat and the shortest legs by several orders of magnitude.  And, of course, beware to all intruders who run into this formidable home defense unit.

Ethanol Get's Slammed

Finally, the blinders are coming off and the media is starting to
wake up to the absolute travesty that is the Congress's promotion of
ethanol.  From Rolling Stone(!) emphasis added.

This is not just hype -- it's dangerous, delusional bullshit.  Ethanol doesn't burn cleaner than gasoline, nor is it
cheaper. Our current ethanol production represents only 3.5 percent of
our gasoline consumption -- yet it consumes twenty percent of the
entire U.S. corn crop, causing the price of corn to double in the last
two years and raising the threat of hunger in the Third World. And the
increasing acreage devoted to corn for ethanol means less land for
other staple crops, giving farmers in South America an incentive to
carve fields out of tropical forests that help to cool the planet and
stave off global warming.

So why bother? Because the whole
point of corn ethanol is not to solve America's energy crisis, but to
generate one of the great political boondoggles of our time. Corn is
already the most subsidized crop in America, raking in a total of $51
billion in federal handouts between 1995 and 2005 -- twice as much as
wheat subsidies and four times as much as soybeans. Ethanol itself is
propped up by hefty subsidies, including a fifty-one-cent-per-gallon
tax allowance for refiners. And a study by the International Institute
for Sustainable Development found that ethanol subsidies amount to as
much as $1.38 per gallon -- about half of ethanol's wholesale market
price.

Hurrah!  Unfortunately, I fear we may be waking up too late.  Already, billions of dollars are being invested by politically connected companies
on the promises of subsidies and promotion of ethanol extending out to
the end of the universe.  At this point, ethanol may be as entrenched
as agriculture subsidies, the education department, and depression-era
alcohol regulation.  The government has no problem reneging on contracts with oil companies, but God forbid anyone deny Archer Daniels Midland the right to infinite subsidies.

Stop Right There or I Will Shoot Myself!

Via the Washington Post:

It has become a Capitol Hill ritual: A few senators, always including the New York Democrat Charles E. Schumer, introduce a bill to punish China
if its leaders do not raise the value of the nation's currency. Photos
are taken, news releases are issued, but nothing really happens.

This
year, the atmosphere on the Hill is markedly different. Powerful
senators from both sides of the aisle, Schumer among them, are pushing
two bills that threaten retaliatory action if China does not budge. For
the first time, the idea is gaining broad support. The bills are moving
swiftly through the Senate, and many analysts expect one will pass.

If the bill's authors are successful, the effect at a minimum will be to raise consumer prices in the United States and lower them for Chinese citizens.  So we are going to "punish" China by making our own citizens pay higher prices.  How does this make any sense?  Also, in the process, let's make sure we reduce the capacity of China to buy US government debt, which to this point has been reducing the cost of the Federal budget deficit.

Tyler Cowen argues this is the best we can expect -- the worst is a substantial debalization in the Chinese economy... and ours.  I wrote much more on continuing to allow the Chinese government to subsidize American consumers here.

Barf

The average federal worker now makes over twice the wages and benefits of the average private worker
Edwards_fed

Maybe they have some sort of incentive plan, receiving a percentage of the value they have personally destroyed.  Because sure as hell none of them are producing anything.  If the Democrats want to fight income inequality and take on excessive compensation that is set without oversight, I might suggest beginning with the federal government. 

Postscript: TJIC has pointed out that he and I, though we tend to agree, often express ourselves differently.  Here is my prediction of TJIC's response to this article:  "We going to need a lot more rope."  How's that, Travis?

Water in the Desert - Is Pheonix "Unnatural?"

A week or so ago, the Toronto Star accused Phoenix of being "unnatural" and hypothesized that water shortages would soon drive people in a reverse migration to the Rust Belt, where lots of underutilized infrastructure exists.  I had a long, long response, because there was just so much silly stuff in the article, but you can bet I argued:

  1. Why is it unnatural for Phoenix to depend on water moved from long distances but it is natural for Buffalo and Cleveland to depend on hydrocarbons for winter heat moved from a long distance away?  When did self-sufficiency in water become the be-all end-all judge of city sustainability?  And how do cities dependent on big old coal-fired plants criticize the CO2 footprint of a city powered by the largest nuclear plant in the country?
  2. To the extent Phoenicians are inattentive to water use, it is because we have some of the cheapest water in the country, provided to us at ridiculously low rates to politicians who would rather manage water supply and demand through command and control than through price and markets.  Much of Arizona's water use is in agriculture, where water hungry crops are grown in the Sonoran Desert because of subsidized water use rates and federal agricultural subsidies.

I did a bit more research, and found this:

In an average year, Arizonans go through about 7.25 million acre-feet,
or nearly 2.4 trillion gallons. Put a different way, that amount of
water could support a residential population of nearly 30 million
people.

Except it doesn't. It's supporting a population of 5.7 million - and a
lot of farms, which use about 68 percent of the state's water.

I have no problem with whoever wants to use the water.  If people want to make a go of cotton farming in the desert, power to them.  EXCEPT when the government provides them massive subsidies for doing so, as is the case in Arizona (and most all southwestern) agriculture.  Cotton farmers, for example, receive massive government subsidies for growing their crops, and water their plants with subsidized artificially low-priced water.  If the distortive government subsidies went away, and water prices were allowed to float up to where supply met demand (and we were not draining down aquifers and Lake Powell) then my guess is that a lot of desert agriculture would disappear.

By the way, I am also perfectly willing to believe that if water prices rose, there would be fewer people moving to the area.  Fine.  However, this effect would likely be small, since water costs are only a small percentage of the costs of home owning but are a huge percent of the costs of agriculture.   But I think we can see that trying to blame Arizona's water problems on inward residential migration is  pointing the finger in the wrong direction.

Interestingly, even that great bete noir of environmentalists and outside critics, our golf courses, really have a minimal impact on the water use:

Everyone's favorite culprit, golf courses use two-thirds of the
industrial supply, or about 4 percent to 5 percent of the total supply.
Some courses use treated effluent, or "gray water." Scottsdale, for
example, requires any new course to use gray water or bring its own
supply.

Postscript:  Water is one of those weird topics, a bit like health care I guess, where most people seem to assume that the normal laws of economics do not apply.   Over the last several months, I have probably read 30 articles on Arizona water use.  Not one single time in any article have I seen mention of the word "price."  Its all about what command and control methods we need to exercise.  Take the guy they interviewed for the article above:

Charles Buerger, who divides his year between homes in Gilbert and
suburban Chicago, is sometimes surprised that people in northern
Illinois, on the banks of Lake Michigan, seem more concerned about
water use than people in dry Arizona.

"They have every-other-day grass watering back there," Buerger said.
"They fine you if you're overwatering or if you're watering on days
you're not supposed to. They're very conscious about water supplies.
The way Arizona's growing, you just wonder, 'Where's all this water
coming from?' "

Pricing matters, even for water!  Not silly even-odd day lawn watering laws.  Just look at these numbers:

City Monthly cost for water service of 8,500 gallons
Memphis, Tennessee $14.16
Phoenix, Arizona $16.27
Charlotte, North Carolina $17.52
Dallas, Texas $20.04
Austin, Texas $23.15
Portland, Oregon $23.44
Louisville, Kentucky $23.47
Houston, Texas $26.49
Milwaukee, Wisconsin $27.86
East Bay MUD, Oakland, California $31.13
Atlanta, Georgia $33.60
San Diego, California $37.52
Seattle, Washington $39.75

What could explain more eloqently why I paid more attention to how I watered my lawn in rainy Seattle than desert-bound Phoenix.  Remember gasoline in the 1970's.  It wasn't even-odd day rationing that solved the supply crisis; in the end, it was elimination of price controls.

Update: The Toronto Star argued that Phoenix represented environmental Armageddon while the Great Lakes region was the environmentally smart place to live.  They suggested "that in the
Great Lakes basin, where less than half a per cent of the world's
population sits within easy reach of a quarter of the planet's fresh
water, the opportunity for harmony exists."  Of course, that's only if you ignore the fact that these cities treat the Great Lakes like one big toilet:

"The Great Lakes basin is one of the most important freshwater
ecosystems on the planet - holding one fifth of the world's
freshwater," said the report's author Dr. Elaine MacDonald. "Yet, the
20 cities we evaluated are dumping the equivalent of more than 100
Olympic swimming pools full of raw sewage directly into the Great Lakes
every single day."

20061129_sign

This is the kind of stuff that has a lot higher immediate impact, and should be worked long before, tenuous claims of damage from CO2 production.

HDR Photography Test

I have never been satisfied with my pictures of the rock formations on my parents ranch.  They have always lacked the depth and detail I saw in nature.  I played around this week with HDR photography, which uses multiple exposures of the same image to bring out more contrast and detail.  Here is a closeup of the rocks.  I also got a nice effect with the clouds, combining multiple exposures with small cloud movement.  (click for higher resolution image)
Hdrengagementweb

OMG

Interstate bridge collapses during rush hour near Minneapolis.  Though the death toll so far of 6 is tragic, it is pretty amazing when you think of 50-100 cars on a collapsing bridge.
Bridge1

Update:  The guy in the van must have a story to tell.