Posts tagged ‘north carolina’

A Request To Send Me Graphs of Negative Climate Trends

For years I have been mocking attempts to "prove" negative climate trends from a single data point. Too often a single event (e.g. strong hurricane landfall) is treated as "proof" of a trend, though how anyone who styles themself as "scientific" can claim a trend from a single data point is beyond me.  Every time someone claims a trend in, say, hurricane strength or drought or crop yields, I never can see any trend in the actual archived data for those phenomena.

So I am soliciting real medium and long-term trend data that points to some sort of negative climate trend.  To save folks time, I know of and have the data for several already:

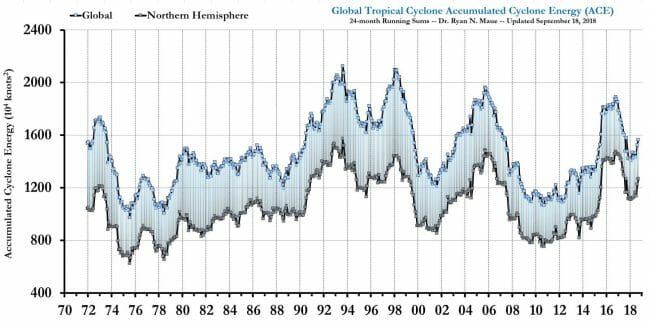
  • Increasing worldwide average temperatures, as measured both on the ground and in the lower troposphere by satellites
  • Increasing number of record high nighttime low temperatures (yes, I know, this is always confusing)
  • Arctic (but not Antarctic) sea ice extent, at least over the last 50 years
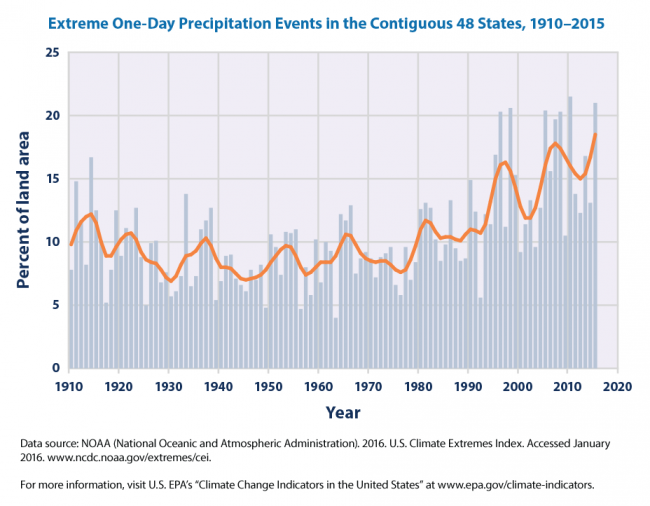
  • US heavy rainfall events
  • Sea level rise

Note that at this point I do not care if the trend is natural or manmade or if you can really specify a difference (which I would argue you likely cannot).  For example the sea level rise trend of 2-3mm a year goes all the way back to before 1850, and thus is hard to ascribe totally to man-made CO2 which has mostly been produced in the latter half of the 20th century.

Here are some rules:

  • Must have a link to original data source or at least the original chart source (some groups are terrible about archiving the actual data), which can be a study or a group that actively measures the phenomenon.
  • It can't just be for a limited geography.  North Carolina is too small.  The Antarctic Peninsula is too small.  The US is really too small but I will accept it because the US temperature data is some of the most complete in the world.  But don't send me a limited geography when the same data is available for a larger geography (ie only hurricanes in the Indian Ocean when we have hurricane data for the whole globe).
  • It needs to be for as long of a time period as possible, and if you cut off early or late data there has to be a reason.  large changes in measurement approach can be a valid reason for leaving out data -- for example, small tornadoes before the advent of doppler radar and moder tornado tracking are likely undercounted.  Ditto hurricanes.
  • It can't be based on a model.  It has to be actual readings, not model estimates.  Have a care on this -- many pieces of historical data that are presented as actual measurements are actually model results.
  • It needs to be a weather or climate metric.  If you want, you can send me potentially derivative variables and I might present these in another section, but they tend to be suspect because the causality extends beyond climate.  An example of this is forest fire acreage burned, which can relate to climate but also can relate to forest management, forest health and insect threats, and firefighting philosophy as well.  Other similar metrics include crop yields, disease rates, refugees, wars, and a zillion other things that get attributed in some study to climate change.

Anything that passes these rules will get posted, though I reserve the right to comment.

Update:  Comments section is OK, but email is better.  Click the contact link up at the top.

Extrapolating Trends from A Single Data Point: The Once In A Lifetime Event

Most of you know I agree there is man-made global warming but am skeptical the extent will be anywhere near most forecasts you see in the media.  For some reason, this earns me the title of "denier."  However, I find that the climate discussion has become boring in the extreme, and I have mostly moved on from it.  But I am still interested in analytical abuses in the media, and long-time readers will know that my favorite is the positing of a trend using but a single data point.  My example today happens to be from climate.

It starts with this tweet:

Obviously he is reacting to the recent hurricane in North Carolina, which turns out to be pretty run of the mill but the media has portrayed as some sort of armageddon.  I could have pulled roughly similar quotes from all kinds of sources.  Several networks did long pieces over the weekend claiming an upward trend in hurricanes without any trend data, but merely from the fact that one made landfall recently.  But anyone who claims be defending science should be held, I think, to a higher standard in making scientific claims.

As I asked the March for Science tweeter:  If, say, there is a trend towards more or stronger hurricanes, why does no one ever show a trend chart? They just declare the trend from one data point, like a single hurricane landfall. Every long-term hurricane & cyclonic energy trend chart I have seen is flat to down.  (This is not primarily a climate post but I will post some hurricane trend charts at the end).

There is certainly an upwards trend in the media labelling storms as "once in a lifetime" but it is doubtful that there is actually an underlying trend in storm severity. Even the slightly more meaningful term "100-year _____" is abused.

Consider a 100-year flood in North Carolina, almost certainly a once in a lifetime event for someone in that state unless they live really long.  Since North Carolina is .027% of the world's landmass, there will be, on average, 37 hundred-year floods over land areas the size of North Carolina every single year.   That's 37 once-in-a-lifetime North-Carolina-sized floods somewhere in the world every single year.  Heck, there should be 3-4 thousand-year floods of North Carolina size somewhere in the world every year -- that's three or four once in a millenium floods!  And this same math applies to 100-year heat waves, droughts, snow storms -- you name it.

We can learn a couple of things from this.  First, living through "once in a lifetime" storms every year, somewhere in the world, is not abnormal -- it is expected.  Second, one can see how choices in media coverage could drive an apparent trend.  If the media covered maybe 3 or 4 of these 37 floods when I was young, but covers every one today, it will appear that there is a trend since I hear so much more about them.  But in fact, nothing will have changed except the media.  I will remind you what I wrote on this topic waaaay back in 2012.

Let's take a step back to 2001 and the "Summer of the Shark." The media hysteria began in early July, when a young boy was bitten by a shark on a beach in Florida. Subsequent attacks received breathless media coverage, up to and including near-nightly footage from TV helicopters of swimming sharks. Until the 9/11 attacks, sharks were the third biggest story of the year as measured by the time dedicated to it on the three major broadcast networks' news shows.

Through this coverage, Americans were left with a strong impression that something unusual was happening -- that an unprecedented number of shark attacks were occurring in that year, and the media dedicated endless coverage to speculation by various "experts" as to the cause of this sharp increase in attacks.

Except there was one problem -- there was no sharp increase in attacks.  In the year 2001, five people died in 76 shark attacks.  However, just a year earlier, 12 people had died in 85 attacks.  The data showed that 2001 actually was  a down year for shark attacks.

Once you start looking for this type of thing, the extrapolation of a trend from at most one data point, you will see it everywhere.

For those still hanging around to the end, here are a couple of actual trend charts on hurricanes (the adjusted line attempts to correct for the fact that earlier eras with no satellites or radar tended to miss some hurricanes) (source at NOAA):

Below are two charts that look beyond just the Atlantic at global cyclones, both from this source.  The first is frequency:

The second looks at accumulated cyclonic energy, which is a sort of time integral of the energy in all active cyclonic storms around the world

Later in the tweetstorm, the same tweeter mentioned as a fact, again without data, "Climate change is increasing drought frequency, impacting everything from agriculture to health. Some studies suggest the consequences of droughts include increased violence and war."  There has been no upward trend in US droughts (negative is more drought-y.

Finally, in the spirit of full disclosure, of all the zillions of things (not directly related to temperature) in weather effects that are blamed on global warming, this is the only one I have found that shows an upward trend recently and could logically be attributed to warming.  Whether this is related to warming or independent or a data measurement issue is (if folks were honest) not well understood

Why Branding Has Value

I have written about this before, but critics of all things capitalism are usually particularly critical of branding, arguing that building brands has no value except to somehow beguile customers into overpaying for things or buying things they do not need.  Now, I can be sympathetic to this when I see folks who have paid a fortune for certain fashion items (*cough* Louis Vuitton bags *cough*), but in generally branding actually has real consumer value.  One important value of branding is predictability.  McDonald's was traditionally a classic example of this -- walk into any McDonald's in the world and you will be pretty sure what will be on the menu and what it will taste like.

I wrote about this before when travelling in Europe.  I know that I like some orange juice brands and don't like others.  I know for sure I like Tropicana and so I buy that because I am confident I will get something I will like.  In Europe, I had no idea what to buy -- I might pay for something I would enjoy, but I might also find myself having paid for something I really did not like.

I was reading a travel blog and thought that this quote really represented the epitome of why brands matter

I’ve been to Hyatts all around the world within every brand of the chain’s portfolio, and I don’t recall ever staying at a property which was miscategorized. There’s no mistaking a Park Hyatt for a Hyatt Regency, or a Grand Hyatt for an Unbound Collection. When I pick a property within the Hyatt portfolio, my expectations are met and the experience is standardized around the world. Hyatt Houses and Hyatt Places are almost identical properties regardless of where in the world they pop up.

I cannot say the same for the expansive Marriott portfolio. Just last month I stayed at the JW Marriott Copacabana in Rio, and nothing about that property represented the other JW’s I’ve visited. Certainly not all generic Marriott hotels are created equally, and I’ve found a very large variation in property conditions, common spaces, room sizes and other factors at Marriotts.

For example, let’s look at Courtyard properties. Within the last year I’ve stayed at the Courtyard in Durham, North Carolina, which resembled an updated Super 8. Then, not two months later, I visited the Courtyard in LaGrange, Georgia, which was more akin to a full Marriott hotel branded property. Compare those two with the Courtyard Seoul Times Square, which has an executive lounge with a rooftop patio, and I don’t know what to expect when booking a Marriott property, even within a single brand.

UNC Avoids Athletic Sanctions By Arguing their African-American Studies Dept. Had Staggeringly Low Academic Standards

Well, it appears the common Conservative critique that many university race and gender programs have really low standards has a new supporter:  The University of North Carolina.  UNC successfully argued that it was not giving its athletes special treatment in the African-American studies department -- they had low standards for all students in that department.

A years-long probe into widespread academic fraud in North Carolina’s athletic program, including its storied basketball powerhouse, reached an unexpected end on Friday when the NCAA announced it would not issue major sanctions against the school.

The prolonged investigation focused on a major at the university, African and Afro-American Studies, where about 1,500 athletes over 18 years took advantage to make good grades with little to no work involved. The university’s defense did not focus on the legitimacy of the courses—the NCAA said “generally, the facts of this case are not in dispute.”

UNC instead argued that any problem was university wide, not limited to the athletic department, because the courses were available to all students. On Friday, the NCAA accepted the university’s explanation. .

“A Division I Committee on Infractions hearing panel could not conclude that the University of North Carolina violated NCAA academic rules when it made available deficient Department of African and Afro-American Studies ‘paper courses’ to the general student body, including student-athletes,” the NCAA said Friday.

Greg Sankey, the head of the Southeastern Conference who was the chief hearing officer on the panel, said athletes “likely benefited from the so-called ‘paper courses’” but that “the information available in the record did not establish that the courses were solely created, offered and maintained as an orchestrated effort to benefit student-athletes.”

Just so we are clear exactly what we are talking about, UNC freely admits, in fact desperately argues, that it was offering courses like this:

UNC’s surprising defense focused on its own systemic shortcomings. It said that the problems were so fundamental at the school, it wasn’t actually an NCAA issue, and therefore wasn’t for the NCAA to govern. One estimate said athletes made up about half of the roughly 3,100 students who participated in the classes.

These classes were generally portrayed and shown to be fake for the most part. The NCAA, in its decision, said the classes did not require attendance. The students rarely, “if at all” interacted with a faculty member. The classes typically required one paper where the person who graded it admitted she did not read them in the entirety. These classes, the NCAA said, had “liberal grading.”

For reference, the entire UNC system (not just this location) consumes about 12.5% of the entire North Carolina state budget.

Update:  I was thinking over the weekend about whether this really horrible level of education for the money could be considered racist, since a substantially disproportionate number of the students in this department are black.  If one argues that the value of college is in the education itself, then it is preposterously racist, particularly since it hurts minorities at other colleges by reinforcing the general stereotype of low academic standards in race studies programs.  If one argues that the value of college is only in the degree itself - the piece of paper - I suppose one could consider this affirmative action.

Most College-Age Kids Probably Can't Remember A Major Hurricane Landfall

Most folks, even those who say they are data-driven, are not data-driven.  They react to their perception.  If some sort of activity suddenly makes the news more, we assume that activity is increasing, even if all that is happening is that the activity is simply making the news more.

A lot of the folks who want to blame this year's landfalling hurricanes on global warming are making this mistake.  If you are 20, the last major hurricane landfalls were in 2005 when you were 8.  The last decade has seen a nearly unprecedented drought in US major hurricane landfalls, so against the backdrop of this drought, several major Atlantic storms seems highly unusual.  But I grew up in the 1960's to the 1980's on the Gulf Coast and hurricanes were a regular part of our life then.  When I lived in Clear Lake City, Texas, we had so many in a few years in the 1980's that I had a special spot picked out to park my car to keep it above flood waters.  In the 1990's, we had a memorable vacation where we rented a house on the North Carolina coast for a month and got hit by three hurricanes -- we spent the whole trip hiding in the laundry room from tornado warnings and evacuating back and forth to the interior of the state.

For those who like simple charts, the WSJ had a good one the other day:

Making this a chart of hurricane landfalls deals with the public perception issue, as landfalls tend to be the only ones we really remember.  But this is actually a terrible metric (even though it makes my point about Irma and Harvey not representing any sort of upward trend) because landfalls are random and may not really represent actual hurricane activity.  A better metric is accumulated cyclonic energy of tropical storms, which looks at a sort of integral of storm strength over time.  This does not show a trend either, but since I cannot find a chart of ACE updated with recent activity I am not going to put it up here.   Here it was as of June of this year, and this chart only goes back to 1970 -- if we had good data early in the 20th century it would have been much higher.


Licensing is Anti-Consumer

The whole topic of licensing as anti-consumer efforts to restrict competition is a long-running one here.   Since I am sort-of-kind-of not-blogging right now, I won't excerpt or comment on it a lot, but this is a very interesting piecelooking at internal documents of the American Dietetic Association discussing their efforts to pass laws in various states that essentially ban anyone but their members from giving diet and nutrition advice.  It is one such law in North Carolina which required that Steve Cooksey take down all his blog posts about his dieting experiences (since he is not licensed by the state, it is illegal for him to speak on the topic).

The funniest part for me in the ADA materials is that they constantly seem to be put out that their efforts to  ban competition from anyone outside of their organization are described by critics as creating a monopoly.  Who, us? Monopoly?  We are just trying to help customers.  Missing in all this, of course, is any evidence of a grass roots effort by nutrition customers.  I will remind everyone of this great Milton Friedman quote:

The justification offered is always the same: to protect the consumer. However, the reason is demonstrated by observing who lobbies at the state legislature for the imposition or strengthening of licensure. The lobbyists are invariably representatives of the occupation in question rather than of the customers. True enough, plumbers presumably know better than anyone else what their customers need to be protected against. However, it is hard to regard altruistic concern for their customers as the primary motive behind their determined efforts to get legal power to decide who may be a plumber.

Gun Permit Holders Substantially More Law Abiding

The other day, the New York Times published a story with data that demonstrates that gun permit holders in North Carolina are 20x less likely to commit a felony than the average American [not entirely sure the math is right here, but the crime rate among permit holders is certainly lower than the average].  Of course, the Times readership does not want to hear that, since it does not fit their world view.   So the Times, ever sensitive to its readership's needs, writes the article as a scare story about why we need tighter gun control.

No Wonder Al Gore Is So Obsessed With Weather!

Bryan Caplan links a 2007 study that looks at voter turnout and weather, and specifically tests the conventional wisdom that rain helps Republicans (by disproportionately surpressing the Democratic vote).

The findings appear to be that bad weather does help Republicans and does supress turnout.  However, in studying presidential elections, he finds few that would have had their outcome changed.  Here, however, was one exception:

The results of the zero precipitation scenarios reveal only two instances in which a perfectly dry election day would have changed an Electoral College outcome. Dry elections would have led Bill Clinton to win North Carolina in 1992 and Al Gore to win Florida in 2000. This latter change in the allocation of Florida's electors would have swung the incredibly close 2000 election in Gore's favor.

Since we know from Gore that heavy snow, no snow, heavy rain, and no rain are all caused by global warming, his 2000 electoral defeat was obviously caused by manmade CO2.

Trading Cribs

Brian Caplan compares his life with that of the richest of the Gilded Age:

I just returned from the Biltmore, America's largest home.  Built by George Vanderbilt between 1889 and 1895, the Biltmore is a symbol of how good the rich had it during the Gilded Age.  I'm sure that most of the other visitors would answer "very good indeed."

But how many would actually want to trade places with George?  Despite his massive library, organ, and so on, I submit that any modern with a laptop and an internet connection has a vastly better book and music collection than he did.  For all his riches, he didn't have air conditioning; he had to suffer through the North Carolina summers just like the poorest of us.  Vanderbilt did travel the world, but without the airplane, he had to do so at a snail's pace.

Perhaps most shockingly, he suffered "sudden death from complications following an appendectomy" at the age of 51.  (Here's the original NYT obituary).  Whatever your precise story about the cause of rising lifespans, it's safe to say that George's Bane wouldn't be fatal today.

I made this observation several years ago, though, though I went west coast railroad entrepreneur rather than east coast.  I showed pictures of a San Francisco mansion and a middle class home of a friend of mine in Seattle.

One house has hot and cold running water, central air conditioning, electricity and flush toilets.  The other does not.  One owner has a a computer, a high speed connection to the Internet, a DVD player with a movie collection, and several television sets.  The other has none of these things.  One owner has a refrigerator, a vacuum cleaner, a toaster oven, an iPod, an alarm clock that plays music in the morning, a coffee maker, and a decent car.  The other has none of these.  One owner has ice cubes for his lemonade, while the other has to drink his warm in the summer time.  One owner can pick up the telephone and do business with anyone in the world, while the other had to travel by train and ship for days (or weeks) to conduct business in real time.

I think most of you have guessed by now that the homeowner with all the wonderful products of wealth, from cars to stereo systems, lives on the right (the former home of a friend of mine in the Seattle area).  The home on the left was owned by Mark Hopkins, railroad millionaire and one of the most powerful men of his age in California.  Hopkins had a mansion with zillions of rooms and servants to cook and clean for him, but he never saw a movie, never listened to music except when it was live, never crossed the country in less than a week.  And while he could afford numerous servants around the house, Hopkins (like his business associates) tended to work 6 and 7 day weeks of 70 hours or more, in part due to the total lack of business productivity tools (telephone, computer, air travel, etc.) we take for granted.  Hopkins likely never read after dark by any light other than a flame.

If Mark Hopkins or any of his family contracted cancer, TB, polio, heart disease, or even appendicitis, they would probably die.  All the rage today is to moan about people's access to health care, but Hopkins had less access to health care than the poorest resident of East St. Louis.  Hopkins died at 64, an old man in an era where the average life span was in the early forties.  He saw at least one of his children die young, as most others of his age did.  In fact, Stanford University owes its founding to the early death (at 15) of the son of Leland Stanford, Hopkin's business partner and neighbor.  The richest men of his age had more than a ten times greater chance of seeing at least one of their kids die young than the poorest person in the US does today.

Hopkin's mansion pictured above was eventually consumed in the fires of 1906, in large part because San Francisco's infrastructure and emergency services were more backwards than those of many third world nations today.

Here is a man, Mark Hopkins, who was one of the richest and most envied men of his day.  He owned a mansion that would dwarf many hotels I have stayed in.  He had servants at his beck and call.  And I would not even consider trading lives or houses with him.  What we sometimes forget is that we are all infinitely more wealthy than even the richest of the "robber barons" of the 19th century.  We have longer lives, more leisure time, and more stuff to do in that time.   Not only is the sum of wealth not static, but it is expanding so fast that we can't even measure it.  Charts like those here measure the explosion of income, but still fall short in measuring things like leisure, life expectancy, and the explosion of possibilities we are all able to comprehend and grasp.

Public Sector Unions

Readers of the site know that I do not generally join in with the Conservative bashing of unions, except to the extent that they feed at the public trough (e.g. at GM) where I will bash them equally with all other similar hogs.  Unions are perfectly acceptable associations of individuals in a free society for a generally rational purpose.  What upsets this equation is when the government attempts to intervene to tilt the playing field either towards employers or unions in their negotiations -- but this is a government intervention issue, not a union issue per se.

Far more problematic is the growing influence of public employee unions.  Union advocates talk about the need to help private unions in a power imbalance with large corporations, but talk about a power imbalance!  In the public sector, we have hugely powerful unions with absolutely no one willing to take them on.  Government leaders who supposedly should be advocates of taxpayers and pushing back against union demands are typically in bed with unions.  One might say it is a similar case to unions owning the private company in which they work, but in that case there are market dynamics that mitigate against overly high pay or indifferent customer service.  No such balancing mechanisms exist in government monopoly institutions.

There have been a lot of articles on this topic of late that I have been keeping in my reader but have not linked, so to do a bit of tab-clearing, here are some good recent articles on public sector unions.

Carpe Diem shows the direct relationship between increasing public sector unionization and public sector debt.  Chris Edwards appears to be the original source.

Chris Edwards followed up to show an inverse relationship between state management quality and unionization.

Bruce McQuain discusses the $500 billion California unfunded pension liability.  And this does not include the unfunded liabilities of all the state's cities and towns and counties, which typically don't book any liability at all for their future pension and medical commitments.

Steven Malanga on how public sector unions broke California.

The camera focuses on an official of the Service Employees International Union (SEIU), California's largest public-employee union, sitting in a legislative chamber and speaking into a microphone. "We helped to get you into office, and we got a good memory," she says matter-of-factly to the elected officials outside the shot. "Come November, if you don't back our program, we'll get you out of office.'

Traditionally, public sector unions have exercised a lot of power in elections, as evidenced by this example of the success of unions in fielding winning candidates in California school board elections.   Bruce McQuain reports that the SEIU has even formed its own 3rd party in North Carolina.  Its amazing that candidates whose main platform is to shift more taxpayer resources to the pockets of government workers has success.

Finally, according to the GAO, union contracts have a lot to do with why the USPS is failing  (as labor accounts for 80% of USPS costs).  They seem to have all the labor problems GM had, except there is even less pressure to correct the problems, since after all we can't get our mail delivered by Honda or Toyota.  Here is an example:

  • USPS workers participate in the federal workers' compensation program, which generally provides larger benefits than the private sector. And instead of retiring when eligible, USPS workers can stay on the "more generous" workers' compensation rolls.
  • Collective bargaining agreements limit the amount of part-time and contract workers the USPS can use to fit its workload needs, and they limit managers from assigning work to employees outside of their crafts. The latter explains why you get stuck waiting in line at the post office while other postal employees seemingly oblivious to customers' needs go about doing less important tasks.
  • Most postal employees are protected by "no-layoff" provisions, and the USPS must let go lower-cost part-time and temporary employees before it can lay off a full-time worker not covered by a no-layoff provision.
  • The USPS covers a higher proportion of employee premiums for health care and life insurance than most other federal agencies, which is impressive because it's hard to be more generous than federal agencies.
  • If the collective bargaining process reaches binding arbitration, there is no statutory requirement for the USPS's financial condition to be considered. This is like making the decision whether or not to go fishing, but not taking into consideration the fact that the boat has holes in its bottom.

This Is What You Get For Cooperating with the Government

Ken Lewis gets his payoff for knuckling under to Paulson and Bernanke on the Merrill Lynch acquisition

Kenneth Lewis, outgoing chief executive of Bank of America Corp., will get no salary or bonus for 2009, according to people familiar with the matter, the biggest Wall Street name thus far to come under the thumb of the government's pay czar.In fact, Mr. Lewis will have to repay the North Carolina-based bank more than $1 million in salary he has already earned.

The move was demanded by Kenneth Feinberg, the U.S. Treasury Department's special master for compensation, and was agreed to by Mr. Lewis and the bank.

After forcing Lewis to deal fraudulently with his shareholders, they cut his pay to zero. Nice. Lewis will do fine, he has a nice fat retirement, but it is still a pretty scary development for those of us who still care about contracts and individual liberty.  Just ask yourself - what objective standard did Feinberg apply?  Can't come up with one, can you?

Water in the Desert - Is Pheonix "Unnatural?"

A week or so ago, the Toronto Star accused Phoenix of being "unnatural" and hypothesized that water shortages would soon drive people in a reverse migration to the Rust Belt, where lots of underutilized infrastructure exists.  I had a long, long response, because there was just so much silly stuff in the article, but you can bet I argued:

  1. Why is it unnatural for Phoenix to depend on water moved from long distances but it is natural for Buffalo and Cleveland to depend on hydrocarbons for winter heat moved from a long distance away?  When did self-sufficiency in water become the be-all end-all judge of city sustainability?  And how do cities dependent on big old coal-fired plants criticize the CO2 footprint of a city powered by the largest nuclear plant in the country?
  2. To the extent Phoenicians are inattentive to water use, it is because we have some of the cheapest water in the country, provided to us at ridiculously low rates to politicians who would rather manage water supply and demand through command and control than through price and markets.  Much of Arizona's water use is in agriculture, where water hungry crops are grown in the Sonoran Desert because of subsidized water use rates and federal agricultural subsidies.

I did a bit more research, and found this:

In an average year, Arizonans go through about 7.25 million acre-feet,
or nearly 2.4 trillion gallons. Put a different way, that amount of
water could support a residential population of nearly 30 million
people.

Except it doesn't. It's supporting a population of 5.7 million - and a
lot of farms, which use about 68 percent of the state's water.

I have no problem with whoever wants to use the water.  If people want to make a go of cotton farming in the desert, power to them.  EXCEPT when the government provides them massive subsidies for doing so, as is the case in Arizona (and most all southwestern) agriculture.  Cotton farmers, for example, receive massive government subsidies for growing their crops, and water their plants with subsidized artificially low-priced water.  If the distortive government subsidies went away, and water prices were allowed to float up to where supply met demand (and we were not draining down aquifers and Lake Powell) then my guess is that a lot of desert agriculture would disappear.

By the way, I am also perfectly willing to believe that if water prices rose, there would be fewer people moving to the area.  Fine.  However, this effect would likely be small, since water costs are only a small percentage of the costs of home owning but are a huge percent of the costs of agriculture.   But I think we can see that trying to blame Arizona's water problems on inward residential migration is  pointing the finger in the wrong direction.

Interestingly, even that great bete noir of environmentalists and outside critics, our golf courses, really have a minimal impact on the water use:

Everyone's favorite culprit, golf courses use two-thirds of the
industrial supply, or about 4 percent to 5 percent of the total supply.
Some courses use treated effluent, or "gray water." Scottsdale, for
example, requires any new course to use gray water or bring its own
supply.

Postscript:  Water is one of those weird topics, a bit like health care I guess, where most people seem to assume that the normal laws of economics do not apply.   Over the last several months, I have probably read 30 articles on Arizona water use.  Not one single time in any article have I seen mention of the word "price."  Its all about what command and control methods we need to exercise.  Take the guy they interviewed for the article above:

Charles Buerger, who divides his year between homes in Gilbert and
suburban Chicago, is sometimes surprised that people in northern
Illinois, on the banks of Lake Michigan, seem more concerned about
water use than people in dry Arizona.

"They have every-other-day grass watering back there," Buerger said.
"They fine you if you're overwatering or if you're watering on days
you're not supposed to. They're very conscious about water supplies.
The way Arizona's growing, you just wonder, 'Where's all this water
coming from?' "

Pricing matters, even for water!  Not silly even-odd day lawn watering laws.  Just look at these numbers:

City Monthly cost for water service of 8,500 gallons
Memphis, Tennessee $14.16
Phoenix, Arizona $16.27
Charlotte, North Carolina $17.52
Dallas, Texas $20.04
Austin, Texas $23.15
Portland, Oregon $23.44
Louisville, Kentucky $23.47
Houston, Texas $26.49
Milwaukee, Wisconsin $27.86
East Bay MUD, Oakland, California $31.13
Atlanta, Georgia $33.60
San Diego, California $37.52
Seattle, Washington $39.75

What could explain more eloqently why I paid more attention to how I watered my lawn in rainy Seattle than desert-bound Phoenix.  Remember gasoline in the 1970's.  It wasn't even-odd day rationing that solved the supply crisis; in the end, it was elimination of price controls.

Update: The Toronto Star argued that Phoenix represented environmental Armageddon while the Great Lakes region was the environmentally smart place to live.  They suggested "that in the
Great Lakes basin, where less than half a per cent of the world's
population sits within easy reach of a quarter of the planet's fresh
water, the opportunity for harmony exists."  Of course, that's only if you ignore the fact that these cities treat the Great Lakes like one big toilet:

"The Great Lakes basin is one of the most important freshwater
ecosystems on the planet - holding one fifth of the world's
freshwater," said the report's author Dr. Elaine MacDonald. "Yet, the
20 cities we evaluated are dumping the equivalent of more than 100
Olympic swimming pools full of raw sewage directly into the Great Lakes
every single day."

20061129_sign

This is the kind of stuff that has a lot higher immediate impact, and should be worked long before, tenuous claims of damage from CO2 production.