Poverty Ain't What it Used to Be
The Heritage Foundation has an interesting study out on the population that lives below the poverty line. While we typically get lots of headlines like "A million more people in poverty," the real headline should be "Poverty ain't what it used to be." Create a mental image for yourself about poverty then read the first part of the article.
I won't repeat the studies points -- you can read them at the link or you have probably seen the study already linked around the blogosphere (e.g. Captains Quarters, Cato-at-Liberty, Reason, Maggie's Farm). Reading the descriptions, its clear that most of our visual images and assumptions about US "poverty" don't line up well with this list. This is by design. Progressives who want more transfer payments and more government interventionism work hard to create a stark mental image of poverty through anecdotes, and then try to apply that mental image to a much larger population based on a very different definition of poverty than in this mental image.
However, this approach may be set to backfire. By defining poverty broadly to try to pump up the numbers, they are at risk of people losing sympathy for the poor. I can see the progressive reaction now -- they are going to say (correctly) that buried in these numbers are a hard core of people who are really destitute. And they are correct. But they only have themselves to blame for burying these folks in a larger group whose lives don't match our mental picture of poverty. And the poverty numbers aren't the only place where this approach is taken.
I am sure you have heard the commercials that say something like one in six kids in America are hungry. It's a crock. There are at most perhaps 2-3 million people in this country who are really destitute. The Census department found that only 6% of the people below the poverty line, about 2 million people, reported they sometimes did not have enough food to eat. Sure, that sucks. Which is why I volunteer with my kids at the local food bank. But it's way, way short of the numbers activists try to use to justify huge new government programs and transfers.
Other thoughts
One issue not discussed, but covered in other studies, is the transience of people in the bottom quintile of income. Most of us imagine the same people in poverty survey after survey, and again that is probably true for the hard core of 2-3 million. But many of the rest move out of poverty over time. In particular, we have had a huge influx of immigrants (legal and illegal) over the last several decades. These folks are all counted in the poverty numbers. Many immigrants arrive below the poverty line, and then work their way out of it.
In a related post, Brad DeLong looks at what life was like even for the well off in 1900, and one can easily come to the conclusion that being poor today might be better than well off in 1900. I made a similar point in this post, when I compared the life of the very rich in 1850 to the middle class today. All of this is empirical proof that wealth is not zero-sum, as assumed by progressives, but is created and expends. My post of the zero-sum wealth fallacy is here.
I've made the point for a long time that our poor are better off than the middle class in most countries of the world. This living space comparison is an example - our poor typically have more living space in their homes than the middle class in Europe, or the well-to-do in many other countries. But there is always that issue of income inequality that is raised, to which I typically answer "so what?" If the poor are better off in the US, does it matter if the rich are really, really better off? Note sometime the language that is always used in income inequality discussions. You will hear folks talking about the "share of total income" as if income is a spring bubbling up in the desert, spewing a fixed amount of wealth, and the rich are the piggy folks up front getting more than their fair share of this limited resource.
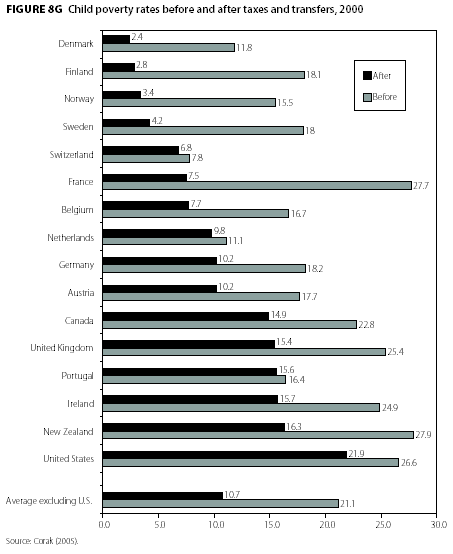
Leftish studies love to show how the US economic model is so much more heartless than those wonderful Europeans. Below is a typical chart they use, and it will bring us full circle to our original point about measuring poverty.
Wow, those heartless damn Americans! Letting those children suffer. But wait, we talked earlier about definitions of poverty - how do they define poverty here? It turns out that poverty is defined as income 50% or less of the median income in that country. Yes, you heard that right -- the standard for poverty changes country to country. So the US has the worst results here because in large part, since it has the highest median income of any country in this survey, it has been given the highest poverty line. Of COURSE we will have higher poverty numbers if you give us a higher poverty bar. The honest way to do this study would be to set an absolute poverty line and apply it to each country on a purchasing power parity basis. But of course, the progressives would not like the results of such an honest study.
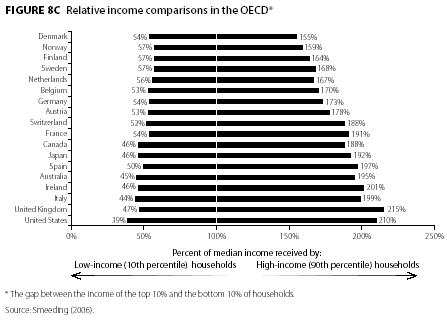
BUT, someone in this study made a mistake -- they should lose their socialist decoder card for this. Because in a fit of honesty, they actually restated one of their charts on a relatively fair basis. Here is the original income equality chart:
You get the point, the US sucks as always -- our poor are the poorest. But are they? Again, the standard in each line is the median income of that country, so it is a changing standard in each case. But what if we restated it all to a common dollar amount. This is where the progressives fell into a fit of honesty. They restated this chart so that every bar is a percentage of the US median income.
Now we see the real story - except for Norway and Switzerland, our poorest folks are about on par with those in other western countries, and this is WITHOUT the crushing burden of welfare state regulation and taxation. Further, the poor in the US are much more mobile than those in other country -- the ranks of our poor will have turned over much more than any of these other countries in 10 years. Finally, my bet is that if you did this chart without recent immigrants, the US poor would best most every country in Europe in terms of income -- US has a lot of immigration and it is disproportionately poor vs. immigration into other European countries (note that most poverty numbers include illegal immigrants, but most official immigration numbers do not include illegal immigrants).
So, if our poor are doing just as well, then I leave it as an exercise to give any rational reason why the fact that our rich are doing much better matters one damn bit.


The chart showing poverty rates before and after taxes is especially interesting. In the US, there is little change. In many of the other countries, the poverty rate doubles after taxes. This means these countries tax their citizens into poverty.
These jokers need to go to a third world country where the rich people have floors in their houses and know where their next meal is coming from. Been there, seen that. It aint pretty. See if you can feed your family on a 20 lb. sack of rice and a chicken for the whole week.
I have to admit I wass really rather proud of digging that last chart out of the State of Working America report in something I did for TCS. Boy of boy did people like Max Sawicky get angry at my pointing it out.
@Reformed Republican:
Actually, the poverty rates for every country are lower after taxes (and transfers) than they are before.