I got to make a real contribution to science this weekend, and I will explain below how you can too. First, some background.
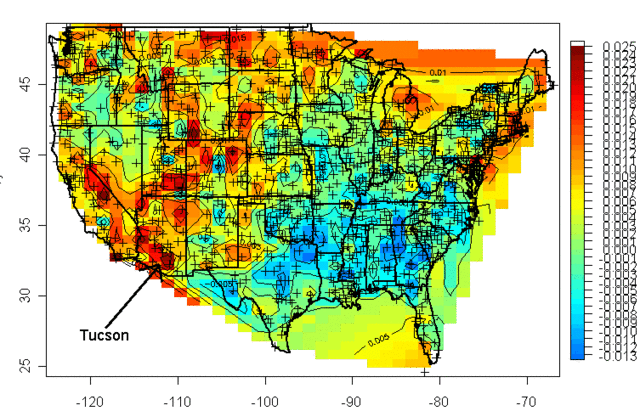
A while back, Steve McIntyre was playing around with graphing temperature data form the US Historical Climate Network (USHCN). This is the data that is used in most global warming studies and initializes most climate models. Every climate station is not in this data base - in fact, only about 20 per state are in the data base, with locations supposedly selected in rural areas less subject to biases over time from urban development (urban areas are hotter, due to pavement and energy use, for reasons unrelated to the greenhouse effect). The crosses below on the map show each station.
He showed this graph, of the USHCN data for temperature change since 1900 (data corrected for time of day of measurement). Redder shows measured temperatures have increased since 1900, bluer means they have decreased.

He mentioned that Tucson was the number one warming site -- you can see it in the deepest red. My first thought was, "wow, that is right next door to me." My second thought was "how can Tucson, with a million people, count as rural?" Scientists who study global warming apply all kinds of computer and statistical tricks to this data, supposedly to weed out measurement biases and problems. However, a number of folks have been arguing that scientists really need to evaluate biases site by site. Anthony Watts has taken this idea and created SurfaceStations.org, a site dedicated to surveying and photographing these official USHCN stations.
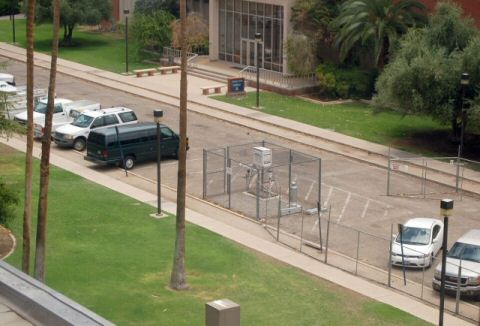
So, with his guidance, I went down to Tucson to see for myself. My full report is here, but this is what I found:

The measurement station is in the middle of an asphalt parking lot! This is against all best practices, and even a layman can see how that would bias measurements high. Watts finds other problems with the installation from my pictures that I missed, and comments here that it is the worst station he has seen yet. That, by the way, is the great part about this exercise. Amateurs like me don't need to be able to judge the installation, they just need to take good pictures that the experts can use to analyze problems.
As a final note on Tucson, during the time period between 1950 and today, when Tucson saw most of this measured temperature increase, the population of Tucson increased from under 200,000 to over 1,000,000. That's a lot of extra urban heat, in addition to the local effects of this parking lot.
The way that scientists test for anomalies without actually visiting or looking at the sites is to do some statistical checks against other nearby sites. Two such sites are Mesa and Wickenburg. Mesa immediately set off alarm bells for me. Mesa is a suburb of Phoenix, and is often listed among the fastest growing cities in the country. Sure enough, the Mesa temperature measurements were discontinued in the late 1980's, but surely were biased upwards by urban growth up to that time.
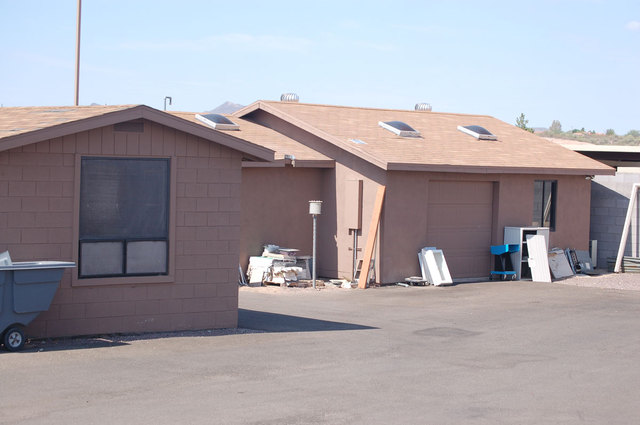
So, I then went to visit Wickenburg. Though is has been growing of late, Wickenburg would still be considered by most to be a small town. So perhaps the Wickenburg measurement is without bias? Well, here is the site:

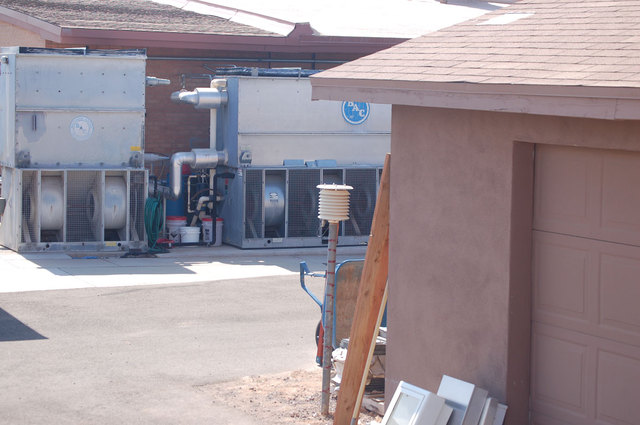
That white coffee can looking thing on a pole in the center is the temperature instrument. Again, we have it surrounded by a sea of black asphalt, but we also have two building walls that reflect heat onto the instrument. Specs for the USHCN say that instruments should be installed in an open area away from buildings and on natural ground. Oops. Oh, and by the way, lets look the other direction...

What are those silver things just behind the unit? They are the cooling fans for the building's AC. Basically, all the heat from the building removed by the AC gets dumped out about 25 feet from this temperature measurement.
Remember, these are the few select stations being used to determine how much global warming the US is experiencing. Pretty scary. Another example is here.
Believe it or not, for all the work and money spent on global warming, this is something that no one had done -- actually go document these sites to check their quality and potential biases. And you too can have the satisfaction of contributing to science. All you need is a camera (a GPS of some sort is also helpful). I wrote a post with instructions on how to find temperature stations near you and how to document them for science here.
For those interested, my paper on the skeptics' arguments against catastrophic man-made global warming is here. If that is too long, the 60-second climate skeptic pitch is here.


