Posts tagged ‘inflation’

Save It

The Arizona Republic this morning had some goofy headline in their print edition that said something like "How should you spend your $800 tax rebate?"  Far be it for me to presume to tell people how to spend their own money (what do I look like, a Congressman?) but here is a bit of advice:  Save it.  Because this is not a grant, it is a loan.

All of these rebates will be paid for with additional deficit spending.  This means that everyone will eventually pay for their rebate in the form of a) higher future taxes; b) higher future prices due to inflation; or c) increased job insecurity and/or lower future earnings due to reduced output in the economy; or d) all of the above.

It HAS to be this way.  Unlike private wealth creation, the government can't get wealth from nowhere.

Cargo Cult Economics

From Venezuela:  (via Mises)

Venezuela launched a new currency with the new year, lopping off three
zeros from denominations in a bid to simplify finances and boost
confidence in a money that has been losing value due to high inflation....

"We're ending a historical cycle of ... instability in prices,"
Finance Minister Rodrigo Cabezas said Monday, adding that the change
aims to "recover a bolivar that has significant buying capacity."

Prices have risen as Chavez has pumped increased amounts of the
country's oil income into social programs, reinforcing his support
among the poor and helping to drive 8.4 percent economic growth in 2007.

The Central Bank is promoting the new monetary unit with an ad
campaign and the slogan: "A strong economy, a strong bolivar, a strong
country." Officials, however, have yet to clearly spell out their
anti-inflationary measures.

Good to see the government taking meaningful steps.  Next up will be "Whip Inflation Now" buttons. 

The 8.4 percent growth cited above may be illusory, given this:

Venezuela has had a fixed exchange rate since February 2003, when
Chavez imposed currency and price controls. The government has said it
is not considering a devaluation any time soon.

But while the strong bolivar's official exchange rate will be fixed
as 2.15 to $1, the black market rate has hovered around the equivalent
of 5.60 to $1 recently.

Yeah, this is Going to Work

Via the New York Times:

Prime Minister Wen Jiabao
responded Wednesday to growing public anxiety about inflation by
announcing that China would freeze energy prices in the near term, even
as international crude oil futures have continued to surge....

Last November, China raised gasoline and diesel prices by almost 10
percent, partly to appease officials at state-owned refineries.
Refiners had complained that price controls were forcing them to
swallow the difference between higher prices for crude oil on the world
market and regulated consumer prices at home for refined products. So
refineries cut back production of gasoline and particularly diesel,
causing long lines at fuel stations around the country.

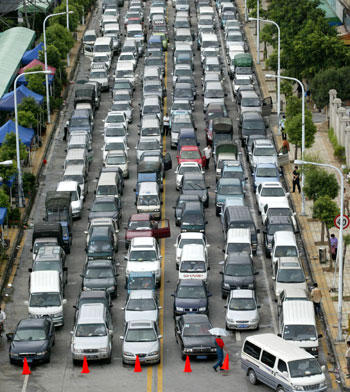
More on past Chinese problems from gas price caps.  Here is a picture of one such past gas line in China. 

China_gas2

    I got my driver's license in 1978, just in time to spend the first few months of my driving life sitting in gas lines with the family car, a result of a series of market distorting actions by the US government.

Meanwhile, I presume the French and Germans will see no problem with this approach:

The Economist says,
of the state of economics education in France and Germany, "I
desperately hope it's not really this bad." Unfortunately, I think it's
really that bad. When the 35 hour work week was proposed, I was talking
to someone in the French consulate who did economics and trade. "Aren't
you worried that this will raise employer's costs and lead to business
failures or higher unemployment?" I asked.

"That's just Anglo-saxon economics" was his rather stunning reply.  Apparently, in France, demand curves do not slope downwards.

California Insanity

The WSJ ($) has an article on California showing the growth of expenditures and the budget deficit.  I took the expenditures numbers and converted them to 2007 dollars and put them on a dollar per state resident basis, to correct both for growing population and inflation.  Here are California government general fund expenditures on a 2007 dollar per person basis:

1990-1991: $2,755
1995-1996: $2,470
2000-2001: $3,558
2005-2006: $3,416
2007-2008: $3,767

From these figures, we can learn a couple of things.  First and foremost, the state of California demonstrates itself to be just as financially incompetent as any condo-flipping doctor who now finds himself stuck with a bunch of mortgages he can't pay.  Lured by the false prosperity of the Internet bubble, California increased real government spending per resident by nearly 50% in the latter half of the nineties, and has done nothing to reign this spending in (thus the deficits).  The only place where the analogy with the person caught short by the housing bust falls apart is that the person with expensive mortgages is probably not out buying a new Mercedes and big screen TV, whereas that is exactly what California is doing, passing a $14 billion a year health care plan that will whose price tag can only rise.

Time to Switch From Meese's to Gipper's

From Daniel Griswold at Cato:

One sure sign of a hyperinflation is that the central bank must
issue new currency notes in ever higher denominations so that people
won't have to carry bags or wheelbarrows of money around to make
everyday purchases. Sure enough, the government of Zimbabwe is now
wrestling with that very question. According to the FT story:

The launch yesterday of a new large-denomination bank
note of Z$200,000"”worth [US$13] at the official exchange rate and
[US$1.30] at the more realistic parallel rate"”underlines the disarray.
The central bank had wanted to issue a Z$500,000 note, but a bank
official said this was vetoed by the finance ministry because senior
staff thought such a large denomination would have reinforced an
impression that inflation was out of control.

At a 13,000 percent rate, that cat is probably already out of the bag.

What a mess.  Explanation of the post title here.

State Run Medicine: Bureaucrat Salaries Trump Patients

Italian Daniele Capezzone writes in the WSJ($):

This situation is especially dire in Italy. The
government has capped spending on pharmaceuticals at 13% of total
health-care expenditures while letting expenses for infrastructure and
staff skyrocket. From 2001 to 2005, general health expenses in Italy
grew by 31% while expenditure on medicines increased a mere 1.7%.
Italian patients might well have been better off if the reverse was the
case, but the state bureaucrats who make these decisions refuse to
acknowledge the benefits of advanced drugs....

Part of the problem is that regional authorities
manage most of Italy's health-care spending. A strike by health-care
personnel has an immediate impact on the region, but the consequences
of cutting the budget for medicines are only felt in the long term and
distributed across the nation. Hence, local authorities continue to
focus on personnel and infrastructure in an age when medical research
has become the most efficient way to improve public health.

Gee, government officials more concerned about raising government salaries than performance?  Couldn't possibly happen in the US, could it?  This is classic government management -- freeze or reduce expenses that actually provide customer service, and raise administrative costs and salaries many times faster than inflation.  This is exactly what has happened in public schools, as infrastructure and teaching aid investments have been deferred in favor of raising salaries and adding untold number of vice-principals and administrators to every school.

But the government is focused on the long-term while greedy old for-profits are short-term focused.  Right?

Unfortunately, most of today's cutting-edge research is conducted
outside Europe, which was once a pioneer in this field. About 78% of
global biotechnology research funds are spent in the U.S., compared to
just 16% in Europe. Americans therefore have better access to modern
drugs. One result is that in the U.S., the annual death rate from
cancer is 196 per 100,000 people, compared to 235 in Britain, 244 in
France, 270 in Italy and 273 in Germany.

Update:  Ronald Bailey points out that drug re importation is just a way to impose drug price controls in the US, effectively applying the most aggressive price-control regime for each drug worldwide to US prices.  Right now, drug companies tolerate price controls set as much as 2/3 under US prices or more because they can still make money at the margin, because the marginal cost of drug production is so much lower than the total cost with R&D, etc. included.  However, they cannot survive at these prices applied to US demand.  Remember, drug companies have profits margins averaging in the 18-20% range.  Perhaps you might argue they should only be making 10%, but that only gives you room for an imposed 10% price cut, not the huge cuts politicians would like.  And you would get that only at tremendous costs in terms of lost freedoms and demolished incentives for new drug development.

Why a Carbon Tax is Superior

I don't think that government action on greenhouse gasses is justified.  That's not to say that man is not helping nature warm the planet some, its that the man-made warming, when you strip away the exaggerations, does not justify the cost of preventing it.  Since I wrote 80+ pages on it here, I won't delve much further into it. 

However, if we are going to take action, a carbon tax is way, way better than cap and trade.  I used to think that cap and trade made more sense, but I have changed my mind.  Cap and trade systems have a lot of potential for error and abuse, but there is one issue that is not adequately discussed:  They are also a huge subsidy and protection for current businesses, effectively penalizing new entrants.

Why?  Because most cap and trade systems begin by giving out emissions credits to current industry incumbents.  These are credits that new entrants will have to purchase, tilting the playing field in favor of current industry leaders.  This is the kind of thing Europeans love, because their largest business interests effectively control the government and keep out new competition, causing their economies to stagnate.  Steven Milloy is one of the few folks raising the red flag on this issue:

Under
the LCEA, the federal government would annually issue rights or
"allowances" to emit GHGs. In the first year of the bill, slated as
2012, allowances would be issued for approximately 6.65 billion metric
tons of GHGs. The amount of allowances slightly decreases every year "“
for example, 6.59 billion metric tons in 2013, 6.53 billion metric tons
in 2014, etc. "“ until it finally levels out at 4.82 billion metric tons
in 2030 and beyond.

These allowances have monetary value "“ a lot.

Owners
of allowances can either use them to pay for their GHG emissions or
they can sell them to other emitters who need allowances. Emitters can
also simply pay the federal government directly to emit GHGs at a cost
of $12 per metric ton of carbon dioxide starting in 2012. This price is
slated to increase annually by the inflation rate plus 5 percent. By
2030 "“ and unrealistically assuming that no inflation occurs "“ the
pay-to-emit price would be about $27.50 per metric ton of carbon
dioxide.

Using the pay-to-emit price, the GHG emissions
allowances issued by the federal government in 2012 will have a
potential market value of $80 billion. The annual market value of these
government-issued allowances will rise to over $100 billion by 2018 and
hit $130 billion in 2030. It will only take about 10 years "“ exclusive
of any inflation "“ for value of the allowances issued by the government
to exceed $1 trillion.

And incredible as it sounds, the bulk of
these allowances "“ 76 percent for the first five years, declining to 47
percent by 2030 "“ will be given away at no charge to special interests
including private industry, farmers and states. This global warming
giveaway works out to a total of $1.34 trillion of free money "“ not
adjusted for inflation "“ that would be handed out to global warming
special interests from 2012-2030. After 2030, the annual amount of free
money handed out is about $65 billion, increasing by 5 percent per
year, exclusive of inflation.

Unfortunately, politicians will always favor an indirect tax over a direct tax because they are gutless and entirely free of any nagging principles.  Cap and trade systems would raise consumer prices at least as much as a carbon tax, but the price increase would appear to be made by industry and not due to a visible government tax.  Congress can point the finger at industry and say, it's not our fault, it's those greedy guys in industry driving up prices.

Further, the carbon tax is hard to game.  Everybody pays.  But cap and trade - Oh the beautiful potential to milk various constituencies for donations!  If the government sets up a program where some groups get credits for free, and some have to pay for them, well of course every industry is going to pour millions upon millions into politician's hands trying to make sure they are in the favored group. 

What a mess.  We are already seeing the huge distortions coming from nutty ethanol subsidies, and that is due to the pressure of just one industry (farmers and ADM).  Just think of the distortions form this program.  There may be a good chance that misguided attempts to manage greenhouse gasses may well be the largest threat to the American economy and free marketplace, well, ever.  Which, by the way, is why every Marxist and socialist on the face of the earth are right at the forefront of the global warming movement.

If you suspect that the world may be warming, but not nearly enough to justify such costs in terms of both dollars and lost freedom, you might want to read this.

From the Left: OK, Real Wages Are Growing

I know that my short-term memory isn't very good (a result of my Y chromosome, by my wife's explanation) but I could have sworn that the big issue in the last election from the left (beyond the war of course) was the indictment that real wages were not increasing -- i.e. that the average worker's wages were growing more slowly than inflation.

Now, this hypothesis was mostly bullshit, particularly when you factored in benefits with wages, but economic facts have never stood in the way of a little populist class demagoguing.  However, now it appears that when push comes to shove, no one on the left really believed any of it.

The other day, Kevin Drum posted this:

At the Democratic debate yesterday, Tom Vilsack
proposed a slow reduction in future Social Security benefits by
switching from wage indexing to price indexing

A number of folks, most on the left, called it a really bad idea.  Drum himself didn't have a definitive opinion, but seemed to think the idea at least screwy.  Why?  Well, these folks all thought that a shift from wage to price indexing would reduce benefits, and in fact that is what Vilsack thought -- he proposed it as a way to help close the future cash flow gap in Social Security.  Am I understanding this right?  Because the only way that this switch could reduce benefits would be if wages were growing faster than prices!  Surely I must be missing something?  Do we really have a bunch of Democrats all criticizing a plan because everyone universally assumes wages increase faster than prices?  Doesn't this contradict their whole meme in the election?

So I followed a link in one of these posts to the Center for Budget and Policy Priorities (I don't know how they would describe themselves politically, but looking at their body of work on the home page, you won't confuse them with Cato).  Apparently, this re-indexing scheme was also proposed by GWB (I missed that) and this site was criticizing his plan because it would reduce benefits.  And yes, there was the key line (emphasis added):

Under current law, initial Social Security
  benefits for each generation of retirees grow in tandem with average wages in the economy.  This ensures that each generation receives Social Security benefits that reflect the living standards of its times.  Full "price indexing" would make a change in the Social Security benefit formula so that initial Social Security benefits would keep pace only with prices, rather than wages, from one generation to the next.  Because prices increase more slowly than wages, this would result in progressively larger benefit reductions over time

There you have it.  Democrats and the left criticizing a plan because they assume wages go up faster than prices, so re-indexing from wages to prices would reduce benefits.  In fact, the folks I read accept this fact as so fundamental, everyone just assumes it to be true.  Is this wildly hypocritical or what?

Social Security: 83% Welfare

In my post earlier today, I analyzed my recent social security statement and found that the government was giving me a -0.8% (yes, that is negative) rate of return on my forced savings.  You can read that post for the methodology, which I admit was simplistic (I have a day job, after all) but I still think is pretty accurate.  There is not getting around the fact that the government is forcing
a retirement program on you that is such a ripoff that a private company would likely get
prosecuted for offering it.

One of the arguments I have seen go back and forth, and that I refer to in that post, is whether Social Security is a retirement plan or a welfare program (its a floor wax and a desert topping!)  One of the reasons this argument comes up so much is that its defenders take both sides of the question, depending on whom they are arguing against.  If you argue that as a welfare program, Social Security is terribly inefficient and pays too many benefits to richer workers, they argue it is a retirement program with premiums and you can't cut benefits to anyone who has paid in.  Argue as I did in this post that it is the worst retirement program in all of America, and its defenders say that you can't analyze it that way because there are welfare benefits embedded.

So I wondered, could I solve this with numbers?  I stared at my belly button for a moment, and decided that 6.5% was a good conservative private return number that I would be willing to plan my retirement around.  I plugged this number into my spreadsheet (Download socialsecurity4.xls) and found that my social security premiums, invested privately, would yield an annuity at 67 of $11,699 per month, or an amount 5.89 times larger than social security is currently promising me for the same inputs.  This tells me that only about 17% (1/5.89) of my taxes in social security are going to my own retirement.  The other 83% are going to a huge welfare program, either directly, as payments for someone else's retirement, or indirectly, through the inherent government inefficiency you accept when you provide intellectual welfare  (I define "intellectual welfare" as the government doing something for you because it doesn't trust you not to screw the task up if you did it yourself -- in this case, the task is saving for retirement).

Postscript:  As pointed out in my postscripts and the comments to the original post, taxes, inflation, spouse survival, etc.  all complicate the analysis, but most of the effects work both ways.   For example, Social Security provides some benefits to surviving spouses I don't include.  That potentially understates the value of the SS package.  However, as pointed out in the comments, private savings would be inheritable by my family in the case of my early death, and would dwarf SS survivor benefits in most cases.  Ditto for disability benefits.

Manufacturing Jobs Myth

From TJIC:

"America cannot be great if most of its workers are in the service
sector"¦" Senator Byron Dorgan (D-North Dakota) declares in his book
"Take This Job and Ship It,""¦

This typical reading of historic manufacturing and service jobs stats is ignorant.  My first rule of quoting a statistic, which I admit I sometimes violate, is to make sure you understand how it is calculated.  Nothing could be truer than with manufacturing jobs statistics.

The best way to illustrate this is by example.  Let's takean automobile assembly plant circa 1955.  Typically, a large manufacturing plant would have a staff to do everything the factory needed.  They had people on staff to clean the bathrooms, to paint the walls, and to perform equipment maintenance.  The people who did these jobs were all classified as manufacturing workers, because they worked in a manufacturing plant.  Since 1955, this plant has likely changed the way it staffs these type jobs.  It still cleans the bathrooms, but it has a contract with an outside janitorial firm who comes in each night to do so.  It still paints the walls, but has a contract with a painting contractor to do so.  And it still needs the equipment to be maintained, but probably has contracts with many of the equipment suppliers to do the maintenance.

So, today, there might be the exact same number of people in the factory cleaning bathrooms and maintaining equipment, but now the government classifies them as "service workers" because they work for a service company, rather than manufacturing workers.  Nothing has really changed in the work that people do, but government stats will show a large shift from manufacturing to service employment.

Is this kind of statistical shift really worth complaining about?  By complaining about the shift of jobs from manufacturing to services, you are first and foremost complaining about a chimera that is an artifact of how the statistics are compiled.  So if we were to correct for this, would manufacturing jobs be up or down?  I don't know, but given on the wailing about "shrinkage" of manufacturing in the US, I bet you would not have guessed this:

Considering total goods production (including things like mining and
agriculture in addition to manufacturing), real goods production as a
share of real (inflation-adjusted) Gross Domestic Product (GDP) is
close to its all-time high.

  • In the second quarter of 2003, real goods
    production was 39.2 percent of real GDP; the highest annual figure ever
    recorded was 40 percent in 2000. See the Figure.

  • By
    contrast, in the "good old days" of the 1940s, 1950s and 1960s, the
    United States actually produced far fewer goods as a share of total
    output, reaching 35.5 percent in the midst of World War II.

So manufacturing is close to an all time high as a percentage of the economy.  There is absolutely no way anyone who looks at this graph can, with a straight face, talk about the "shrinking" of America's manufacturing sector.   If manufacturing employment is somehow down vs. some historical "norm", then that means that manufacturing productivity has gone up faster than service productivity.  So what?  And to the extent there has been a shift, as TJIC writes, who cares?

Yeah, we hates the service sector.

Who needs lawn care, child care, food preparation, legal
services, stockbrokers, professors, blogs, actors, and contract
software engineers ?

Let's get everyone involved in good 19th century atoms-and-mortar activities like raising corn and smelting iron.

Sure, some flakes argue "those are jobs for machines", but we
aim to recapture the glory of our national greatness, when men were
men, women were women, America was strong, and the average life lasted
50 years and ended with pneumonia, a threshing accident, or a crushing
injury.

The same populists who complain today about the shift from manufacturing to services complained a hundred years ago about the shift from agriculture to manufacturing.  And I am sure all of us would much rather be waking up with the sun each day to push a plow.

Education Spending Myth

Jay Greene of the Manhattan Institute: (via Maggies Farm)

This
is the most widely held myth about education in America--and the one
most directly at odds with the available evidence. Few people are aware
that our education spending per pupil has been growing steadily for 50
years. At the end of World War II, public schools in the United States
spent a total of $1,214 per student in inflation-adjusted 2002 dollars.
By the middle of the 1950s that figure had roughly doubled to $2,345.
By 1972 it had almost doubled again, reaching $4,479. And since then,
it has doubled a third time, climbing to $8,745 in 2002.

Since
the early 1970s, when the federal government launched a standardized
exam called the National Assessment of Educational Progress (NAEP), it
has been possible to measure student outcomes in a reliable, objective
way. Over that period, inflation-adjusted spending per pupil doubled.
So if more money produces better results in schools, we would expect to
see significant improvements in test scores during this period. That
didn't happen. For twelfth-grade students, who represent the end
product of the education system, NAEP scores in math, science, and
reading have all remained flat over the past 30 years. And the high
school graduation rate hasn't budged. Increased spending did not yield more learning.

There is a lot more good stuff in the article, from class size to teacher pay.  I would observe that he misses one component of teacher pay -- that they tend to have higher than average benefit packages, which makes their jobs even more competitive with other professionals.  I covered much of the same ground 18 months ago in my Teacher Salary Myth post (which still earns me some good hate mail).

Flash: Labor Market Works Like It Always Does

During the last election, politicians and pundits made a lot of hay trying to argue that the labor market was somehow broken and not functioning like it always has.  First, the argument was that we were having a "jobless recovery."  Then, when employment took off, the argument was that wages were somehow broken and trailing productivity.  Whether this was a secret plot by GWB or by Wal-Mart was never quite made clear.

Well, it turns out that the job market works like it always has.  In a cyclical economic recovery, employment and productivity gains always precede wage gains.  Wages tend to go up late in the cycle, after excess available labor is soaked up:

After four years in which pay failed to keep pace with price
increases, wages for most American workers have begun rising
significantly faster than inflation.

With energy prices
now sharply lower than a few months ago and the improving job market
forcing employers to offer higher raises, the buying power of American
workers is now rising at the fastest rate since the economic boom of
the late 1990s.

The average hourly wage for workers below
management level "” everyone from school bus drivers to stockbrokers "”
rose 2.8 percent from October 2005 to October of this year, after being
adjusted for inflation, according to the Bureau of Labor Statistics. Only a year ago, it was falling by 1.5 percent.

I am not one to really accept the "active bias in media" argument (I believe in a more passive bias based on reporters failing to apply skepticism to stories that fit their view of the world).  However, the bias crowd predicted that reported economic news would suddenly improve after the election and that certainly seems to be the case.

One final note - be careful of folks who are claiming that wages have not kept up with inflation for years.  Make sure they are using "total compensation, including benefits" and not just "wages."  The former number has consistently outpaced inflation.  These numbers diverge because the portion of compensation paid out in non-cash benefits has been growing as a percent of total compensation.

More Zero Sum Economics (Sigh)

I have tried many times to combat the absurdity of zero-sum economic thinking.  Unfortunately, Democrats seem to be testing income-inequality messages as their lead horse to ride in the upcoming elections, so we are going to hear a lot more of it.  It bothers me even more when smart liberals like Kevin Drum buy into the zero sum thinking.  To his credit, he doesn't totally buy into this mess from Paul Krugman:

The concern [is] that, through mechanisms we're not entirely sure of, the very richest are siphoning off the economic growth before it flows through the middle and lower classes. The worry is about the distribution of growth, but the suspicion is that the distribution is being warped by the sheer level of inequality.

But then he goes onto say nearly the same thing:

I'm not sure this gets the mechanism quite right, though.  There are two basic ways that unequal growth can happen:

  1. The rich suck up vast amounts of income growth, and this leaves very little money for the middle class. Thus, wages for the middle class are stagnant or, at best, rising slowly.

  2. Middle class wages are kept stagnant, and this frees up vast amounts of money from economic growth. The money has to go somewhere, and it goes to the rich.

Now, obviously, it doesn't have to be one or the other. It could be both. But I suspect there's a lot more analytic power in #2 than in #1.

And finally, this stupendously ridiculous statement:

After all, the income from economic growth has to go somewhere, and if it's not going to the middle class it's going to end up going to the rich. Where else can it go?

What's bizarre about all of these statements is it treats wealth, and in this case specifically income growth, like a phenomena that is independent of individuals and their actions.  They treat income growth like it is a natural spring bubbling up from the ground, and a few piggy people have staked out places by the well and take all the water before the rest of us can get any.

Wealth and income growth comes from individual action.  Most rich people are getting more rich because they are intelligently investing and taking risks with their capital, applying the output of their mind to create new wealth.  There is no (none, zero, 0) economic correlation that says that if the rich get really rich, then there is less left over for the poor. 

Here is his solution:

Now, there's certainly no reason to reduce marginal tax rates on the hyper rich in an effort to make inequality even worse than it otherwise would be. But as unjustified as this is, tax cuts aren't the main issue. Median wages are. Focus government policy like a laser on improving the wages of the middle class, and reductions in income inequality will follow.

And how the hell does he suggest the government do that?  Seriously.  Can anyone tell me one single thing the government can do to improve middle class wages that does not involve tax policy?  Well, we can back into his solution from this paragraph where he lists things the government can do that are bad for the middle class:

Appoint members to the Federal Reserve who are obsessed with inflation and act to cool down the economy at the least sign that average hourly wages are rising. Make it harder to form unions in new industries, thus reducing the bargaining power of the working class. Support free trade agreements that put downward wage pressure on low-income workers. Support tax and deregulation policies that make middle class jobs less secure.

So presumably, his solution to increasing middle class wages is: 1) allow inflation to run at a higher rate 2) encourage unionization  3) adopt protectionist measures for uncompetitive industries and stifle free trade  4) increase regulation on businesses and reverse deregulation in industries (presumably like airlines and telecoms).

I'm no Julian Simon, but if we could structure a bet as to whether these policies would help real middle class wages, I would sure take the opposite side from Mr. Drum.

Here is my theory for what is going on, if you even accept that middle class income stagnation is real and not a symptom of our difficulty measuring the benefit of improving products and technologies.  I think much like technological advances from time to time in the past have caused restructurings in the labor market for blue collar workers, we are going through the same thing, really for the first time, with white collar middle class workers.  Technology and globalization offer all sorts of opportunities for companies, and the result is a real restructuring of how many types of white collar workers are used.  Until this restructuring is complete, wages may stagnate, since any wage pressure will just lead to companies implementing changes from their backlog of streamlining opportunities.

At some point we will work through this, and wages will rise again.  If anything, I think the government does damage by slowing this process down.  Note that nearly every one of Drum's suggestions would slow or stop this restructuring.  This is one of the ironies of progressives -- despite their name, what they don't like about capitalism is the change.   They want safety and predictability from the inherently unpredictable.  So protectionism slows global outsourcing, and also reduces the pressure for cost improvement.  Regulation tends to lock in current practices and make changes harder.  Ditto strong unions.

One of the reasons I like some of what Bill Clinton did was that in the early 90's, he faced tremendous pressure to take many of these same steps, trying to halt the economic restructuring that was occurring due to competition from Asia.  He didn't have the government step in, though, and he supported free trade, and the country thrived.  His fellow Democrats (including his wife) should learn from that.

update:  A real economist (unlike me and probably Paul Krugman) discusses inequality and unionization

update #2:  More real economists, this time the awsome guys at Cafe Hayek, pile on.

Gas Prices a Crisis??

The media is just longing to make current gas prices into a crisis.  And you can already see them gearing up to bash oil companies for "record" profits (by the way, when reading the profit announcements, pay attention not to just total dollars but to profit margins, then read this).

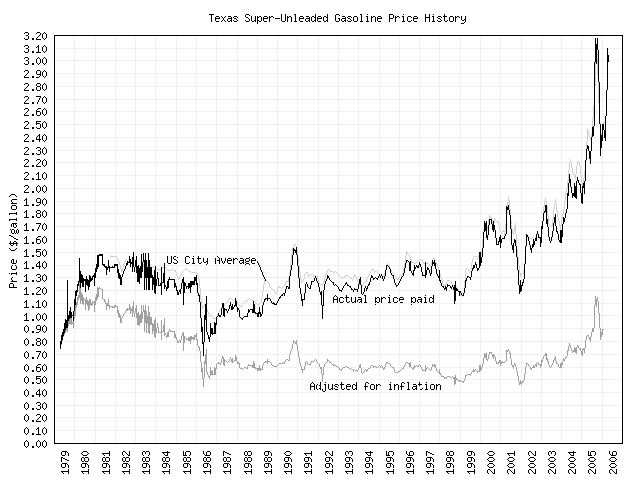
Glenn Reynolds links this gas price chart this morning at Random Useless Data, showing that in real terms, gas prices are still below their peaks, and not at "all-time highs."

Gasprice_1

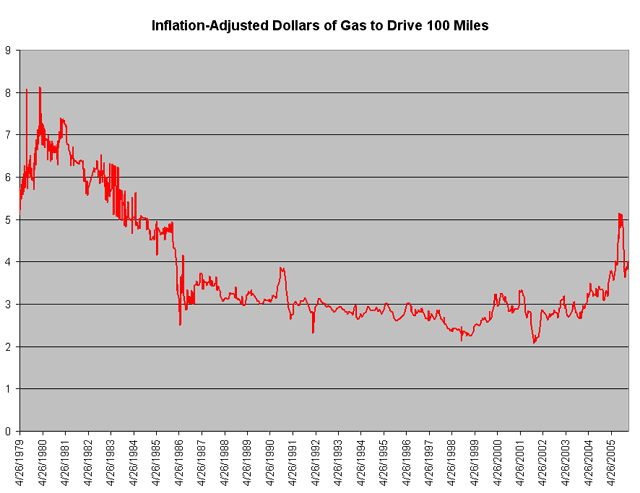
I took this one step further, based on the assumption that it isn't the price per gallon that matters for gas, but the price to drive a fixed mileage, say 100 miles.  Since average automobile fuel economy has continued to improve, in real terms we are far below the peak cost of gasoline.  Using this and this MPG data (for passenger cars) and the inflation adjusted gas prices here, I got this chart (1979 dollars)

Gas_price_100_1

By the way, just so you know my personal incentives, there are very few people out there who run a business whose fortunes are more sensitive to gas prices than my recreation business.  This will not be a very good summer for me, but if we leave the market alone to do its work, things will likely be better in 2007.  Intervention by Congress will pretty much assure that things will get worse.

Politicians and Prioritization

Imagine that you are in a budget meeting at your company.  You and a number of other department heads have been called together to make spending cuts due to a cyclical downturn in revenue.  In your department, you have maybe 20 projects being worked on by 10 people, all (both people and projects) of varying quality.   So the boss says "We have to cut 5%, what can you do?"  What do you think her reaction would be if you said "well, the first thing I would have to cut is my best project and I would lay off the best employee in my department". 

If this response seems nuts to you, why do we let politicians get away with this ALL THE TIME?  Every time that politicians are fighting against budget cuts or for a tax increase, they always threaten that the most critical possible services will be cut.  Its always emergency workers that are going to be cut or the Washington Monument that is going to be closed.  Its never the egg license program that has to be cut. 

I am reminded of this in driving long distance this weekend and I picked up, by one of those random late night AM skip-distance things, a station in Colorado, and it was full of commercials threatening dire consequences (old people will go hungry, kids won't get an education, emergency workers won't be there for your heart attack) if voters don't overturn TABOR, which is the tax plan that has, for over a decade, limited tax revenue collections to population growth plus inflation.  When I was in Colorado, I loved TABOR (the Cato institute has a nice article on why you should too) and really loved the tax refunds I often got because of it.

TABOR provides a fairly constant revenue stream to the government, in good times and bad.  When times are good, the government is flush, and when times are bad the government runs short (due to unemployment payments, more welfare, etc.).  Many of us in cyclical businesses deal with this all the time, and seem to be able to cut marginal programs added in good times that we can no longer fund in bad times.  Politicians are incapable of this.  Many businesses also underspend revenues by a wide margin in good times, knowing they will need the reserves in bad times.  Politicians are also incapable of this.

On Tuesday, Colorado voters will decide if they will require Colorado politicians to take the same responsibility for fiscal management that everyone else does in their private business lives, or if they will bail them out of their incompetance with more of their money. 

Going back to my example of suggesting in a budget meeting that you will cut your best programs and people in a budget crisis, would you expect to get more budget or to be fired?  Why can't we do the same with politicians?

Update: Bummer.  Coloradans voted to roll back TABOR.  Glad I don't live there anymore.  Roundup at Hit and Run.

GWB the Spending Champ

President Bush has passed even Lyndon Johnson for the title of worst spender in the last 40 years.  While it is probably not a surprise that real military spending has grown an outrageous 8.8% per year during his tenure, it is amazing to see that domestic spending has grown 7.1% (yes, that's real, excluding inflation) per year.  Absolutely shameful.  More here in this Cato report (pdf).

Revised data released during the summer by the Congressional Budget Office (CBO) provide analysts the ability to make side-by-side comparisons of the spending habits of each president during the last 40 years.1 All presidents presided over net increases in spending overall, though some were bigger spenders than others. As it turns out, George W. Bush is one of the biggest spenders of them all. In fact, he is an even bigger spender than Lyndon B. Johnson in terms of discretionary spending.

It is interesting to note that Bill Clinton, who drove Republicans into a frothing hatred, can rightly be classed, along with Reagan, as one of the two most fiscally conservative administrations in 40 years.  Granted the Republican Congress kept him honest on spending and carved off his roughest edges (e.g. Hillarycare) while Reagan had to fight his Congress tooth and nail, but this spending record in the Clinton years combined with his passage of NAFTA and welfare reform make him a far better free market defender than either of the Bushes that bracket him.  I wonder if, in turn, liberals who are driven into a frothing hatred for Bush, will someday come to appreciate the work he has done for them in expanding the size of government and slowing the pace of free trade.

More on the Housing Bubble

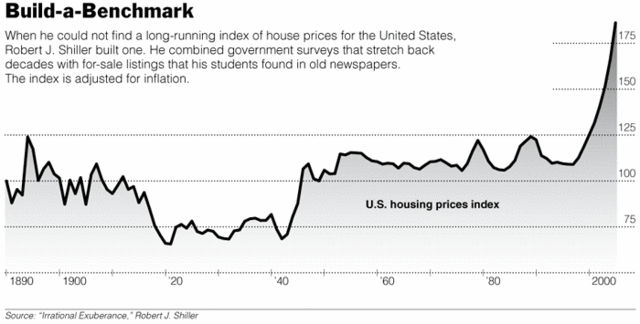
I can't check the guy's methodology, but Robert Shiller claims in the NY Times to have built a better, more accurate measure of housing prices.  You might ask, don't we already have that - I always see things like "median home sales price" in the paper?  The problem with existing metrics is that they don't correct for mix.  If a lot of large houses in the pricey part of town sell, median home prices will rise just given the mix shift of the sample.  What you really want is a price index for equivalent home sales, something that corrects for things like square feet, inflation, and perhaps zip code.  This is what Shiller claims to have done, and the results are dramatic.  He shows that real housing prices have been flat for most of the century, right up until the last decade, where they have increased dramatically.

Housingprices

I can't think of any structural change that would explain this (except maybe a change in relationship between mortgage rates and inflation) so it certainly creates a flashing red light saying "bubble". 

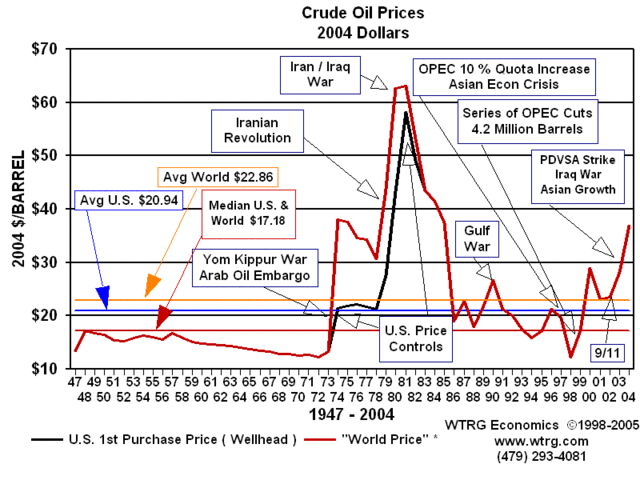
By the way, isn't it interesting that people can see the graph above and immediately think "prices are due to crash" but when they see this very similar chart:

Oilprice1947

...and think that prices will keep going up and up and up.

Hat tip to Marginal Revolution.  Other posts on housing prices here, here and here.  More on oil prices here.

Grade Inflation in the Ivy League

The Boston Globe has an article on John Kerry's recently released Yale grades.  Humorously, after all the sturm and drang of him supposedly being an intellectual titan to George Bush's dim-wittedness, his GPA was actually a notch lower than George's at Yale.  Personally, I could care less - grades are important for getting into grad school or that first job out of college.  I can't even imagine GPA coming up much in assessing one's suitability for a job in his forties or fifties.

Anyway, the point I take from this is more about grade inflation that suitability for the presidency.  Both Kerry and Bush got a selection of D's, C's, and B's, and no A's.  And while these may have not been standout grades, they certainly didn't seem to be out of the norm for the time.  My question:  Does any student today who can fog a mirror in the Ivy League today get grades this low?  My guess is no.

Postscript: By the way, Kerry released his military records (which were the source of the Yale grades) and there does not appear to be any ticking time bombs in it.  In fact, there are several pieces of information that would have helped him in the campaign, including commendations from several of his swift boat vet critics.  Why in the hell did he drag his feet on this and give the Republicans a free campaign issue?

Myth of Peak Oil

Note:  I have posted a more recent article with updated data here.

Mises Blog has a good article on the "Peak Oil" meme.  You may have gotten investment solicitations urging you to invest in oil because production is supposedly going to peak in 2006.

Oil production will peak some day.  I do not know when.  I do know that when I was in high school debate in the late 1970's, the topic one year was on resource policies.  I read everything there was at the time on oil supply as well as other critical mineral supplies.  Most "experts" at the time were predicting that oil would "run out" in about 1985 or 1990.  As you can see below, folks who invested in oil in 1980, after a price run-up similar to the one we have seen lately, got slaughtered.

Usgasoilprices19181999_1

Think twice or maybe three times about this graph before you invest.  Notice that there is no long term trend in real oil prices, even over one hundred years!  To make money buying oil, you have to do it on timing, buying ahead of sharp temporary increases.  And given that we are at the top of one of those sharp increases, can now really be the time to buy?

You can never get all the oil out of a field, and the exact amount of oil you can recover is dependent on how much you want to spend to do it, which in turn is related to oil prices (or expectations of oil prices).  The first 20% of the oil in a field might just squirt out under its own pressure.  The next 20% might have to be pumped.  The next 20% might need high pressure water injection to help it.  The next 20% might need expensive CO2 injection to help it.  If you ask the field manager how much oil was left, he would give you different answers at $20 and $45 a barrel, because he would make different assumptions about how far along this investment curve he would go.

If you are still thinking about investing, do one more thing: Study the famous bet between Paul Ehrlich and Julian Simon:

In 1980, economist |Julian Simon| and biologist Paul Ehrlich decided to put their money where their predictions were. Ehrlich had been predicting massive shortages in various natural resources for decades, while Simon claimed natural resources were infinite.

Simon offered Ehrlich a bet centered on the market price of metals. Ehrlich would pick a quantity of any five metals he liked worth $1,000 in 1980. If the 1990 price of the metals, after adjusting for inflation, was more than $1,000 (i.e. the metals became more scarce), Ehrlich would win. If, however, the value of the metals after inflation was less than $1,000 (i.e. the metals became less scare), Simon would win. The loser would mail the winner a check for the change in price.

Ehrlich agreed to the bet, and chose copper, chrome, nickel, tin and tungsten.

By 1990, all five metal were below their inflation-adjusted price level in 1980. Ehrlich lost the bet and sent Simon a check for $576.07. Prices of the metals chosen by Ehrlich fell so much that Simon would have won the bet even if the prices hadn't been adjusted for inflation. (1) Here's how each of the metals performed from 1980-1990.

Messed Up Pensions

Recently, the government announced that it would take over the United Airlines pilots pensions in the government-funded Pension Benefit Guaranty Corp.  This move is irritating pilots, because their pensions get reduced, and it is annoying to me as a taxpayer, that I have to bail out a company that was too screwed-up to fully fund its pension obligations. 

This points up the biggest danger of government guarantees -- it causes companies to be more reckless.  Back in the 80's, banks and S&L's made insanely risky investments with bank deposits.  The people who should have been most interested in this problem - bank depositors - ignored it because they felt safe that the government had guaranteed their deposits.  In the same way, airlines and other ailing businesses with defined benefit pensions cut back on pension funding when times were bad, and the very group that should have been crying foul - the company unions - did not, because they again counted on a bail-out.

I put the blame squarely on the company's management, who made a commitment to employees and then failed to keep it, and now are using government pension gaurantees as a subsidy to close their cash flow gap.  However, it is interesting to look at the role of unions too.  For decades, unions have demanded defined benefit pensions (ones that promise a fixed amount per month at retirement) and have opposed defined-contribution pensions (ones where the company promised to contribute a fixed amount today into an investment fund).  I assume the main reason for this is that unions do not want workers to bear the market risks on investments.

Over time, though, defined benefit plans have, despite this opposition, gone the way of the dinosaur (at least in private companies - most government jobs still have them).  This is for a number of reasons:

  • 401-K accounts now offer much of the same tax-deferral benefits for defined contribution programs that defined-benefit plans had
  • Defined-benefit plans turn out to have market risk too.  One is inflation - benefits levels may be guaranteed, but unexpectedly high inflation can effectively reduce them, while defined contribution plans, if invested correctly, will likely produce returns to offset these inflation losses.  In addition, during go-go stock markets, holders of defined-benefit plans found out that they did not enjoy the benefits of higher investment returns - their employers pocketed them (by the way, may Americans are discovering the same about their Social Security benefits).
  • As employees move around more, workers have found that defined benefit plans are not very portable, and tend to punish workers who do not stay for decades.  401-K plans are much more beneficial to workers who do not stay their whole career, or at least 20 years, in one place.
  • As United pilots have found, defined benefit pension plans are hard to police by current employees- there are just too many variables that allow companies to argue that the pensions are OK.  On the other hand, defined contribution plans are very easy to police- one can check the amount of contribution each month against the amount promised.
  • Finally, defined benefit plans rely on their company staying in business and fiscally sound for decades into the future.  This may have seemed a good bet at US Steel or United Airlines in 1950, but would anyone make that bet today?  For any company?