Phoenix Light Rail (Continued) Fail
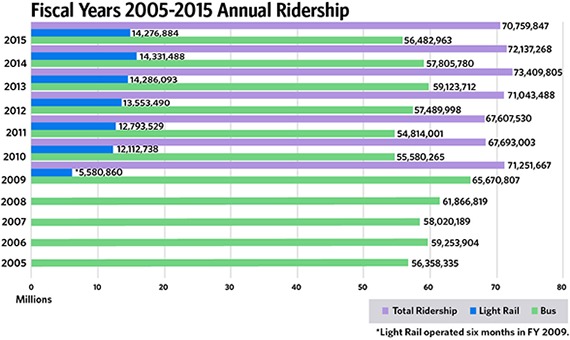
In 2014, I published an article based on Valley Metro's (our transit operator in Phoenix) very own ridership chart. Here was the chart I showed:
My point was that the huge amount of money spent on light rail, which essentially constituted a single commuting route in this enormous and spread-out city, was cannibalizing bus service. The cost and investment to carry a light rail passenger is at least an order of magnitude greater than that needed to carry a bus passenger, and no public system can long endure this sort of cost increase to shift passengers from a relatively cheap transit mode to an expensive one. Inevitably, bus service (which mainly benefits the poor) is terminated to pay for the train (which benefits middle and upper class riders who would not be caught dead on a bus). I am pretty sure the train would have been harder sell if they had been honest and said that they were going to have to cut bus service for the low-income working folks so that ASU students and Arizona Diamondbacks and Phoenix Suns fans could have a better way to get to the ballgame.
Anyway, Valley Metro has updated the chart for 2015 and it continues to look bad:
They were smart to cut off history on this one so you can't see how they killed the growth trend with the advent of light rail. But you see that total transit ridership fell, with a small fall in light rail ridership and a huge fall in bus ridership. Oops. As an aside, they still have not fixed their terrible chart plotting. You can see this years bar for light rail being longer than the one for 2013 despite the fact the number is lower.
The 2016 numbers will be interesting. Since 2015 they will have opened several light rail extensions and got themselves a huge new tax increase approved (over my stern opposition).
Update: In retrospect, the bus ridership fall was significant but "huge" probably is an exaggeration. I was fooled by looking at the bar lengths, which again seem to have nothing to do with the actual data. They are clearly drawing this manually -- no automatic charting program would get it this wrong.


