Global Temperature Update
I just updated my climate presentation with data through December of 2016, so given "hottest year evah" claims, I thought I would give a brief update with the data that the media seldom ever provides. This is only a small part of my presentation, which I will reproduce for Youtube soon (though you can see it here at Claremont-McKenna). In this post I will address four questions:
- Is the world still warming?
- Is global warming accelerating?
- Is global warming "worse than expected"?
- Coyote, How Is Your Temperature Prediction Model Doing?
Is the world still warming: Yes
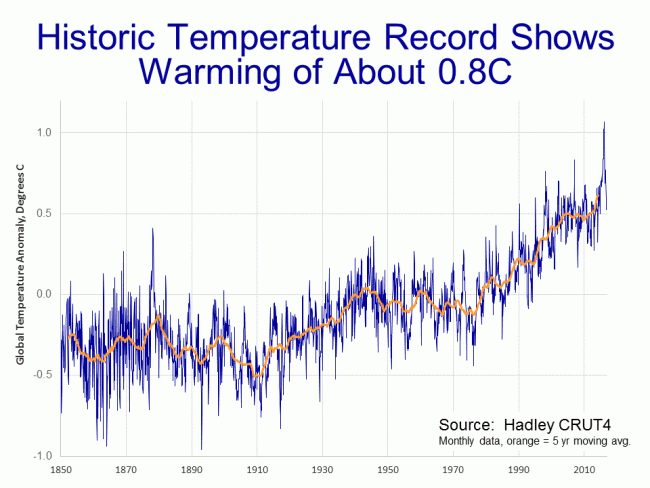
We will use two data sets. The first is the land surface data set from the Hadley Center in England, the primary data set used by the IPCC. Rather than average world absolute temperature, all these charts show the variation or "anomaly" of that absolute temperature from some historical average (the zero point of which is arbitrary). The theory is that it is easier and more accurate to aggregate anomalies across the globe than it is to average the absolute temperature. In all my temperature charts, unless otherwise noted, the dark blue is the monthly data and the orange is a centered 5-year moving average.
You can see the El Nino / PDO-driven spike last year. Ocean cycles like El Nino are complicated, but in short, oceans hold an order of magnitude or two more heat than the atmosphere. There are decadal cycles where oceans will liberate heat from their depths into the atmosphere, creating surface warming, and cycles where oceans bury more heat, cooling the surface.
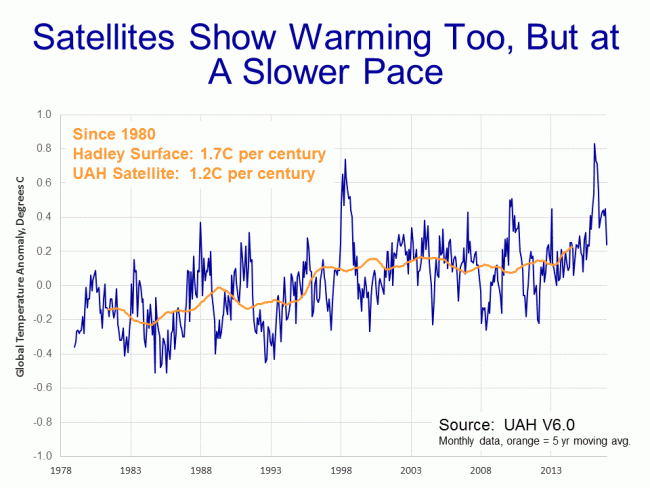
The other major method for aggregating global temperatures is using satellites. I use the data from University of Alabama, Huntsville.
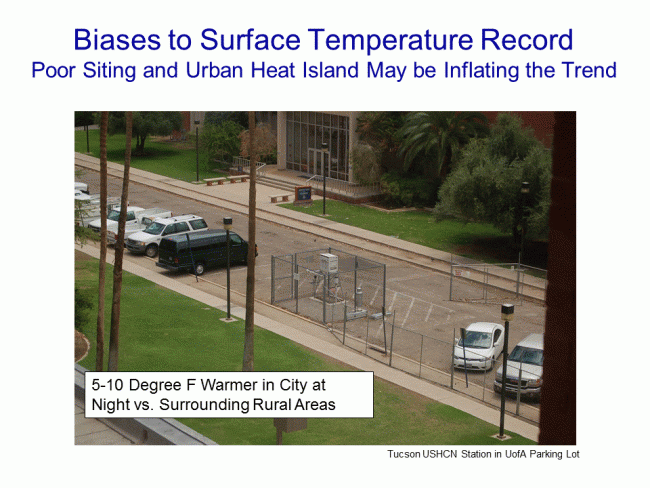
On this scale, the el nino peaks in 1999 and 2017 are quite obvious. Which method, surface or satellites, gets a better result is a matter of debate. Satellites are able to measure a larger area, but are not actually measuring the surface, they are measuring temperatures in the lower tropospehere (the troposphere's depth varies but ranges from the surface to 5-12 miles above the surface). However, since most climate models and the IPCC show man-made warming being greatest in the lower troposphere, it seems a good place to measure. Surface temperature records, on the other hand, are measuring exactly where we live, but can be widely spaced and are subject to a variety of biases, such as the urban heat island effect. The station below in Tucson, located in a parking lot and surrounded by buildings, was an official part of the global warming record until my picture became widely circulated and embarrassed them in to closing it.
This argument about dueling data sets goes on constantly, and I have not even mentioned the issues of manual adjustments in the surface data set that are nearly the size of the entire global warming signal. But we will leave these all aside with the observation that all data sources show a global warming trend.
Is Global Warming Accelerating? No
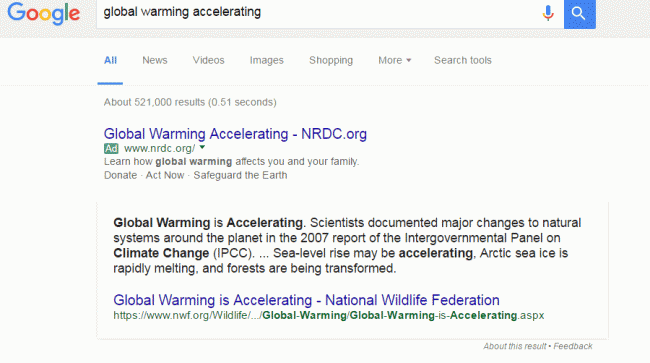
Go into google and search "global warming accelerating". Or just click that link. There are a half-million results about global warming accelerating. Heck, Google even has one of those "fact" boxes at the top that say it is:
It is interesting by the way that Google is using political advocacy groups for its "facts" nowadays.
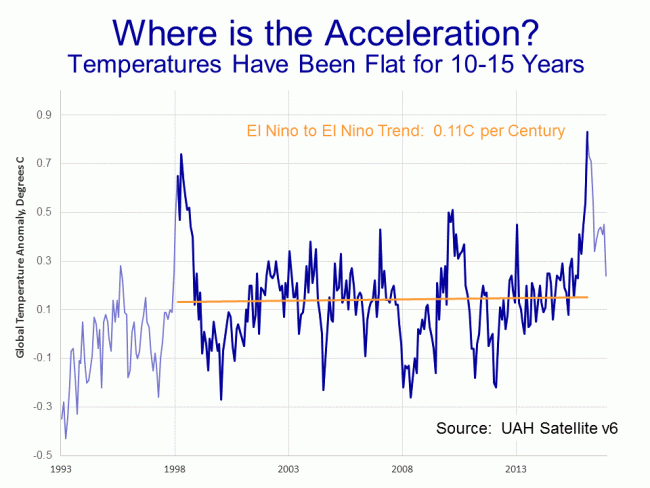
Anyway, if global warming is so obviously accelerating that Google can list it as a fact at the top of its search page, it should be obvious from the data, right? Well let's look. First, here is the satellite data since I honestly believe it to be of higher quality than the surface records:
This is what I call the cherry-picking chart. Everyone can find a peak for one end of their time scale and a valley for the other and create whatever story they want. In economic analysis, to deal with the noise and cyclicality, one will sometimes see economic growth measured peak-to-peak, meaning from cyclical peak to the next cyclical peak, as a simple way to filter out some of the cyclicality. I have done the same here, taking my time period as about 18 years from the peak of the 1999 El Nino to 2017 and the peak of the recent El Nino. The exact data used for the trend is show in darker blue. You can decide if I have been fair.
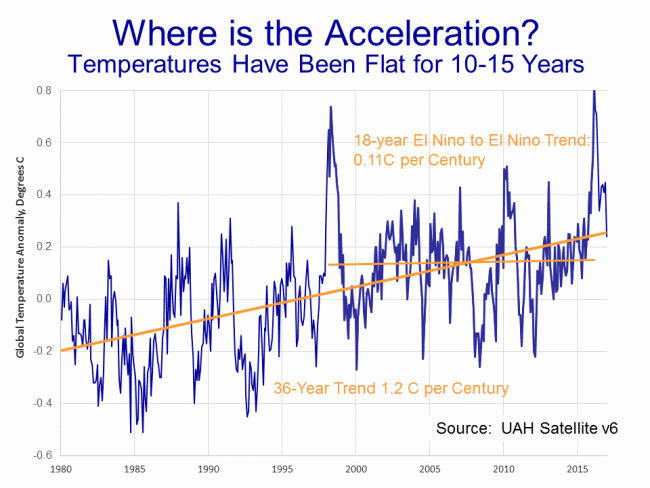
The result for this time period is a Nino to Nino warming trend of 0.11C. Now let's look at the years before this
So the trend for 36 years is 1.2C per century but the trend for the last half of this is just 0.11C. That does not look like acceleration to me. One might argue that it may again accelerate in the future, but I cannot see how so many people blithely treat it as a fact that global warming has been accelerating when it clearly has not. But maybe its just because I picked those darn satellites. Maybe the surface temperatures show acceleration?
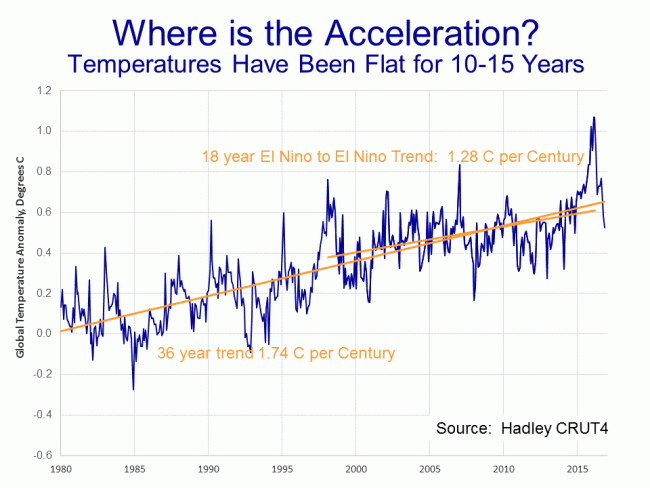
Nope. Though the slow down is less dramatic, the surface temperature data never-the-less shows the same total lack of acceleration.
Is Global Warming "Worse Than Expected"? No
The other meme one hears a lot is that global warming is "worse than expected". Again, try the google search I linked. Even more results, over a million this time.
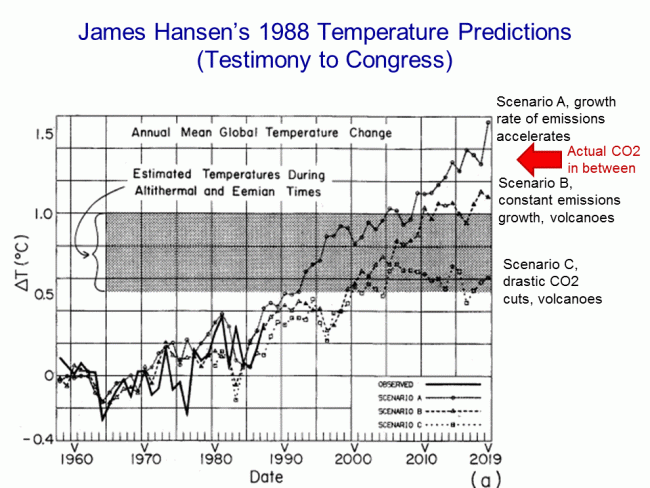
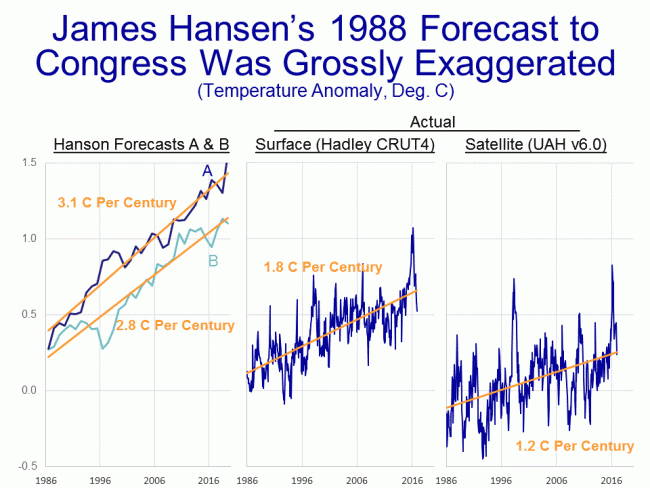
To tackle this one, we have to figure out what was "expected". Al Gore had his crazy forecasts in his movie. One sees all kinds of apocalyptic forecasts in the media. The IPCC has forecasts, but it tends to change them every five years and seldom goes back and revisits them, so those are hard to use. But we have one from James Hansen, often called the father of global warming and Al Gore's mentor, from way back in 1988. His seminal testimony in that year in front of Congress really put man-made global warming on the political map. Here is the forecast he presented:
Unfortunately, in his scenarios, he was moving two different variables (CO2 levels and volcanoes) so it is hard to tell which one applies best to the actual history since then, but we are almost certainly between his A and B forecasts. A lot of folks have spent time trying to compare actual temperatures to these lines, but it is very hard. The historical temperature record Hansen was using has been manually adjusted several times since, so the historical data does not match, and it is hard to get the right zero point. But we can eliminate the centering issues altogether if we just look at slopes -- that is all we really care about anyway. So I have reproduced Hanson's data in the chart on the left and calculated the warming slopes in his forecast:
As it turns out, it really does not matter whether we choose the A or B scenario from Hansen, because both have about the same slope -- between 2.8C and 3.1C per century of warming from 1986 (which appears to be the actual zero date of Hansen's forecast) and today. Compare this to 1.8C of actual warming in the surface temperature record for this same period, and 1.2C in the satellite record. While we have seen warming, it is well under the rates predicted by Hansen.
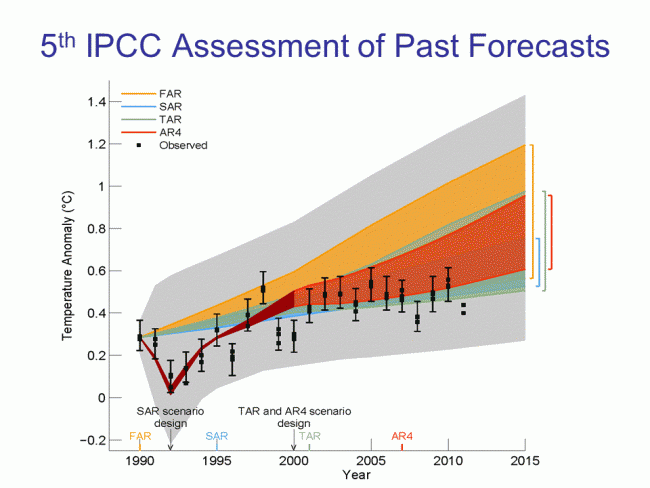
This is a consistent result to what the IPCC found in their last assessment when they evaluated past forecasts. The colored areas are the IPCC forecast ranges from past forecasts, the grey area was the error bar (the IPCC is a bit inconsistent when it shows error bars, including error bands seemingly only when it helps their case). The IPCC came to the same result as I did above: that warming had continued but was well under the pace that was "expected" form past forecasts.
By the way, the reason that many people may think that global warming is accelerating is because media mentions of global warming and severe weather events has been accelerating, leaving the impression that things are changing faster than they truly are. I wrote an article about this effect here at Forbes. In that I began:
The media has two bad habits that make it virtually impossible for consumers of, say, television news to get a good understanding of trends
- They highlight events in the tail ends of the normal distribution and authoritatively declare that these data points represent some sort of trend or shift in the mean
- They mistake increases in their own coverage of certain phenomenon for an increase in the frequency of the phenomenon itself.
Coyote, How Is Your Temperature Prediction Model Doing? Great, thanks for asking
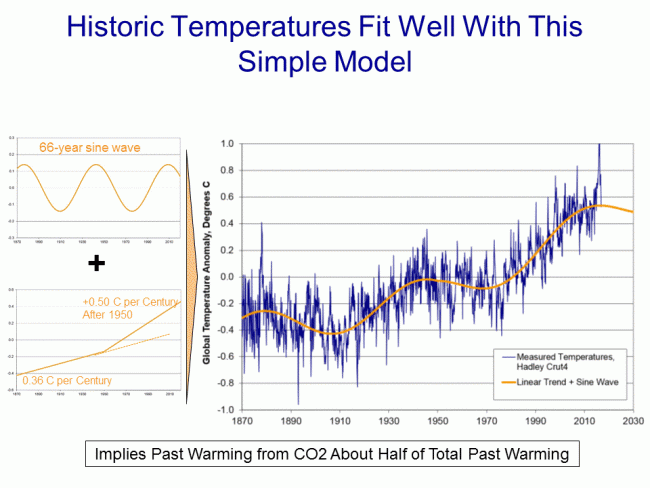
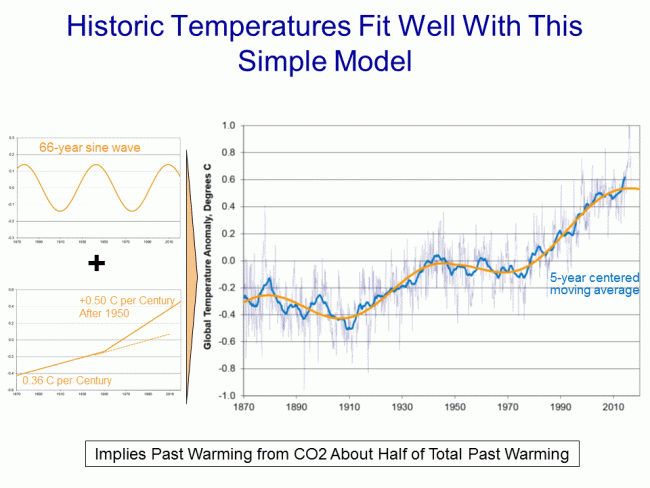
Ten years ago, purely for fun, I attempted to model past temperatures using only three inputs: A decadal cyclical sin wave, a long-term natural warming trend out of the little ice age (of 0.36 C per century), and a man-made warming trend really kicking in around 1950 (of 0.5C per century). I used this regression as an attribution model, to see how much of past warming might be due to man (I concluded about half of 20th century warming may be due to manmade effects). But I keep running it to test its accuracy, again just for fun, as a predictive tool. Here is where we are as of December of 2016 (in this case the orange line is my forecast line):
Still hanging in there: Despite the "hottest year evah" news, temperatures in December were exactly on my prediction line. Here is the same forecast with the 5-year centered moving average added in light blue:
Nice work! Thanks for doing this. Why didn't you do Hansen's scenario C? Looks to me like it's between 1 and 1.5 slope 1986-2016. In other words, we're following Hansen's "best case" scenario pretty closely now, and were way under it until the 2015-2016 El Nino.
Pretty sure he didn't use it because scenario C is what Hasen predicted as the result of "drastic CO2 cuts" that didn't happen.
So when they closed the temperature station in the parking lot, did the data change at all? Did your quest to close it have any effect?
The effect of one site is very minor to the overall data. However, there are many very poorly sited stations in the record. But it doesn't really matter anyways because the folks in charge of the data set make "manual adjustments" that do in fact need to be made, however, they are typically in the opposite direction as what would be expected. They make the current and recent past temperatures warmer and further past temperatures cooler resulting in increased warming over time. In fact, you can track the data releases from year to year and see temperatures from 1930's get cooler and cooler with subsequent data set releases. Apparently they keep finding new reasons to lower historic temps.
If they are questioned on this they claim they are very open about their adjustments (they are not) and then quickly shift to the talking points that if you don't take every word they say as gospel truth with no evidence then you are a flat-earth believing climate change denier. Even if you believe that earth is warming and in part due to humans, if you believe the warming will not result in a disaster requiring massive intervention, then you are a full fledged denier who probably questions gravity as well. There is no longer any toleration for debate (exhibit A - Warren getting dis-invited to give his climate presentation a few times).
Sadly, I believe climate science is fundamentally broken in that the objective is just to get government funding if you are a scientist and if you are an activist to get laws passed that you favor. And the more drastic and over the top you are the more you can press your case for more funding or legislation. In fact, if you make a documentary with incredible exaggerations and outright falsehoods you can win an Emmy. I doubt his planned follow-up documentary this year, will detail how none of his disaster scenarios occurred.
http://www.reportingclimatescience.com/2016/05/11/mann-paper-pause-was-not-foreseeable/
Michael Mann – Claims the pause was not foreseeable –
Really, the amo/pdo cycles have shown up very promentantly 4 times in the temp records since the 1750’s
Hint to Mann – I can understand why you missed it since you relied on the bristlecone pines whose temp reconstructions dont even reflect the local temps
What they are suppose to do is this: Whenever a station is moved, they take temperature/wind and other data from the old and new station for a period of two years. After two years, they adjust the new station temps so that they match, or are in line with old temperature stats. Then the old station is taken down. That is a legitimate use of adjustment.
These years after the fact adjustments are bogus.
Coyote: Is this Daily Mail article relevant to your post?
http://www.dailymail.co.uk/sciencetech/article-4192182/World-leaders-duped-manipulated-global-warming-data.html?utm_content=bufferdb7f6&utm_medium=social&utm_source=twitter.com&utm_campaign=buffer
Skeptical Science doesnt like you - they seem to think you pulled "positive Feedbacks" out of your backside since it is not part of any climate science theory.
https://www.skepticalscience.com/correcting-warren-meyer-on-forbes.html
Run a search on the skeptical Science website & you get over 200 hits for feedbacks - Yet they claim that feedbacks were never part of the climate science.
joe - at 07:00 AM on 21 February, 2017
Where did Warren get the idea of positive feedbacks - maybe from these links
https://www.skepticalscience.com/understanding-climate-feedbacks.html
https://www.skepticalscience.com/clouds-negative-feedback.htm
https://www.skepticalscience.com/sensitivity-training.html
https://www.skepticalscience.com/Anderson.html
0 0
Moderator Response:
[PS] Since original article doesnt mention a "Warren" nor positive feedbacks, this is offtopic. Perhaps you meant to post here? (although your links appear to reinforce the article assertions that Meyer doesnt know what he is talking about.)