Posts tagged ‘AK’

What Both the Coke and The Pepsi Parties Have In Common

Legislators in both parties share one common belief -- that after millions of dollars and years of effort getting elected to their position, they don't want to hear anyone tell them their power is somehow limited.

"That somehow or other these are unconstitutional because they're not enumerated within the powers of the constitution, that somehow or other we should just be eliminating these, I think that is out of the mainstream," Sen. Lisa Murkowski (R-AK) said on MSNBC.

No campaign rules or financing "reform", or even a wholesale change in Congressional makeup from the Pepsi to the Coke party, is going to change anything unless the fundamental problem of the expansion of government power is addressed.

Chicken Little: The Supposed Arizona Immigrant-Led Crime Wave

Conservatives often attack global warming alarmists for using individual outlier events at the tails of the normal distribution (e.g. Katrina) to fan panic about climate change.  So it is interesting to see them doing the same thing themselves on immigrants and crime in Arizona.  [sorry, forgot the link to Expresso Pundit]

Of course, the whole story fell apart when Wagner had to introduce this fact.

While smugglers have become more aggressive in their encounters with authorities, as evidenced by the shooting of a Pinal County deputy on Friday, allegedly by illegal-immigrant drug runners, they do not routinely target residents of border towns.

Sure, that's the ticket, violence hasn't increased in actual border towns...of course, roving drug smugglers just used an AK 47 to gun down a deputy in PINAL County a hundred miles north of the border.  But other than that...and the rancher they killed last month...the border towns themselves are pretty calm.

Excuse me, but has anyone on any side of the immigration debate ever claimed that immigrants have never committed a crime?  Forget for a minute that the guilty parties in these two cases are mere supposition without any charges filed yet -- particularly the case of the rancher last month.  In 2008 there were about 407 killings in the state.  So, like, one a month were maybe by immigrant gangs and this is a crisis?

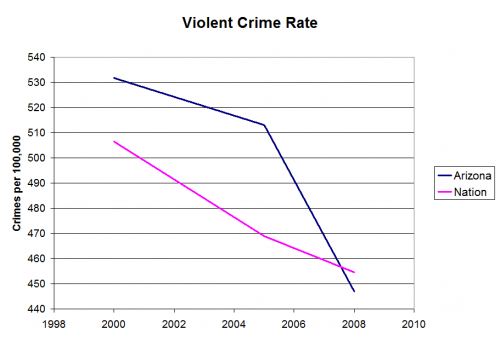
From the link above, I looked up AZ and US crime states in 2000, 2005, and 2008.  I was too lazy to do every year and 2009 state stats don't appear to be online yet.  Here is the crisis in Arizona in violent crime rates:

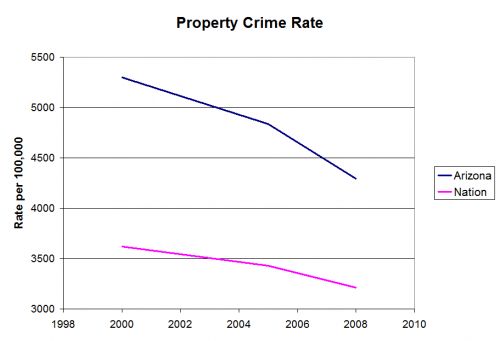
Oh Noz, we seem not only to have drastically reduced our violent crime rate right in the teeth of this immigrant "invasion" but we also have reduced it below the US average.  This actually understates the achievement, since Arizona is more highly urbanized than the average state  (yeah, I know this is counter-intuitive, but it was true even 20 years ago and is more true today).  Urban areas have higher crime rates than rural areas, particularly in property crime as below:

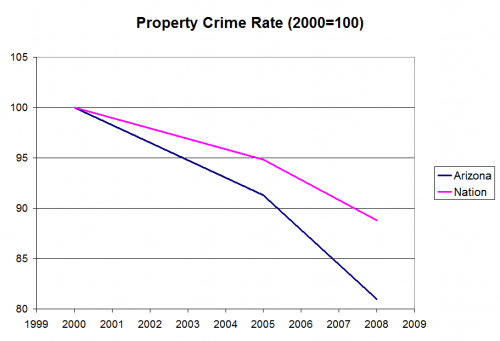
So our property crime rate is high, but not totally out of line from other highly urban areas.  But the real key here is that during this supposed immigrant invasion, again Arizona has improved faster than the national average.  This is seen more clearly when we index both lines to 2000.

One may wonder why climate change alarmists only wave around anecdotes rather than averages.  If we really are seeing more drought or floods, show us the averages.  The problem is that their story can't be seen in the averages, so they are forced to rely on anecdotes to inflame the population.   The same appears to be true of our Arizona immigration panic.

Update: Some doubts emerge about Pinal County deputy shooting update: or perhaps not

Security Theater

Anyone who flies regularly and has not thought of at least five ways they could easily beat airport security isn't really trying.  Jeffrey Goldberg actually tries a few:

Suspicious that the measures put in place after the attacks of September 11 to prevent further such attacks are almost entirely for show"”security theater is the term of art"”I have for some time now been testing, in modest ways, their effectiveness. Because the TSA's security regimen seems to be mainly thing-based"”most of its 44,500 airport officers are assigned to truffle through carry-on bags for things like guns, bombs, three-ounce tubes of anthrax, Crest toothpaste, nail clippers, Snapple, and so on"”I focused my efforts on bringing bad things through security in many different airports, primarily my home airport, Washington's Reagan National, the one situated approximately 17 feet from the Pentagon, but also in Los Angeles, New York, Miami, Chicago, and at the Wilkes-Barre/Scranton International Airport...

Schnei­er and I walked to the security checkpoint. "Counter­terrorism in the airport is a show designed to make people feel better," he said. "Only two things have made flying safer: the reinforcement of cockpit doors, and the fact that passengers know now to resist hijackers." This assumes, of course, that al-Qaeda will target airplanes for hijacking, or target aviation at all. "We defend against what the terrorists did last week," Schnei­er said. He believes that the country would be just as safe as it is today if airport security were rolled back to pre-9/11
levels. "Spend the rest of your money on intelligence, investigations, and emergency response."

Though I have to give props to the TSA for supporting first Amendment rights, I am not sure their concern over free speech and privacy was driving this encounter:

On another occasion, at LaGuardia, in New York, the
transportation-security officer in charge of my secondary screening
emptied my carry-on bag of nearly everything it contained, including a
yellow, three-foot-by-four-foot Hezbollah flag, purchased at a
Hezbollah gift shop in south Lebanon. The flag features, as its
charming main image, an upraised fist clutching an AK-47 automatic
rifle. Atop the rifle is a line of Arabic writing that reads Then surely the party of God are they who will be triumphant.
The officer took the flag and spread it out on the inspection table.
She finished her inspection, gave me back my flag, and told me I could
go. I said, "That's a Hezbollah flag." She said, "Uh-huh." Not "Uh-huh,
I've been trained to recognize the symbols of anti-American terror
groups, but after careful inspection of your physical person, your
behavior, and your last name, I've come to the conclusion that you are
not a Bekaa Valley"“trained threat to the United States commercial
aviation system," but "Uh-huh, I'm going on break, why are you talking
to me?"

It turns out, incredibly, that most airport employees are not screened.  Because, you know, it would be grossly unfair to subject airport staff to the same sort of time-wasting indignities to which we all must acquiesce.  Also, many commercial flights have a belly-full of US mail which I am pretty sure is not inspected in any way.

Is There a Zero-Cost Regulatory Solution to Energy Efficiency?

A while back, I criticized a story in the NY Times, as quoted by Kevin Drum, that said that California had among the lowest per capita electricity usage of any state (true) and that this was because of the intelligent regulation regime in the state (yes, but not the way they meant).  The implication of Drum's argument was that there was some sort of efficiency ideal that a smart group of technocrats could reach at limited cost to the state (false). Specifically, Drum argued:

Anyway, it's a good article, and goes to show the kinds of things we
could be doing nationwide if conservative politicians could put their
Chicken Little campaign contributors on hold for a few minutes and take
a look at how it's possible to cut energy use dramatically "” and reduce
our dependence on foreign suppliers "” without ruining the economy. The
energy industry might not like the idea, but the rest of us would.

My response, in part, was this:

Well, here are the eight states in the data set above that the
California CEC shows as having the lowest per capita electricity use:
CA, RI, NY, HI, NH, AK, VT, MA.  All right, now here are the eight
states from the same data set that have the highest electricity prices:  CA, RI, NY, HI, NH, AK, VT, MA.  Woah!  It's the exact same eight states!  The 8 states with the highest prices are the eight states with the lowest per capita consumption.
Unbelievable.  No way that could have an effect, huh?  It must be all
those green building codes in CA.  I suspect Drum is sort of right,
just not in the way he means.  Stupid regulation in each state drives
up prices, which in turn provides incentives for lower demand.  It
achieves the goal, I guess, but very inefficiently.  A straight tax
would be much more efficient.

As part of a presentation I am working on about global warming and proposed California CO2 abatement bill AB52, I had the occasion to do a bit more research.  All of my data is from the Energy Information Administration, whose page URLs keep changing and thus breaking my links but this index page to data seems to stay the same.

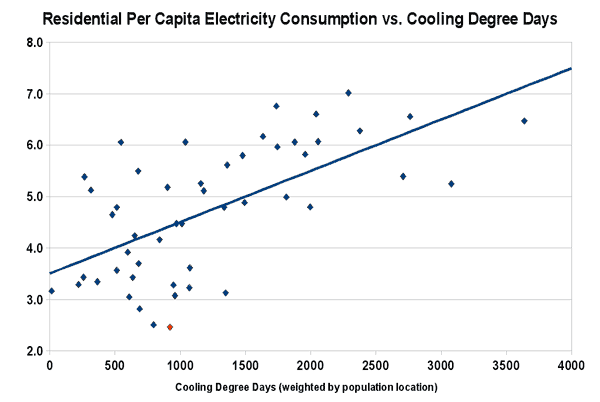
I found three factors that seem to be the main drivers of state electricity demand (which is measured in all of the charts below in thousands of kw-h per capita).  The first factor is climate, and certainly California has one of the milder climates.  The chart below looks at residential electricity demand vs. cooling degree days (weighted for population location).  Each data point is a state, with California is shown as the red data point:
Electricitybystatecdd

We get something similar for heating degree days, with electrical use going down as the climate gets milder, though not as good of a fit, which is not surprising since electricity is less important to heating than cooling.  Since California is well below the line, mild climate can be said to explain some of its lead on other states, but not all.

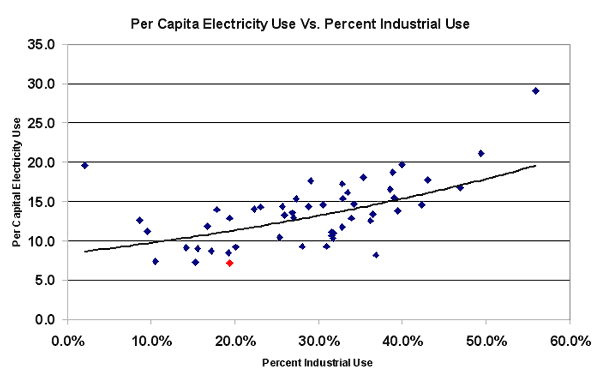
So I looked next at the percentage of electricity demand that goes to industry.  More heavily industrialized states will have a higher total per capita demand, because heavy industry chews up electricity that other types of businesses do not.  It turns out that California has a relatively low industrial use, which is not surprising given the regulatory environment there and the degree to which industry has been chased out of the state (one would have to be a madman to, all things considered, set up a new factory in California).  So here is the same type of chart of total electrical per capita use by state vs. the % industrial demand, again with each data point a state and California in red:
Electricitybystateindust

Again there is a pretty strong relationship, and again we see some but not all of California's low per capita consumption explained.  In effect, states on the left have exported their high-electricity-use industries to the states on the right (or to other countries).

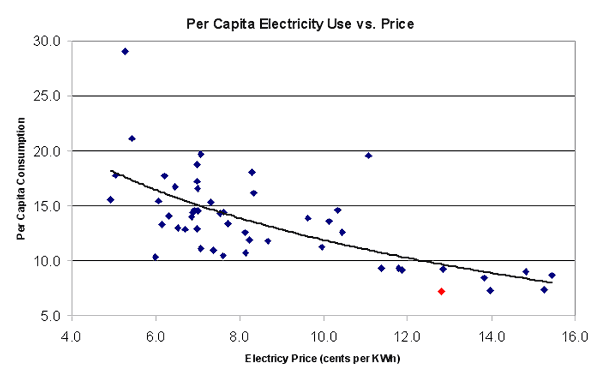
I have saved the most obvious relationship for last:  price.  It turns out unsurprisingly that the states with the highest electricity prices have the lowest per capital consumption:

Electricitybystateprice

Rolling climate, industrial intensity, and price together, these factors seem to explain at least 80% of California's efficiency lead over other states.  California government regulatory policy does indeed drive lower electrical consumption, just not exactly the way they would like you to think.  By chasing industries out of the state and raising electricity costs above those of almost every other state, California has reached a lower per capita consumption level.

I Do Not Think Your Data Means What You Think It Means

Kevin Drum, building on a story from the NY Times, uses data from the California Energy Commission to make the case that California is the most efficient user of electricity in the country and that this efficiency can be attributed sole to government intervention.  Drum, always on the lookout for an excuse for the government to take over some sector of the economy, concludes:

Anyway, it's a good article, and goes to show the kinds of things we
could be doing nationwide if conservative politicians could put their
Chicken Little campaign contributors on hold for a few minutes and take
a look at how it's possible to cut energy use dramatically "” and reduce
our dependence on foreign suppliers "” without ruining the economy. The
energy industry might not like the idea, but the rest of us would.

On its face, California's numbers are impressive.  The CEC's numbers show California to have the lowest per capita electricity use in the nation, using electricity at half the national rate and one quarter the "least efficient" states.

This would be really cool if it were true that a few simple public policy steps could cut per capital energy consumption in half.  Unfortunately, though I am willing to posit California is better than average (as any state would be with a mild climate and newer housing), the data doesn't say what Drum and the article are trying to make it say. 

The consumption data is from here.  You can see that there are three components that matter - residential, commercial, and industrial.  Residential and commercial electricity consumption may or may not be fairly apples to apples comparable between states (more in a minute).  Industrial consumption, however, will not be comparable, since the mix of industries will change radically state by state.  As an extreme example, states with high aluminum production or oil refining or steel making, which are electricity intensive, will have a higher per capita industrial electricity consumption, irrespective of public policy.  The graph Drum and the NY Times uses includes industrial consumption, which is a mistake -- it is more reflective of industry mix than true energy efficiency.

Take two of the higher states on the list.  Wyoming, at the top of the per capita consumption list, has industrial electricity consumption as a whopping 58% of total state consumption.  KY, also near the top, has industrial consumption at 50% of total demand.  The US average is industrial consumption at 29% of total demand.  CA, NY, and NJ, all near the bottom of the list in terms of per capital demand, have industrial use as 20.6%, 15.1%, and 16% respectively.  So rather than try to correlate electricity consumption to local energy regulations, it is clear that the per capita consumption numbers by state are a much better indicator of the presence of heavy industry. In other words, the graph Drum shows is actually a better illustration of the success of CA not in necessarily becoming more efficient, but in exporting its pollution to other states.  No one in their right mind would even attempt to build a heavy industrial plant in CA in the last 30 years.  The graph is driven much more by the growth of industrial electricity use outside CA relative to CA.

Now take the residential numbers.  Lets look again at the states at the top of the per capita list:  Alabama, South Carolina, Louisiana, Tennessee, Arkansas, Mississippi, Texas.  Can anyone tell me what these states have in common?  They are hot and humid.  Yes, California has its hot spots, but it has its mild spots too  (also, California hot spots are dry, so they can use more energy efficient evaporative cooling, something that does not work in the deep south).  These southern states are hot all over in the summer.  So its reasonable to assume that maybe, just maybe, some of these hot states have higher residential per capita consumption because of air conditioning load?  In fact, if one recast this list as residential use per capita, you would see a direct correlation to summer air conditioning loads.   This table of cooling degree days weighted for population location is a really good proxy for how much air conditioning is needed by state.  (Explanation of cooling degree days). You can see that states like Alabama and Texas have two to four times the number of cooling degree days than California, which should directly correlate to about that much more per capita air conditioning (and thus electricity) use.

In fact, I have direct knowledge of both Alabama and Texas.  Both have seen a large increase in residential per capita electricity use vis a vis California over the last thirty years.  Granted.  But do you know why?  The number one reason for increased residential electricity use in the South is the increased access of the poor, particularly poor blacks, to air conditioning.  It is odd to see a liberal like Drum railing against this trend. Or is it that he just didn't bother to try to understand the numbers?

OK, now I have saved the most obvious fisking for last.  Because even when you correct for these numbers, California is pretty efficient vs. the average on electricity consumption.  Drum attributes this, without evidence, to government action.  The NY Times basically does the same, positing in effect that CA has more energy laws than any other state and it has the lowest consumption so therefore they must be correlated.  But of course, correlation is not equal to causation.  Could there be another effect out there?

Well, here are the eight states in the data set above that the California CEC shows as having the lowest per capita electricity use:  CA, RI, NY, HI, NH, AK, VT, MA.  All right, now here are the eight states from the same data set that have the highest electricity prices:  CA, RI, NY, HI, NH, AK, VT, MA.  Woah!  It's the exact same eight states!  The 8 states with the highest prices are the eight states with the lowest per capita consumption.  Unbelievable.  No way that could have an effect, huh?  It must be all those green building codes in CA.  I suspect Drum is sort of right, just not in the way he means.  Stupid regulation in each state drives up prices, which in turn provides incentives for lower demand.  It achieves the goal, I guess, but very inefficiently.  A straight tax would be much more efficient.

Please, is there anyone in the "reality-based community" that cares that their data really is saying what they think it is saying??
The New Huey Long

Rep. Don Young (R-AK) is vying to become the new Huey Long.  As head of the House transportation and infrastructure committee, he is in prime position to bring home massive, unnecessary infrastructure projects to his district.  Huey Long, former emperor governor of Louisiana, is justly famous for acquiring funds to build some spectacularly unnecessary bridges over the Mississippi above and below New Orleans.

Representative Young seems to be headed for the same achievement.

If Rep. Young succeeds, tiny Ketchikan, Alaska, a town with less than 8,000 residents (about 13,000 if the entire county is included) will receive hundreds of millions of federal dollars to build a bridge to Gravina Island
(population: 50). This bridge will be nearly as long as the Golden
Gate Bridge and taller than the Brooklyn Bridge.

The Gravina
Bridge would replace a 7-minute ferry ride from Ketchikan to Ketchikan  Airport on Gravina Island. Project proponents tell the public that the bridge is a transportation necessity, though the ferry system adequately handles passenger traffic between the islands, including traffic to and from the airport.1  Some herald the project as the savior of Ketchikan because it will open up land on Pennock Island to residential development, despite the fact that Ketchikan's population has been shrinking.

Taxpayers for Common Sense have a great article here on how the whole earmark thing works.  Here is just a taste:

By the time
this is over, Congress will have packed this with a record level of transportation pork. The political formula was simple: $14 million was the minimum for every district. Anybody who sits on the Transportation and Infrastructure Committee can expect $40-60 million, and House
and committee leadership will get $90 million or more.

If you look at it on a per capita basis,  the highest per capita earmark spending is ... in the home state of the committee chairman, Young (gee, what a weird coincidence):

In total dollars,
California is the biggest winner so far with nearly $1.4 billion in earmarks. Delaware receives the smallest share, with only $12
million. On a per capita basis, however, Alaska wins going away.
Based on the $722 million in earmarks for Alaska in the bill's current
version, $1,151 would be shipped north for every man, woman, and child in the state. Rep. Young's isn't done yet, however, and before this bill is law, Alaska's share of earmarks will likely increase
even more. Alaska did nearly as well last year; during the failed
attempt to pass a transportation bill, Rep. Young secured nearly
$600 million for Alaska, including $375 million for two bridge projects, Gravina Access project in Ketchikan and the Knik Arm Crossing in Anchorage.

Update: Via the Club for Growth, comes this related story of the $1.5 million bus stop in Anchorage.

Tom Wilson is faced with a problem many city administrators would envy: How to
spend $1.5 million on a bus stop.

Wilson, Anchorage's director of public transportation, has all that money for
a new and improved bus stop outside the Anchorage Museum of History and Art
thanks to Republican Sen. Ted Stevens (news,
bio,
voting
record
) "” fondly referred to by Alaskans as "Uncle Ted" for his prodigious
ability to secure federal dollars for his home state....

The bus stop there now is a simple steel-and-glass, three-sided enclosure.
Wilson wants better lighting and seating. He also likes the idea of heated
sidewalks that would remain free of snow and ice. And he thinks electronic signs
would be nice....

"We have a senator that gave us that money and I certainly won't want to
appear ungrateful," he said. At the same time, he does not want the public to
think the city is wasting the money. So "if it only takes us $500,000 to do it,
that's what we will spend."

That is still five to 50 times the typical cost of bus stop improvements in
Anchorage.