More Lame Economic Analysis
Kevin Drum and the left think falling savings rates are all ... wait for it you are going to be shocked with surprise ... Reagan's fault. OK, you are not surprised, since in left-world everything that is not Bush's fault is either Reagan's, Wal-mart's or Exxon's.
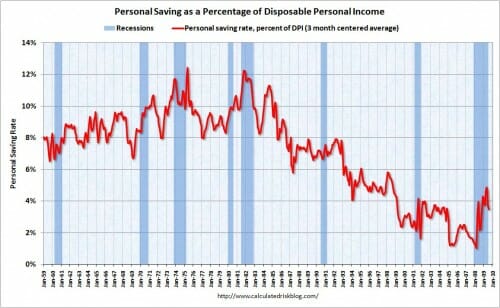
Paul Krugman looks at this chart of the personal savings rate in the United States and concludes that Reaganomics is the most likely reason that it fell off a cliff....
But I'd point to two other things that Krugman mentions: financial deregulation and stagnant median wages. Those seem like much more likely villains to me. Starting in the late 70s, middle class wages flattened out, which meant there was only one way for most people to support the increasing prosperity they had long been accustomed to: borrowing. At the same time, financial deregulation unleashed an industry that marketed itself ever more aggressively on all fronts: credit cards, debit cards, payday loans, day trading, funky home mortgage loans, and more. It was a match made in hell: a culture that suddenly glorified debt; an easy money policy from the Fed that made it available; a predatory financial industry that promoted it; and middle-class workers who dived in to the deep end without ever quite knowing why they were doing it.So, yeah, Reagan did it. Sort of. But he had plenty of help.
This is a great variation of the classic "I know what caused bad trend X -- everything I was against before I learned about bad trend X." The following was my response in the comments:
- The chart on the left starts out at 8%. Drum picked a recession peak as his starting point, a clever trick, but it appears that when Bush 1 left office the number was still about 8%. The largest fall seems to be in the Clinton years. For which, by the way, I don't "blame" Clinton any more than Reagan, certainly not without any real evidence or understanding of the mechanism involved.
- Drum's "consumers are all stupid pawns of electronics retailers and credit card companies" wears thin at some point. It's funny how everyone thinks this is true... of everyone else, but not himself.
- Let me posit an alternative. The 1980s and 1990s saw huge percentage increases in asset values, both equities and homes. This began just about at the time the savings rate dipped. I would posit that consumers, in their mental calculation of savings, included paper gains on these assets. These paper gains are not, to my knowledge, included in savings rate numbers (you can be sure that is true because, if they were, savings rates would have dropped in late 2008). Thus consumers saved less money from their paycheck (which is measured, so it showed a drop in savings rate) while they considered themselves still to be saving as much or more as previously, because they were counting paper profits on assets as savings. The big decreases coincide with the 80's bull market, the 90's bull market / internet bubble, and this decades housing bubble.
My explanation in number three will look even better if we see an increase in savings rate over the coming years as consumer expectations about asset value changes are made less exuberant by the recent burst bubble. A fascinating chart would be to plot savings rate against some measure of consumer expectations of future asset price increases. I bet they would correlate pretty well.

