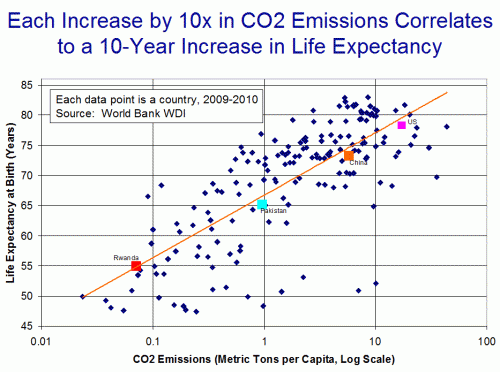
Precautionary Principle in One Chart
The ultimate argument I get to my climate talk, when all other opposition fails, is that the precautionary principle should rule for CO2. By their interpretation, this means that we should do everything possible to abate CO2 even if the risk of catastrophe is minor since the magnitude of the potential catastrophe is so great.
The problem is that this presupposes there are no harms, or opportunity costs, on the other end of the scale. In fact, while CO2 may have only a small chance of catastrophe, Bill McKibben's desire to reduce fossil fuel use by 95% has a near certain probability of gutting the world economy and locking billions into poverty. Here is one illustration I just crafted for my new presentation. As usual, click to enlarge:
A large number of people seem to assume that our use of fossil fuels is an arbitrary choice among essentially comparable options (or worse, a sinister choice forced on us by the evil oil cabal). In fact, fossil fuels have a number of traits that make them uniquely irreplaceable, at least with current technologies. For example, gasoline has an absolutely enormous energy content per pound of fuel. Most vehicles - space shuttles, and more recently electric cars - must dedicate an enormous percentage of their power production just to moving the weight of their fuel. Not so in gasoline engine cars, something those who are working with electric cars must face every day.
By the way, if you want to see the kick-off of version 3.0 of my climate presentation, it will be at my son's school, Amherst College, this Thursday at 7PM. More here.
Update: By the way, I was careful in the chart to say the two " are correlated". I actually do not think one causes the other. In this case, I think there are a third, and fourth, and fifth (etc.) factors that cause both. For example, economic development leads to (and depends on) increased fossil fuel use and CO2 emissions, and it leads to longer lives.
