Update On My Climate Model (Spoiler: It's Doing a Lot Better than the Pros)
In this post, I want to discuss my just-for-fun model of global temperatures I developed 6 years ago. But more importantly, I am going to come back to some lessons about natural climate drivers and historic temperature trends that should have great relevance to the upcoming IPCC report.
In 2007, for my first climate video, I created an admittedly simplistic model of global temperatures. I did not try to model any details within the climate system. Instead, I attempted to tease out a very few (it ended up being three) trends from the historic temperature data and simply projected them forward. Each of these trends has a logic grounded in physical processes, but the values I used were pure regression rather than any bottom up calculation from physics. Here they are:
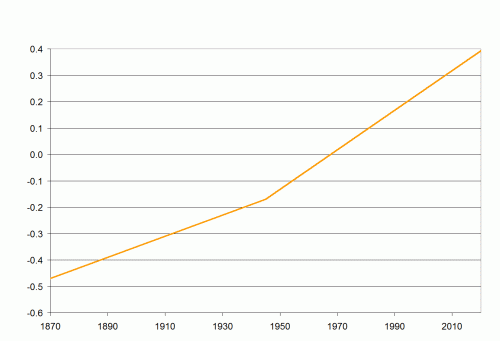
- A long term trend of 0.4C warming per century. This can be thought of as a sort of base natural rate for the post-little ice age era.
- An additional linear trend beginning in 1945 of an additional 0.35C per century. This represents combined effects of CO2 (whose effects should largely appear after mid-century) and higher solar activity in the second half of the 20th century (Note that this is way, way below the mainstream estimates in the IPCC of the historic contribution of CO2, as it implies the maximum historic contribution is less than 0.2C)
- A cyclic trend that looks like a sine wave centered on zero (such that over time it adds nothing to the long term trend) with a period of about 63 years. Think of this as representing the net effect of cyclical climate processes such as the PDO and AMO.
Put in graphical form, here are these three drivers (the left axis in both is degrees C, re-centered to match the centering of Hadley CRUT4 temperature anomalies). The two linear trends (click on any image in this post to enlarge it)
And the cyclic trend:
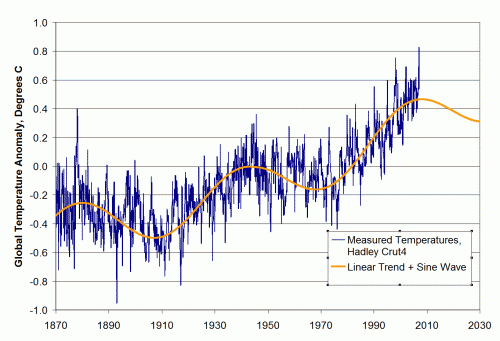
These two charts are simply added and then can be compared to actual temperatures. This is the way the comparison looked in 2007 when I first created this "model"
The historic match is no great feat. The model was admittedly tuned to match history (yes, unlike the pros who all tune their models, I admit it). The linear trends as well as the sine wave period and amplitude were adjusted to make the fit work.
However, it is instructive to note that a simple model of a linear trend plus sine wave matches history so well, particularly since it assumes such a small contribution from CO2 (yet matches history well) and since in prior IPCC reports, the IPCC and most modelers simply refused to include cyclic functions like AMO and PDO in their models. You will note that the Coyote Climate Model was projecting a flattening, even a decrease in temperatures when everyone else in the climate community was projecting that blue temperature line heading up and to the right.
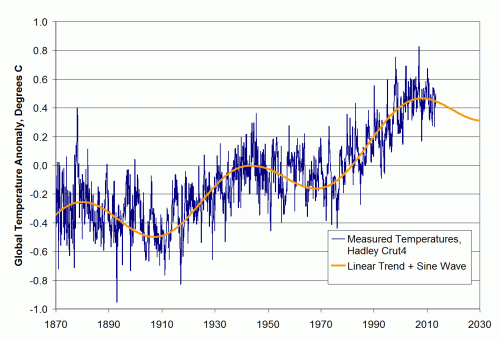
So, how are we doing? I never really meant the model to have predictive power. I built it just to make some points about the potential role of cyclic functions in the historic temperature trend. But based on updated Hadley CRUT4 data through July, 2013, this is how we are doing:
Not too shabby. Anyway, I do not insist on the model, but I do want to come back to a few points about temperature modeling and cyclic climate processes in light of the new IPCC report coming soon.
The decisions of climate modelers do not always make sense or seem consistent. The best framework I can find for explaining their choices is to hypothesize that every choice is driven by trying to make the forecast future temperature increase as large as possible. In past IPCC reports, modelers refused to acknowledge any natural or cyclic effects on global temperatures, and actually made statements that a) variations in the sun's output were too small to change temperatures in any measurable way and b) it was not necessary to include cyclic processes like the PDO and AMO in their climate models.
I do not know why these decisions were made, but they had the effect of maximizing the amount of past warming that could be attributed to CO2, thus maximizing potential climate sensitivity numbers and future warming forecasts. The reason for this was that the IPCC based nearly the totality of their conclusions about past warming rates and CO2 from the period 1978-1998. They may talk about "since 1950", but you can see from the chart above that all of the warming since 1950 actually happened in that narrow 20 year window. During that 20-year window, though, solar activity, the PDO and the AMO were also all peaking or in their warm phases. So if the IPCC were to acknowledge that any of those natural effects had any influence on temperatures, they would have to reduce the amount of warming scored to CO2 between 1978 and 1998 and thus their large future warming forecasts would have become even harder to justify.
Now, fast forward to today. Global temperatures have been flat since about 1998, or for about 15 years or so. This is difficult to explain for the IPCC, since about none of the 60+ models in their ensembles predicted this kind of pause in warming. In fact, temperature trends over the last 15 years have fallen below the 95% confidence level of nearly every climate model used by the IPCC. So scientists must either change their models (eek!) or else they must explain why they still are correct but missed the last 15 years of flat temperatures.
The IPCC is likely to take the latter course. Rumor has it that they will attribute the warming pause to... ocean cycles and the sun (those things the IPCC said last time were irrelevant). As you can see from my model above, this is entirely plausible. My model has an underlying 0.75C per century trend after 1945, but even with this trend actual temperatures hit a 30-year flat spot after the year 2000. So it is entirely possible for an underlying trend to be temporarily masked by cyclical factors.
BUT. And this is a big but. You can also see from my model that you can't assume that these factors caused the current "pause" in warming without also acknowledging that they contributed to the warming from 1978-1998, something the IPCC seems loath to do. I do not know how the ICC is going to deal with this. I hate to think the worst of people, but I do not think it is beyond them to say that these factors offset greenhouse warming for the last 15 years but did not increase warming the 20 years before that.
We shall see. To be continued....
Update: Seriously, on a relative basis, I am kicking ass


