What is Normal?
I titled my very first climate video "What is Normal," alluding to the fact that climate doomsayers argue that we have shifted aspects of the climate (temperature, hurricanes, etc.) from "normal" without us even having enough historical perspective to say what "normal" is.
A more sophisticated way to restate this same point would be to say that natural phenomenon tend to show various periodicities, and without observing nature through the whole of these cycles, it is easy to mistake short term cyclical variations for long-term trends.
A paper in the journal Water Resources Research makes just this point using over 200 years of precipitation data:
We analyze long-term fluctuations of rainfall extremes in 268 years of daily observations (Padova, Italy, 1725-2006), to our knowledge the longest existing instrumental time series of its kind. We identify multidecadal oscillations in extremes estimated by fitting the GEV distribution, with approximate periodicities of about 17-21 years, 30-38 years, 49-68 years, 85-94 years, and 145-172 years. The amplitudes of these oscillations far exceed the changes associated with the observed trend in intensity. This finding implies that, even if climatic trends are absent or negligible, rainfall and its extremes exhibit an apparent non-stationarity if analyzed over time intervals shorter than the longest periodicity in the data (about 170 years for the case analyzed here). These results suggest that, because long-term periodicities may likely be present elsewhere, in the absence of observational time series with length comparable to such periodicities (possibly exceeding one century), past observations cannot be considered to be representative of future extremes. We also find that observed fluctuations in extreme events in Padova are linked to the North Atlantic Oscillation: increases in the NAO Index are on average associated with an intensification of daily extreme rainfall events. This link with the NAO global pattern is highly suggestive of implications of general relevance: long-term fluctuations in rainfall extremes connected with large-scale oscillating atmospheric patterns are likely to be widely present, and undermine the very basic idea of using a single stationary distribution to infer future extremes from past observations.
Trying to work with data series that are too short is simply a fact of life -- everyone in climate would love a 1000-year detailed data set, but we don't have it. We use what we have, but it is important to understand the limitations. There is less excuse for the media that likes to use single data points, e.g. one storm, to "prove" long term climate trends.
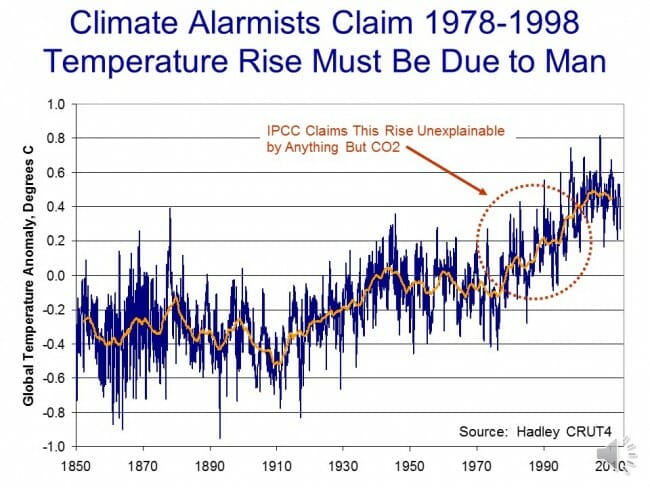
A good example of why this is relevant is the global temperature trend. This chart is a year or so old and has not been updated in that time, but it shows the global temperature trend using the most popular surface temperature data set. The global warming movement really got fired up around 1998, at the end of the twenty year temperature trend circled in red.
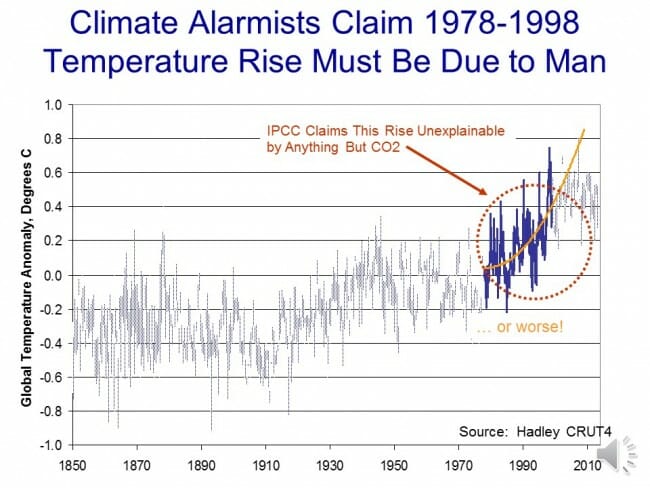
They then took the trends from these 20 years and extrapolated them into the future:
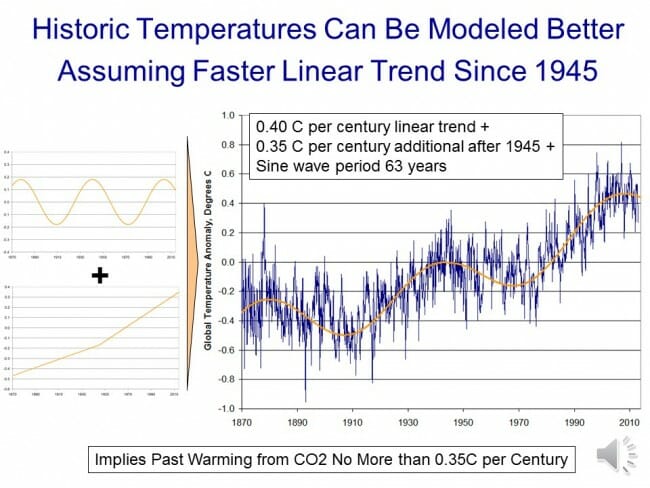
But what if that 20 years was merely the upward leg of a 40-60 year cyclic variation? Ignoring the cyclic functions would cause one to overestimate the long term trend. This is exactly what climate models do, ignoring important cyclic functions like the AMO and PDO.
In fact, you can get a very good fit with actual temperature by modeling them as three functions: A 63-year sine wave, a 0.4C per century long-term linear trend (e.g. recovery from the little ice age) and a new trend starting in 1945 of an additional 0.35C, possibly from manmade CO2.
In this case, a long-term trend still appears to exist but it is exaggerated by only trying to measure it in the upward part of the cycle (e.g. from 1978-1998).

