Posts tagged ‘Mark Perry’

Differential Inflation

I am seeing an increasing number of articles of late about differential inflation rates, and how changes in income inequality may be overstated by using a single inflation rate for rich and poor.  The argument goes that lower income folks who spend a relatively high share of income on goods that Wal-Mart and China have made cheap are experiencing a lower inflation rate than wealthier folks who have seen huge price increases at their favorite Four Seasons resort.  Mark Perry has two interesting articles along these lines.

Re-Evaluating Home Ownership

Mark Perry has had a series of posts of late presenting the hypothesis that high rates of home ownership in the US may be detrimental as it reduces labor mobility.  The argument goes that homeowners have a harder time moving for new jobs than renters do.

Homeownership
impedes the economy's readjustment by tying people down. From a social
point of view, it's beneficial that homeownership encourages commitment
to a given town or city. But, from an economic point of view, it's good
for people to be able to leave places where there's less work and move
to places where there's more. Homeowners are much less likely to move
than renters, especially during a downturn, when they aren't willing
(or can't afford) to sell at market prices. As a result, they often
stay in towns even after the jobs leave. And reluctance to move not
only keeps unemployment high in struggling areas but makes it hard for
businesses elsewhere to attract the workers they need to grow.

The argument makes sense on its surface, but I am having a bit of trouble buying into it (though I will admit that as an American, I am steeped in decades of home-ownership-boosterism, so I may not be approaching the problem without bias).

On the plus side, the selling a home and buying a new one certainly has more costs than switching apartments, particularly if you add in a moving premium for home owners who can accumulate a lot more stuff than apartment dwellers and the switching costs due to emotional attachment to the current house.  Also, on its face, the argument is similar to criticisms of the economy of the antebellum south, where too much capital was invested in land and assets tied to the land.

However, I see a couple of problems with it.  First, its hard to find an increase in structural unemployment rates in the past decades to correlate to the increase in home ownership.  Second, the costs to change homes has been falling of late as the government-protected Realtor monopoly is finally being broken by technology and commission rates are falling.  Third, my sense is (though I can't dig up the data) that the average time in a home is dropping, meaning homes flip owners more frequently, again indicating a decreasing barrier to moving.

I would, however, be willing to accept that in a high home ownership regime, falling home prices and lengthening for-sale times could exacerbate an economic downturn by slowing mobility and thereby slowing the correction.  I would have argued in the past that this was offset by home equity as a savings tool and a source of cash in difficult times, but that could be different this time around as mortgage policies have tightened, drying up the ability to convert equity to emergency cash.

Don't Panic!

OK, the light at the end of the tunnel may be a train, but so far it is too soon to panic about bank failures.*  Mark Perry brings us this chart for perspective:
Bank1

Of course, since we are in an election cycle, current problems are going to be portrayed as the worst economy since the Weimar Republic, or whatever.  Perry has a lot more in the post.

Throw All The Speculators in Jail! Tax Their Windfall Profits!

Clearly a speculative bubble:  (via Mark Perry)

Azsthpi_max_630_378

Tax their windfall profits!  Throw the speculators in jail!  Oh, wait.  That would be all of us Arizona homeowners.  Never mind, then.  This is entirely different from oil, because, um, well, it just is.

Why Does The US Appear to Have Higher Infant Mortality?

I am sure you have seen various rankings where the US falls way behind other western nations in terms of infant mortality.  This stat is jumped on by the left as justification for just how cold and heartless America is, and just how enlightened socialized medicine must be.  However, no one seems to bother to check the statistic itself (certainly the media is too incompetent to do so, particularly when it fits their narrative).  Statistics like this that are measured across nations are notoriously unreliable, as individual nations may have different definitions or methods for gathering the data.

And, in fact, this turns out to be the case with infant mortality, a fact I first reported here (related post on medical definitions driving national statistics here).  This week, Mark Perry links to an article further illuminating the issue:

The main
factors affecting early infant survival are birth weight and
prematurity. The way that these factors are reported "” and how such
babies are treated statistically "” tells a different story than what
the numbers reveal.  Low
birth weight infants are not counted against the "live birth"
statistics for many countries reporting low infant mortality rates.

According
to the way statistics are calculated in Canada, Germany, and Austria, a
premature baby weighing less than 500 kg is not considered a living
child.

But
in the U.S., such very low birth weight babies are considered live
births. The mortality rate of such babies "” considered "unsalvageable"
outside of the U.S. and therefore never alive
"” is extraordinarily
high; up to 869 per 1,000 in the first month of life alone. This skews
U.S. infant mortality statistics.Norway
boasts one of the lowest infant mortality rates in the world. But when
the main determinant of mortality "” weight at birth "” is factored in,
Norway has no better survival rates than the United States....

In the United States, all infants who show signs of life at birth
(take a breath, move voluntarily, have a heartbeat) are considered
alive.

If a child in Hong Kong or Japan is born alive but dies within the
first 24 hours of birth, he or she is reported as a "miscarriage" and
does not affect the country's reported infant mortality rates....

Efforts to salvage these tiny babies reflect this classification. Since
2000, 42 of the world's 52 surviving babies weighing less than 400g
(0.9 lbs.) were born in the United States.

Hmm, so in the US we actually try to save low-birthweight babies rather than label them unsalvageable.  Wow, we sure have a cold and heartless system here.  [disclosure:  My nephew was a very pre-mature, very low-birthweight baby who could have fit in the palm of your hand at birth and survived by the full application of American medical technology.  He is doing great today]

United States: Export Tiger

Barack Obama and most of the Democratic Party (as well as a sizable Lou Dobbs contingent in the Republican Party) fear trade and globalization.  But like it or not, much of our economic growth is driven directly or indirectly by trade.  In particular, even I found the export growth rates in this chart from Mark Perry surprisingly large:
Exports

The Real Reason Why ExxonMobil Profits Suck

Because they are too freaking low!  ExxonMobil (XOM) is a cyclical company that is following on 20 years of middling prices for their commodity and finally have a price spike, and they only manage to make 8.5% return on sales  ($11.68 billion profit on $138 billion of revenues).  At the top of their cycle they are barely making the same profit margin as the average industrial company.  This is not good.   Sure, the absolute dollars are large, but it is a large company, and the absolute dollars of revenues, expenses, and taxes are also large.

While this outcome may be confusing to many  (since the press and politicians insist on calling these mediocre profits "windfall"), they are in effect the reflection of a new reality for western oil companies.  Less and less do companies like XOM operate their own oil fields.  They are increasingly concession operators or really glorified service companies and middle men to state producers. 

Disclosure:  I am an XOM stockholder, and I am not happy.

Postscript:  This from Mark Perry is kind of interesting:

Exxon has already paid $19.828 billion in income taxes for 2008 (data here),
and will probably pay almost $40 billion in income taxes this year (see
graph above, income tax data for 1999-2007 taken from Exxon's annual
reports).

To
put $40 billion of income taxes in perspective, it can be reasonably
estimated that Exxon will pay more in income taxes this year (both here
and outside the U.S.) than the entire bottom 50% of American individual
taxpayers (about 67 million) will pay in income taxes this year.

Perry has a number of notes and updates in response to questions about how he got these figures at the bottom of his post.

Update:  Yahoo Finance data and ranking on profitability by industry.  Integrated oil companies come in around #60.

Duh

From the Interagency Task Force on Commodity Markets, via Mark Perry:

The Task
Force's preliminary assessment is that current oil prices and the
increase in oil prices between January 2003 and June 2008 are largely
due to fundamental supply and demand factors. During this same period,
activity on the crude oil futures market "“ as measured by the number of
contracts outstanding, trading activity, and the number of traders "“
has increased significantly. While these increases broadly coincided
with the run-up in crude oil prices, the Task Force's preliminary
analysis to date does not support the proposition that speculative
activity has systematically driven changes in oil prices.

The
world economy has expanded at its fastest pace in decades, and that
strong growth has translated into substantial increases in the demand
for oil, particularly from emerging market countries. On the supply
side, the production of oil has responded sluggishly, compounded by
production shortfalls associated with geopolitical unrest in countries
with large oil reserves. As it is very difficult to rely on substitutes
for oil in the short term, very large price increases have occurred as
the market balances supply and demand (see top two charts above).

If
a group of market participants has systematically driven prices,
detailed daily position data should show that that group's position
changes preceded price changes. The Task Force's preliminary analysis,
based on the evidence available to date, suggests that changes in
futures market participation by speculators have not systematically
preceded price changes. On the contrary, most speculative traders
typically alter their positions following price changes, suggesting
that they are responding to new information "“ just as one would expect
in an efficiently operating market.

Congress and other agencies have commissioned studies of this type on oil markets and prices approximately every 90 days or so for the last 35 years, and every one of them have come to the same conclusion:  Oil markets move based on the participant's best guesses about trends in supply and demand.  Duh.  As I wrote previously, the last hydrocarbon price manipulation case I have seen in court was aimed at a group that allegedly manipulated prices for 30 seconds at the end of a trading day whose closing price affected certain contracts.  And it is not clear that they were successful. 

Wow, I Was Wrong

Here-to-fore, I had generally accepted the meme that where Wal-mart moves in to small towns, smaller stores tend to fail due to the competition.  Unlike most who spread this meme, however, my response has generally been, "so?"  The number of people shoveling coal into steam boilers has decreased with the rise of diesel locomotives.  The number of people employed physically connecting phone calls with patch cords has fallen with the rise of automatic switching.  Technology and distribution systems change and morph over time. 

But I have to admit I appear to have been wrong -- the meme itself may not be true.  Via Mark Perry, who discusses this study in more depth.

Wm

Must Have Been Those Tax Cuts For the Rich

From Mark Perry  (a new favorite of mine)

Tax1

In related news, comes this from the WSJ via Evan Coyne Malloney

New data from the IRS will be out in a few weeks on who pays how much
in taxes. My contacts at the Treasury Department tell me that for the
first time in decades, and perhaps ever, the richest 1% of tax filers
will have paid more than 40% of the income tax burden. The top 50% will
account for 97% of all federal income taxes, while the bottom 50% will
have paid just 3%.

Here is the same data from 2005:

Tax

This is really a huge threat to the Republic and the minority protections built into the Constitution.  Our government was most explicitly not meant to be a tyranny of the majority, where 51%+ of the people can legally abuse the rest with impunity, but this tax picture sure seems to be stepping over this line.  A particularly worrisome subset of this problem is the increasing legislative predilection for funding  projects with millionaire's taxes, as discussed here and here.  I discussed more about the implications of 52.6% voting for the other 47.4% to support them here.

Your State's Gas Tax

I find that in discussing gasoline prices, a lot of people don't know what their state's gasoline tax is.  So, as a public service (hat tip to Mark Perry)

Gastax

Economic Impact of Gas Prices

Are gas prices high or low by historical standards?  That seems like a nutty question, with prices at the pump cracking $4.00 a gallon, but one can argue that in terms of household pain, gas prices are nowhere near their historical highs.

Economist Mark Perry, at his blog Carpe Diem, shows that gas prices are far from their highs as a percentage of household income:
Gas

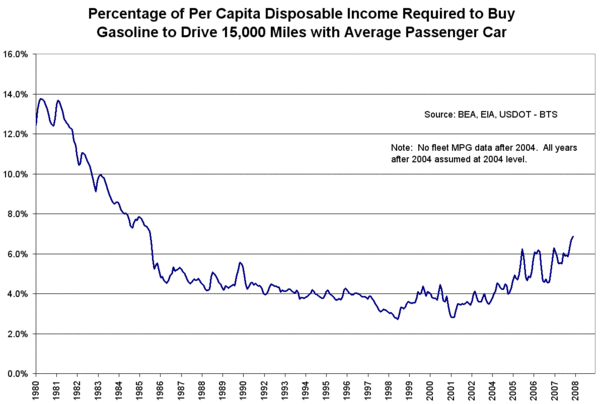
I thought the analysis could be taken one step further.  Mr. Perry was generous enough to send me his data, and I added a fourth piece of data to the analysis:  the average passenger vehicle MPG by year, as reported at the BTS here.  The MPG data set is spotty, and required some interpolation.  Also, data since 2004 is missing, so I assumed 2004 MPG's for more recent years (this is conservative, since the long-term trend would indicate fleet MPG's probably improved since 2004). 

From this data I was able to create what I think is a slightly improved analysis.  The key for households is not how much it costs to buy 1000 gallons, but how much it costs to buy the gas required to drive their typical annual miles.  Using 15,000 as an average driving miles per year per person, we get this result:

Gas_prices_2

So, while I too think paying $4 for gas is not my favorite way to dispose of my income, in terms of average household pain created, gas prices are quite far from their historic highs.

Those Dang Illegal Immigrants Taking All of Our Jobs

Via TJIC and Mark Perry come this excellent observation:

State unemployment rates for April were released last week by the
BLS, and there are now 18 states that have set historical record-low
jobless rates in the last year

Here are the 18 states with historical record-low jobless rates"¦

"¦California: 4.7% in November 2006
"¦Arizona: 3.9% in March 2007
"¦New Mexico: 3.5% in February 2007
"¦Texas: 4.2% in April 2007"¦

I wonder where our economy would be without those 15 million Mexican immigrants.  Negative unemployment?