Posts tagged ‘Climate Skepticism’

Chapter 1: Summary of the Skeptical Layman's Guide to Man-Made Global Warming

The table of contents for the rest of this paper, . 4A Layman's Guide to Anthropogenic Global Warming (AGW) is here Free pdf of this Climate Skepticism paper is here and print version is sold at cost here

We know the temperature of the Earth has increased over the
last half of the 19th century and most of the 20th
century as the world has exited a particularly cold period called the Little
Ice Age.  One of the odd coincidences that colors our judgment about
climate trends is that man began systematically measuring temperatures in the
early to mid-nineteenth century just as the world was beginning to exit what
was perhaps the coldest period of the last millennia.  Throughout their
study of climate trends, scientists have to try to parse warming that is a
natural result of exiting this cyclical cold period from warming that is
perhaps due to man's influence.

We know further, from laboratory work, that CO2, and more
importantly water vapor, in the atmosphere serves to keep the Earth warmer than
it would be in their absence.  What we don't know, in fact what we have no
empirical proof for, is if rising CO2 levels over the last century (caused in
part by man's combustion of fossil fuels) has caused some or all of the 20th
century warming.  The fact that we have no empirical evidence for this
man-made effect on climate doesn't mean it is not true, but it is something we
should not forget in all this debate.  What we have instead are historical
correlations in the data, far from perfect, that seem to show some relationship
over history between CO2 and temperature.  Some find this data to be
compelling evidence of cause and effect, and others do not. 

Before we start, since this paper is by definition somewhat
in opposition to the core of Anthropogenic Global Warming (AGW) theory, it
would be useful to state in simple terms just what that theory is.
  The strong AGW hypothesis is roughly as follows:

1. The
world has been warming for a century, and this warming is beyond any cyclical
variation we have seen over the last 1000 or more years, and beyond the range
of what we might expect from natural climate variations.

2. Almost
all of the warming in the second half of the 20th century, perhaps a
half a degree Celsius, is due to man-made greenhouse gasses, particularly CO2

3. In
the next 100 years, CO2 produced by man will cause a lot more warming, from as
low as three degrees C to as high as 8 or 10 degrees C.

4. Positive
feedbacks in the climate, like increased humidity, will act to triple the
warming from CO2, leading to these higher forecasts and perhaps even a tipping
point into climactic disaster

5. The
bad effects of warming greatly outweigh the positive effects, and we are
already seeing the front end of these bad effects today (polar bears dying,
glaciers melting, etc)

6. These
bad effects, or even a small risk of them, easily justify massive intervention
today in reducing economic activity and greenhouse gas production


In the rest of this paper, we will focus on potential weaknesses
in this hypothesis. Specifically, I will argue that:

There is no doubt that CO2 is a
greenhouse gas, and it is pretty clear that CO2 produced by man has an
incremental impact on warming the Earth's surface. 

However, recent
warming is the result of many natural and man-made factors, and it is
extraordinarily difficult to assign all the blame for current warming to
man. 

In turn, there are very good reasons to suspect that climate
modelers may be greatly exaggerating future warming due to man.  Poor
economic forecasting, faulty assumptions about past and current conditions, and
a belief that climate is driven by runaway positive feedback effects all
contribute to this exaggeration. 

As a result, warming due to man's
impacts over the next 100 years may well be closer to one degree C than the
forecasted six to eight.  In either case, since AGW supporters tend to grossly
underestimate the cost of CO2 abatement, particularly in lost wealth creation
in poorer nations, there are good arguments that a warmer but richer world,
where aggressive CO2 abatement is not pursued, may be the better end state than
a poor but cooler world.

In Chapter 2, we will address whether it is even appropriate
to be a skeptic
.  Of late, several AGW supporters have declared the
science "settled," and skeptics the equivalent of tobacco lawyers or holocaust
deniers.  We will also look at the issue of bias, not just for skeptics
but for AGW supporters as well.

In Chapter 3, we will cover a bit of background on
Anthropogenic Global Warming (AGW) theory
.  We  will learn some
things about the CO2 greenhouse effect you have probably never heard in the
media, such as the fact that warming from CO2 is actually a diminishing return
phenomenon whose effect is asymptotic or essentially capped, making it hard to
understand the prevalence of wild, open-ended temperature runaway scenarios.

In Chapter 4, we will review the historic empirical evidence
for AGW theory.  We will find that the science of historic climate
reconstruction is still in its infancy
, and a lot of uncertainty exists in the
data.  We will see that over the last several years, while correlations
between CO2 and temperature exist in the data, much of the historical
circumstantial evidence for AGW theory has gotten weaker, and we will cover
"global dimming" and see if this effect makes the case for AGW stronger.

In Chapter 5 we will cover the absolutely fascinating topic
of climate models.  Most of what you have seen in the media is the output
of complex climate models.  We will find that there is a lot less here
than meets the eye.

In Chapter 6 we will study several alternate explanations
for recent warming
that don't involve man-made greenhouse gasses.  Most
prominent in these theories is the changing output of the sun.

In Chapter 7 we take on the scare stories "“ the lions and
tigers and bears of climate reporting.  In the movie An Inconvenient
Truth
, Al Gore caught the world's attention with prophecies of seas rising
twenty feet, hurricanes and tornados running rampant, and species dying.
We will find that most of these claims are thought to be wild exaggerations
even by scientists who support AGW theory.

In Chapter 8 we finally get to the Kyoto Treaty, explain its
origins and shortcomings, and briefly discuss some policy alternatives.
We'll seriously consider whether a cooler but poorer world is really superior
to a warmer but richer world
.

Finally, in Chapter 9, we will consider AGW supporter's
rebuttals of some of these arguments
.  For this version, we will use the New
Scientist's
recent 26 Global Warming Myths as a platform for this
discussion.

My Goals
For This Paper

The purpose of this paper is to provide a layman's critique
of the Anthropogenic Global Warming (AGW) theory, and in particular to
challenge the fairly widespread notion that the science and projected
consequences of AGW currently justify massive spending and government
intervention into the world's economies.  This paper will show that
despite good evidence that global temperatures are rising and that CO2 can act
as a greenhouse gas and help to warm the Earth, we are a long way from
attributing all or much of current warming to man-made CO2.  We are even
further away from being able to accurately project man's impact on future
climate, and it is a very debatable question whether interventions today to
reduce CO2 emissions will substantially improve the world 50 or 100 years from
now.

I am not a trained expert on the climate.  I studied
physics at Princeton University before switching my major to mechanical
engineering, where I specialized in control theory and feedback loops, a topic
that will be important when we get into the details of climate change
modeling.  For over ten years, my business specialty was market prediction
and sales forecasting using modeling approaches similar to (if far less complex
than) those used in climate.

My goal for this paper is not to materially advance climate
science.  However, I have found that the global warming skeptic's case is
seldom reported well or in any depth, and I wanted to have a try at producing a
fair reporting of the skeptic's position.   I have been unhappy with
several of the recent documentaries outlining the skeptic's case, either
because they skipped over a number of critical issues, or because they
over-sold alternate warming hypotheses that are not yet well understood.
To the inevitable charge that as a non-practitioner, I am not qualified
to write this paper --I believe that I am able to present the current state of
the science, with a particular emphasis on the skeptic's case, at least as well
as a good reporter might, and far better than most reporters actually portray
the state of the science.  Through this paper I will try to cite sources
as often as possible and provide links for those who are reading this online,
this report is best read as journalism, not as a scientific, meticulously
footnoted paper.

Years ago, another man not trained in climate started a
PowerPoint presentation of what he knew about Global Warming.  Over time,
he used it both as a vehicle for communication as well as a living document
that would evolve over time to reflect his improving knowledge.  A lot of
people saw Al Gore's PowerPoint presentation, and it became the backbone for
the movie An Inconvenient Truth.  I hope to use this paper the same
way, as an evolving document to reflect my evolving knowledge.  To this
end, each version will get a software-like version number and date.

Before proceeding, I want to make one note on
nomenclature.  The terms global warming and climate change are often used
interchangeably, and generally are used in a way that imply man-made
causes.  For example, when many people speak of global warming, they are
actually talking about anthropogenic global warming, meaning warming of the
Earth from man-made causes, generally the release of greenhouse gasses
including CO2.  Of course the climate can, and does, change without man's
help and the Earth can warm without man-made gasses.  I will try to be
precise in my terminology.  I will use global warming to mean literally an
increase in Earth's surface temperatures, no matter what the cause.  I
will use anthropogenic global warming, or AGW, to mean the theory that man is
causing some or all of the current warming.

Finally, any abuse of copyrighted material or mistakes in
attribution are entirely unintentional.  Such problems, as well as any
comments, should be sent to the author at the email address on the cover.

The table of contents for the rest of this paper, . 4A Layman's Guide to Anthropogenic Global Warming (AGW) is here Free pdf of this Climate Skepticism paper is here and print version is sold at cost here

The open comment thread for this paper can be found here. 

Chapter 2: Is it OK to be a Skeptic? (Skeptics Guide to Global Warming)

The table of contents for the rest of this paper, . 4A Layman's Guide to Anthropogenic Global Warming (AGW) is here Free pdf of this Climate Skepticism paper is here and print version is sold at cost here

 For the first time since the Catholic Church
dominated western man's affairs, it has suddenly become a sin again to be
labeled a "skeptic."  For most of my lifetime, "skepticism" was considered
an essential element in the makeup of any good scientist (or journalist, for
that matter).   However, leading world figures are declaring
skepticism to be immoral.  Take one example, from this
UPI
story:

A former chief of the U.N. World
Health Organization who also is a former prime minister of Norway and a medical
doctor has declared an end to the climate-change debate.

Dr. Gro Harlem Brundtland, one of U.N.
Secretary-General Ban Ki-moon's three new special envoys on climate change, also headed up the 1987 U.N. World
Commission on Environment and Development where the concept of sustainable
development was first floated.

"This discussion is behind us. It's
over," she told reporters. "The diagnosis is clear, the science is
unequivocal -- it's completely immoral, even, to question now, on the basis of
what we know, the reports that are out, to question the issue and to question
whether we need to move forward at a much stronger pace as humankind to address
the issues."

In its most extreme form, this approach has AGW supporters
labeling skeptics as equivalent to "holocaust deniers" and "tobacco
lawyers."  Efforts have been made in several quarters to decertify
climatologists or meteorologists who show any skepticism for AGW theory, making
public adherence to the theory a minimum qualification for publication and
professional standing.  Enormous efforts are made to squelch skeptical
speech.  Just as one example, the BBC has run a zillion shows and specials
sympathetic to AGW.  When Channel 4 ran one single show (called the
"Global Warming Swindle") which outlined parts of the skeptics' position, 37 scientists attempted to have it
suppressed by the government
.

This is all the more incredible given that AGW theory has
only really been researched seriously and with any critical mass for about 20
years.  Anyone who has studied the history of science will understand what
incredible hubris it is to declare any new scientific theory, particularly one
that concerns the unbelievably chaotic climate, as "done" after just 20 years
work. 

Let me give two quick examples of just how unsettled the
science of climate change is.  Both of these will be reviewed in more
depth later in this paper, and both analyses figured prominently in the third
IPCC report (2001) as well as Al Gore's An Inconvenient Truth.  The
first is a 100,000 year temperature and CO2-level reconstruction from ice-core
data.  Anyone who saw Gore's movie will remember the data in one of his
Really Big Charts.  And it looks compelling "“ in fact, when I first saw
the chart five years ago, it was compelling to me.  It shows CO2 levels
and temperature moving in lock-step for 100,000 years.  When CO2 is up,
temperature is up and vice-versa, the clear implication being that CO2 seems to
be a key, maybe the key, driver of climate   However, since
that chart was first prepared, laboratory procedure has improved, and
scientists have found (and there is very little disagreement about this, even
among strong AGW supporters) that temperature increases occur on average 800
years before the CO2 starts to increase.  Huh.  There is a lot
of debate about what this means, but in the last five years, this formerly definitive
analysis is clearly no longer definitive, since it is hard to cause something
after the fact.

The other example is the very famous Mann hockey stick
chart, prominently featured in Gore's movie and a key part of the IPCC report
in 2001.  I will go into the details later, but since 2001 this analysis
has been effectively discredited, so much so it was almost entirely missing
from the fourth IPCC report in 2007.  In 2003 or so, Al Gore and many AGW
supporters would have called the Mann hockey stick chart the single most
important analysis "proving" AGW, and Gore treated it as such in his PowerPoint
deck and his movie.  Then, in 2007, it is repudiated and expunged from the
record.  Is this really what any reasonable person would call a "settled"
science?

It is a true perversion of the scientific process to find
that skepticism is no longer welcome or accepted in scientific debate.
Which is one reason that AGW is sometimes called a secular religion.
Because it is religion, not science, that burns skeptics at the stake.  Climate
Scientists Garth Paltridge wrote
:

A colleague of mine put it rather
well. The IPCC, he said, has developed a highly successful immune system. Its
climate scientists have become the equivalent of white blood cells which rush
in overwhelming numbers to repel infection by ideas and results which do not
support the basic thesis that global warming is perhaps the greatest of the
modern threats to mankind.

Charges of Bias

A funny thing has happened in climate science to scientific inquiry:
the usual ethics of free discussion and fact-based criticism have been
discarded in favor of ad hominem attacks on critics of AGW theory.
The usual approach is to find some connection (even an imagined one) between
any researcher who raises the smallest doubts about AGW theory and an oil or
power company and then declare that the research is tainted by the bias of
these companies that have a strong economic reliance on fossil fuel combustion
(and thus the production of CO2).  A good example can be found in a Boston
Globe article
on MIT's Alfred P. Sloan professor of meteorology Richard
Lindzen.  Mr. Lindzen has become the bete noir of AGW supporters,
since his skepticism is harder to dismiss given his scientific pedigree and his
co-lead author status on the first IPCC climate change report.

"We do not understand the natural internal
variability of climate change" is one of Lindzen's many heresies, along
with such zingers as `"the Arctic was as warm or warmer in 1940,"
"the evidence so far suggests that the Greenland ice sheet is actually
growing on average," and "Alpine glaciers have been retreating since
the early 19th century, and were advancing for several centuries before that.
Since about 1970, many of the glaciers have stopped retreating and some are now
advancing again. And, frankly, we don't know why."

When Lindzen published similar views in The Wall
Street Journal this spring, environmentalist Laurie David, the wife of comedian
Larry David, immediately branded him a "shill." She resurrected a
shopworn slur first directed against Lindzen by former Globe writer Ross
Gelbspan, who called Lindzen a "hood ornament" for the fossil fuels
industry in a 1995 article in Harper's Magazine....

For no apparent reason, the state of California,
Environmental Defense, and the Natural Resources Defense Council have dragged
Lindzen and about 15 other global- warming skeptics into a lawsuit over auto-
emissions standards. California et al. have asked the auto companies to cough
up any and all communications they have had with Lindzen and his colleagues,
whose research has been cited in court documents.

"We know that General Motors has been paying
for this fake science exactly as the tobacco companies did," says ED
attorney Jim Marston. If Marston has a scintilla of evidence that Lindzen has
been trafficking in fake science, he should present it to the MIT provost's
office. Otherwise, he should shut up.

"This is the criminalization of opposition to
global warming," says Lindzen, who adds he has never communicated with the
auto companies involved in the lawsuit.

While I have no doubt that corporations are heavily
influenced by their own economic interests, it is more of stretch to argue that
anyone who has ever taken money from them or had any connection with them would
purposely bias their research.  When I learned to debate, I was taught
that understanding biases was useful in knowing when to apply more or less
skepticism, but one still has to refute the opposing position by meaningful
critique of procedures or data.   For example, one might say "given
their strong desire to buttress the case for AGW, the researchers cherry-picked
only the most extreme data, which I will demonstrate by showing the data they
included and the data they chose to exclude."  However, many modern AGW
supporters believe that insinuating possible sources of bias is sufficient to
exempt one from having to actually critique their opponents' methods and
findings. 

This is particularly odd given that public funding for AGW
projects absolutely dwarfs any funding coming from private sources whose
incentive might be to disprove AGW.  In fact, just this year, President
Bush declared that the US Government alone spent more money on AGW research
than on AIDS research, and the US is actually late in the climate funding
game. 

Recently, Greenpeace criticized ExxonMobil for exercising
its free speech rights and giving
about $2 million to global warming skeptics

Still, the Greenpeace report is already receiving
scrutiny in Washington, where Rep. Brad Miller, a North Carolina Democrat, has
joined the environmentalist group in calling for Exxon to release its plans for
contributions during the current year.

"The support of climate skeptics, many of whom
have no real grounding in climate science, appears to be an effort to distort
public discussion about global warming," Miller said. "So long as
popular discussion could be about whether warming was occurring or not, so long
as doubt was widespread, consensus for action could be postponed."

Incredibly, at these spending rates, skeptics are getting outspent by AGW
supporters something like 1000:1 or more.  It is astounding that AGW
supporters, with such a huge funding and publication advantage, still feel
threatened by critics.

Climate research, once a sleepy academic backwater, is now a
multi-billion dollar industry.  This boom in spending is because of fears
of AGW, and should AGW theory be discredited, this funding will quickly dry
up.  So funding for climate researchers exists only as long as climate
researchers beat the drum that AGW is a large threat.   It strikes me
that this is at least as large an incentive for bias as that of any
Exxon-funded skeptic.   Here's another way to look at it:  If
AGW theory is proven correct, the likely political response might cut Shell's
revenues by 20-30%, at most.  If AGW theory is proven incorrect, then
university climate research funding might be cut by 100%.
  Directionally, all the incentives in academia are to inflate global
warming projections.  No one is going to make the news, or even continue
to get funding, if they argue that warming will only be a degree or two in the
next century.  The guys that get the fame and the grants are those pushing
the numbers higher and higher.

Certainly AGW supporters claim that academic researchers are
only concerned about the science and are not concerned about the funding
incentives.  This may be true (though a bit naïve, for anyone who has been
in a university environment and sought research funding), but if pro-AGW
researchers are not swayed by the funding, then it should be equally true that
AGW skeptics are not swayed by much smaller amounts of money flowing to
them.    Any argument that tries to claim that these situations
are somehow different just ends up being circular, i.e. "it's OK if our guys do
it because our guys are right."

One of the mistakes the IPCC process has systematically made
is to make the lead author's and reviewers of many of its report sections a
scientist whose research is mostly in that area.  While this makes a
certain sense, as these people will be expert in their particular area of
review, it presents them with a huge conflict of interest.  For example,
Michael Mann used his own historical temperature reconstructions as the lead
analysis in the section of the third IPCC report for which he was lead
author.  Clearly, one wouldn't expect him to be (nor was he) open to any
research or issues or criticisms aimed at his own work.  In the fourth
report, the new lead author who replaced Mann on this section (Biffra) did the
exact same thing Mann did "“ used his own work as centerpiece of the section,
and has refused to even consider criticisms about that work. 

Just to avoid future argument, I
will outline my potential biases.  I own a small recreation business which
depends on people traveling to beautiful, natural settings.  I lose
business when the climate changes (e.g. when lakes dry up next to my
facilities, which has happened to me).  I generally gain business when gas
prices increase, as they might under various anti-global warming mandates,
since my facilities tend to be short-drive weekend destinations rather than cross-country
destinations.  I grew up in Houston, Texas, so most of my family has
worked in the oil industry at one time or another, and I worked for the Great
Satan Exxon as my first job for three years out of college.  I am a
libertarian blogger at CoyoteBlog.com, and am suspicious of government
interventions but have historically supported emissions limits where they make
sense.  No one has contributed any money to me for this paper or for the
operation of my blog.

The Climate Trojan
Horse

To fully understand the passionate, almost dogmatic
dedication so many people have to AGW theory, it is a bit useful to look at a
little history.  After the fall of the Soviet Union in 1989, there were a
lot of Marxists, socialists, anti-corporatists and anti-capitalists who were
looking for a new way to package and reinvent themselves, given that the vast
majority of people (at least in the West) considered socialism failed and no
longer wanted to hear about it any more.  For a while, many of these folks
latched onto the anti-globalization cause.  Every interview I ever saw of
one of these anti-globalization guys was a real mess of disorganized beliefs,
but one could tell the movement was the new home for anyone who wanted to stop
the spread of capitalism and privately-owned business. 

Then, along came anthropogenic global warming.  Here
was a theory and movement that united many disparate interests:

  • Socialists, communists, and Marxists
  • Anti-capitalists
  • Anti-consumerists
  • Those opposed to large corporations
  • Those opposed to global free trade
  • Those opposed to economic development and growth, longing
         for simplicity
  • "Buy local" movements
  • People who just hate oil companies

Suddenly, here was a big tent for all of these causes.
I highly encourage you to view a global warming rally.  Don't just watch
the snippets on the evening news, those usually highlight the most reasonable
speakers at the rally.  Actually go and watch the whole event.  What
you will see is far more anti-corporate, anti-oil company, anti-capitalist
rhetoric than you will hear climate science and discussion.  The two
rallies I have seen with my own eyes were Marxist rallies under a climate
banner.  As an admittedly extreme example, I will refer you to the words of
Paul
Watson, Founder and President of Sea Shepherd Conservation Society
, who
offers his group's vision.  While this particular vision pre-dated most
discussions of AGW, I hope you can see how AGW fear-mongering provides quite a
useful vehicle for groups of this type:

"We need to radically and
intelligently reduce human populations to fewer than one billion.... We need to
stop burning fossil fuels and utilize only wind, water, and solar power with
all generation of power coming from individual or small community units like
windmills, waterwheels, and solar panels. Sea transportation should be by
sail.... Air transportation should be by solar powered blimps when air
transportation is necessary. All consumption should be local. No food products
need to be transported over hundreds of miles to market. All commercial fishing
should be abolished. If local communities need to fish the fish should be
caught individually by hand. Preferably vegan and vegetarian diets can be
adopted.... We need to remove and destroy all fences and barriers that bar
wildlife from moving freely across the land.... We need to stop flying, stop
driving cars, and jetting around on marine recreational vehicles.... Who should
have children? Those who are responsible and completely dedicated to the
responsibility which is actually a very small percentage of humans...."

Of course what he doesn't say, but is an explicit outcome of
this vision, is that we can all go back to being dirt poor and having a life
expectancy of about 40 years.

The average person, say in America, wants little to do with
any of this.  But fear of AGW provides a way to engage everyone in the
movement.  Socialists of all stripes no longer have to spew Marxist
notions that turn most people off; now, they can talk the science of global
warming and hurricanes and massive floods and such, and, using fear, trample
the average guy into their socialist goals of stifling capitalism, growth, and
having the government take over the economy through this environmental
back-door.

The Need to
Exaggerate

One of the hardest parts of really trying to understand what is going on in
the AGW scientific debate is separating the scientists doing real science from
the political advocates, who sometimes carry quasi-scientific titles.  A
very, very small number of vocal climate scientists and a somewhat larger group
of what I would call advocates and bureaucrats really determine what you hear
in the media about AGW science.   A great example is the UN IPCC
reports.  Unless you have gone online and dug into the detailed reports
themselves, likely all you have seen from these reports is taken out of the
management summaries "for policy-makers".  These summaries are written by
bureaucrats and advocates, not so much by scientists, and tend to wildly
mis-characterize the true state of the science.   Careful language in
the heart of the reports expressing uncertainty and low understanding of
certain phenomena are cast aside in the summaries, in favor of a comforting
certainty and absolutes.  In earlier IPCC reports, this caused notable
disconnects between the summaries and the detailed science.  More
recently, the UN has "fixed" this problem by having their non-scientists write the
conclusions in the management summaries first, and then telling authors of the
individual sections of the report to conform their writing, and their science,
to the summary.  So, for the Fourth IPCC report, the summary was published
over a half year before the science!

As a result, while the IPCC reports claim to be the consensus of 5000
scientists, actually less than half would willingly sign their name to the
management summaries of their work that you see in the press.  The
management summaries and related press releases have become more political
advocacy than science, as UN bureaucrats use AGW-fear-mongering to increase
their prestige and power.  Generally, these summaries and press releases
are taken more seriously by the press than they are climate scientists.
You can get an insight on the IPCC process just by looking at how they select
their co-lead authors on certain sections.  A logical way to choose these
authors would be to find scientists who bring a different scientific perspective
"“ maybe a leading astronomer who studies the sun, maybe someone who studies
hurricanes, or perhaps even, gasp, a skeptic or two.  This is not how the
IPCC makes the selection.  Instead, they focus on including scientists,
often with limited experience or expertise, who bring geographic or ethnic
diversity to the panel.  Nothing better demonstrates that the IPCC is
first and foremost a political entity, and a scientific body second (at best).

If I seem too hard on the climate science community, then consider this quote
from National Center for Atmospheric Research (NOAA) climate researcher and
global warming action promoter, Steven Schneider:

We have to
offer up scary scenarios, make simplified, dramatic statements, and make little
mention of any doubts we have. Each of us has to decide what the right balance
is between being effective and being honest.

Is that how you learned science in high school "“ that lying
about the science was OK if it makes you more politically effective?  Der
Spiegel
, a magazine historically sympathetic to the AGW cause, published
this analysis:

This doesn't mean that Gore should necessarily be
taken to task for his statements. He is a politician. But it is odd to hear
IPCC Chairman Pachauri, when asked what he thinks about Gore's film,
responding: "I liked it. It does emotionalize the debate, but it seems
that it has to do that." And when Pachauri comments on the publication of
the first SPM by saying, "I hope that this will shock the governments so
much that they take action," this doesn't exactly allay doubts as to his
objectivity. When Renate Christ, the secretary of the IPCC, is asked about her
opinion of reporting on climate change, she refers to articles that mention
"climate catastrophe" and calls them "rather refreshing." .
. .

The problem is that the IPCC is not a political
group whose goal is to exert pressure, but a scientific institution and panel
of experts. Its members ought to present their results and analyses
dispassionately, the way pathologists or psychiatrists do when serving as
expert witnesses in court, no matter how horrible the victim's injuries and how
deviant the perpetrator's psyche are.

I will end this section on an admittedly extreme example
of a headline taken from the Canadian, a "progressive" magazine up in
the Great White North.  In the great race to one-up other media outlets in
creating a panic, and not happy with just a few more hurricanes or some melted
icebergs, the Canadian has taken the prize.  Get ready for it"¦

"Over 4.5 Billion people could die
from Global Warming-related causes by 2012"

In case you are struggling with the math, that means that they believe
Global Warming could kill three quarters of the world's population in the next
five years.  And the media treats these people with total respect, and we
skeptics are considered loony?

The table of contents for the rest of this paper, . 4A Layman's Guide to Anthropogenic Global Warming (AGW) is here Free pdf of this Climate Skepticism paper is here and print version is sold at cost here

The open comment thread for this paper can be found here. 

Chapter 3: The Basics of Anthropogenic Global Warming Theory (Skeptics Guide to Global Warming)

The table of contents for the rest of this paper, . 4A Layman's Guide to Anthropogenic Global Warming (AGW) is here Free pdf of this Climate Skepticism paper is here and print version is sold at cost here

I will not even try do full justice here to the basic theory
of AGW theory.  I highly encourage you to check out RealClimate.org.  This is probably
the premier site of strong AGW believers and I really would hate to see AGW
skeptics become like 9/11 conspiracists, spending their time only on
like-minded sites in some weird echo chamber. 

If you are reading this, you probably know that CO2 is what
is called a greenhouse gas.  This means that it can temporarily absorb
radiation from the Earth, slowing its return to space and thereby heating the
troposphere (the lower 10KM of the atmosphere) which in turn can heat up the
Earth's surface.  You probably also know that CO2 is not the only
greenhouse gas, and that water vapor, for example, is actually a much stronger
and more prevalent greenhouse gas.   

It is important to understand that the greenhouse gas effect
is well-understood in the laboratory.  No one really disagrees that, all
other effects held constant in a laboratory, CO2 will absorb certain
wavelengths of reflected sunlight.   What may or may not be
well-understood, depending on your point of view, is how this translates to the
actual conditions in our chaotic climate.  Does this effect dominate all
other climate effects, or is it trivial compared to other forces at work?
Does this greenhouse effect lead to runaway, accelerating change, or are there
opposing forces that tend to bring the climate back in balance?  These are
hugely complex questions, and scientists are a long way from answering them
empirically.

But wait, that can't be right -- scientists seem so
sure!  Well, some scientists, particularly those close to microphones,
seem sure.  Their proof usually follows one or both of these paths:

  1. Some scientists argue that they believe they have
         accounted for all the potential natural causes, or "forcings," in the
         climate that might cause the warming we have observed over the last century,
         and they believe these natural forcings are not enough to explain recent
         temperature increases, so therefore the changes must be due to man.
         This seems logical, until I restate their logic this way:  "the
         warming must be due to man because we can't think of anything else it
         could be." 
  2. Scientists have created complicated models to predict
         future climate behavior.  They argue that their models show man-made
         CO2 causing most 20th century warming.  Again this sounds good,
         until one understands that when these models were first run, they were
         terrible at explaining history.  Since these first runs, scientists
         have tweaked the models until they match historical data better.  So,
         in effect, they are saying that manmade CO2 is the cause of historical
         warming because the models they tweaked to match history"¦ are very good at
         matching history; and because the models they programmed with CO2 as the
         major driver of climate show that"¦CO2 is the major driver of
         climate.  We will see a lot of such circular analysis in later
         chapters.

The best evidence we could expect to find (lacking a second
identical Earth we can use as a control in an experiment) is to find a historic
correlation between temperature and CO2 that is stronger than the correlation
between temperature and anything else (and of course, even this would not imply
causation).  There is a lot of argument whether we have that or not, a
topic I will cover in the next chapter.  Of course, the lack of unequivocal
evidence at this point does not make the AGW theory wrong, just still"¦
theoretical.   

Before we get to the historical evidence, though, there may
be a few other facts about CO2 and warming that you don't know:

  • CO2 is a really, really small part of the atmosphere.
         Currently CO2 makes up about 0.0378% of the atmosphere, up from an
         estimated 0.0280% before the industrial revolution.  (Just to give an
         idea of scale, if you were flying from Los Angeles to New York City,
         traveling 0.0378% of the distance would not even get you off the runway at
         LAX.  AGW advocates are arguing that a CO2 concentration increase of
         0.009% has heated the world over a half a degree C.
  • The maximum warming should, by greenhouse gas theories,
         occur in the troposphere (the first 10km or so of atmosphere).
         Global warming theory strongly predicts that the warming in the
         troposphere should be higher than warming at the ground.  We will see
         later that the opposite is actually occurring.
  • The radiated energy returning to space consists of a wide
         spectrum of wavelengths.  Only a few of these wavelengths are
         absorbed by CO2.  Once these few wavelengths are fully absorbed,
         additional CO2 in the atmosphere has no effect whatsoever.  Also,
         these absorbed frequencies overlap with the absorption of other gasses,
         like water, which further lessens the incremental effect of extra CO2.

What does this mean?  In
effect, the warming effect of CO2 is a diminishing return relationship.
The first increase of, say, 100 parts per million (ppm) in the atmosphere has a
greater effect than the next 100 ppm, and so on until increased CO2 has
essentially no effect at all. 

I once bought a house that had
fuchsia walls in the kitchen and family room (really).  I spent all night
painting the rooms with a coat of white paint, and when I was done, I found
that some of the  fuchsia still showed through the white paint, making it
kind of light pink.  A second coat of white made the wall nearly perfectly
white.  The effects of CO2 in the atmosphere are similar, with the first
"coat" making for the most warming and later "coats" having much less effect
but still adding a bit.  At some point, the wall is white and more coats
have no effect. 

This relationship of CO2 to warming
is usually called sensitivity, and is often expressed as the number of degrees
of global warming that would result from a doubling in global temperature.

There are lots of values floating
around out there for sensitivity, but a preponderance (I won't say consensus)
seem to center on an increase of one degree C for a doubling of CO2 levels from
the pre-industrial figure of about 280ppm.  Note that you will see numbers
much higher than this, but these generally include feedback loops, which we
will get to later.  Without feedbacks, 0.5 to maybe 1.5 degrees seems like
a fairly well accepted number for sensitivity, though there are people on both
side of this range.

Luboš
Motl
provides a handy approximation of the diminishing return effect from
CO2 concentration on temperature.  I have taken his approximation and
graphed it below.


This is a very crude approximation,
but the shape of the curve is generally correct (if you exclude feedbacks,
which we will discuss in MUCH more depth later).   Other more
sophisticated approximations generally show the initial curve less steep, and
the asymptote less pronounced.  Never-the-less, it is generally accepted
by most all climate scientists that, in the absence of feedbacks, future
increases in atmospheric CO2 will have less effect on world temperature than
past increases, and that there is a cap (in this chart around 1.5 degrees C) on
the total potential warming.

Note that this is much smaller than
you will see in print.  The key is in "feedbacks" or secondary effects
that accelerate or slow warming.  We will discuss these in more depth
later, but typically AGW supporters believe these will triple the sensitivity
numbers, so a non-feedback sensitivity of one degree would be tripled to three
degrees.  Remember, though, these three points:

· Warming from CO2 is a diminishing return, such that future CO2 increases
has less effect than past CO2 increases

· In the absence of feedback, a doubling of CO2 might increase
temperatures one degree C

· In the absence of feedback, the total temperature increase from future
CO2 increases is capped, maybe as low as 1-1.5 degrees C.

The table of contents for the rest of this paper, . 4A Layman's Guide to Anthropogenic Global Warming (AGW) is here Free pdf of this Climate Skepticism paper is here and print version is sold at cost here

The open comment thread for this paper can be found here. 

Chapter 4: The Historical Evidence for Man-made Global Warming (Skeptics Guide to Global Warming)

The table of contents for the rest of this paper, . 4A Layman's Guide to Anthropogenic Global Warming (AGW) is here Free pdf of this Climate Skepticism paper is here and print version is sold at cost here

I mentioned earlier that there is little or no empirical
evidence directly linking increasing CO2 to the current temperature changes in the
Earth (at least outside of the lab), and even less, if that is possible, linking man's contribution to CO2
levels to global warming.  It is important to note that this lack of
empirical data is not at all fatal to the theory.  For example, there is a
thriving portion of the physics community developing string theory in great
detail, without any empirical evidence whatsoever that it is a correct
representation of reality. Of course, it is a bit difficult to call a theory
with no empirical proof "settled" and, again using the example of string
theory, no one in the physics community would seriously call string theory a
settled debate, despite the fact it has been raging at least twice as long as
the AGW debate.

One problem is that AGW is a fairly difficult proposition to
test.  For example, we don't have two Earths such that we could use one as
the control and one as the experiment.  Beyond laboratory tests, which
have only limited usefulness in explaining the enormously complex global
climate, most of the attempts to develop empirical evidence have involved
trying to develop and correlate historical CO2 and temperature records.
If such records could be developed, then temperatures could be tested against
CO2 and other potential drivers to find correlations.  While there is
always a danger of finding false causation in correlations, a strong historical
temperature-CO2 correlation would certainly increase our confidence in AGW
theory. 

Five to seven years ago, climate scientists thought they had
found two such smoking guns:  one in ice core data going back 650,000
years, and one in Mann's hockey stick using temperature proxy data going back
1,000 years.  In the last several years, substantial issues have arisen
with both of these analyses, though this did not stop Al Gore from using both
in his 2006 film.

Remember what we said early on.  The basic "proof" of
anthropogenic global warming theory outside the laboratory is that CO2 rises
have at least a loose correlation with warming, and that scientists "can't
think of anything else" that might be causing warming other than CO2.

The long view
(650,000 years)

When I first saw it years ago, I thought one of the more compelling charts
from Al Gore's PowerPoint deck, which was made into the movie An Inconvenient
Truth
, was the six-hundred thousand year close relationship between
atmospheric CO2 levels and global temperature, as discovered in ice core
analysis.  Here is Al Gore with one of those great Really Big Charts.

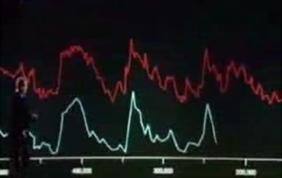
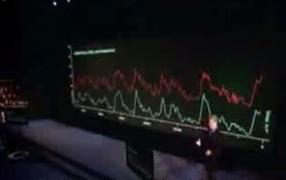
If you are connected to the internet, you can watch this segment of Gore's
movie at YouTube
.   I will confess that this segment is
incredibly powerful -- I mean, what kind of Luddite could argue with this
Really Big Chart?

Because it is hard to read in the movie, here is the data set that Mr. Gore
is drawing from, taken from page 24 of the recent fourth IPCC report.

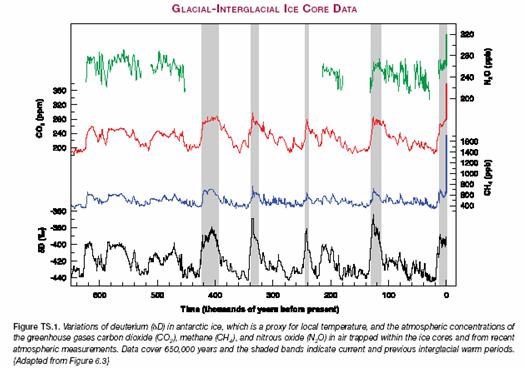
Unfortunately, things are a bit more complicated than presented by Mr. Gore
and the IPCC.  In fact, Gore is really, really careful how he narrates
this piece.  That is because, by the time this movie was made, scientists
had been able to study the ice core data a bit more carefully.  When they
first measured the data, their time resolution was pretty course, so the two
lines looked to move together.  However, with better laboratory procedure,
the ice core analysts began to find something funny.  It turns out that
for any time they looked at in the ice core record, temperatures actually
increased on average 800 years before CO2 started to increase.
When event B occurs after event A, it is really hard to argue that B caused A.

So what is really going on?  Well, it turns out that most of the
world's CO2 is actually not in the atmosphere, it is dissolved in the
oceans.  When global temperatures increase, the oceans give up some of
their CO2, outgassing it into the atmosphere and increasing atmospheric
concentrations.  Most climate scientists today (including AGW supporters)
agree that some external force (the sun, changes in the Earth's tilt and
rotation, etc) caused an initial temperature increase at the beginning of the
temperature spikes above, which was then followed by an increase in atmospheric
CO2 as the oceans heat up.

What scientists don't agree on is what happens next.
Skeptics tend to argue that whatever caused the initial temperature
increase drives the whole cycle.  So, for example, if the sun caused the
initial temperature increase, it also drove the rest of the increase in that
cycle.  Strong AGW supporters on the other hand argue that while the sun
may have caused the initial temperature spike and outgassing of CO2 from the
oceans, further temperature increases were caused by the increases in CO2.

The AGW supporters may or may not be right about this two-step
approach.   However, as you can see, the 800-year lag substantially
undercuts the ice core data as empirical proof that CO2 is the main driver of
global temperatures, and completely disproves the hypothesis that CO2 is the
only key driver of global temperatures.  We will return to this 800-year
lag and these two competing explanations later when we discuss feedback loops.

The medium view
(1000 years)

Until about 2000, the dominant reconstruction of the last
1000 years of global temperatures was similar to that shown in this chart from
the 1990 IPCC report:

1000yearold

There are two particularly noticeable features on this
chart.  The first is what is called the "Medieval Warm Period", peaking in
the 13th century, and thought (at least 10 years ago) to be warmer
than our climate today.  The second is the "Little Ice Age" which ended at
about the beginning of the industrial revolution.  Climate scientists
built this reconstruction with a series of "proxies", including tree rings and
ice core samples, which (they hope) exhibit properties that are strongly
correlated with historical temperatures.

However, unlike the 650,000 year construction, scientists
have another confirmatory source for this period: written history.
Historical records (at least in Europe) clearly show that the Middle Ages was
unusually warm, with long growing seasons and generally rich harvests (someone
apparently forgot to tell Medieval farmers that they should have smaller crops
in warmer weather).  In Greenland, we know that Viking farmers settled in
what was a much warmer period in Greenland than we have today (thus the oddly
inappropriate name for the island) and were eventually driven out by falling
temperatures.  There are even clearer historical records for the Little
Ice Age, including accounts of the Thames in London and the canals in Amsterdam
freezing on an annual basis, something that happened seldom before or since.

Of course, these historical records are imperfect.  For
example, our written history for this period only covers a small percentage of
the world's land mass, and land only covers a small percentage of the world's
surface.  Proxies, however have similar problems.  For example, tree
rings only can come from a few trees that cover only a small part of the
Earth's surface.  After all, it is not every day you bump into a tree that
is a thousand years old (and that anyone will let you cut down to look at the
rings).  In addition, tree ring growth can be covariant with more than
just temperature (e.g. precipitation);  in fact, as we continue to study
tree rings, we actually find tree ring growth diverging from values we might
expect given current temperatures (more on this in a bit).

Strong AGW supporters found the 1990 IPCC temperature
reconstruction shown above awkward for their cause.  First, it seemed to
indicate that current higher temperatures were not unprecedented, and even
coincided with times of relative prosperity.  Further, it seems to show
that global temperatures fluctuate widely and frequently, thus begging the
question whether current warming is just a natural variation, an expected
increase emerging from the Little Ice Age.

So along comes strong AGW proponent (and RealClimate.org
founder) Michael Mann of the University of Massachusetts.  Mann
electrified the climate world, and really the world as a whole, with his revised
temperature reconstruction, shown below, and called "the Hockey Stick."

1000yearold

Gone was the Little Ice Age.  Gone was the Medieval
Warm Period.  His new reconstruction shows a remarkably stable, slightly
downward trending temperature record that leaps upward in 1900.  Looking
at this chart, who could but doubt that our current global climate experience
was something unusual and unprecedented.  It is easy to look at this chart
and say "“ wow, that must be man-made!

In fact, the hockey stick chart was used by AGW supporters
in just this way.  Surely, after a period of stable temperatures, the 20th
century jump is an anomaly that seems to point its finger at man (though if one
stops the chart at 1950, before the period of AGW, the chart, interestingly, is
still a hockey stick, though with only natural causes).

Based on this analysis, Mann famously declared that the 1990's were the
warmest decade in a millennia and that "there is a 95 to 99% certainty
that 1998 was the hottest year in the last one thousand years." (By
the way, Mann now denies he ever made this claim, though you can watch him say
these exact words in the CBC documentary Global
Warming:  Doomsday Called Off
).
   If this is not hubris
enough, the USAToday
published a graphic
, based on Mann's analysis and which is still online as
of this writing, which purports to show the world's temperature within .0001
degree for every year going back two thousand years!

To reconcile historical written records with this new view of climate
history, AGW supporters argue that the Medieval Warm Period (MWP) was limited
only to Europe and the North Atlantic (e.g. Greenland) and in fact the rest of
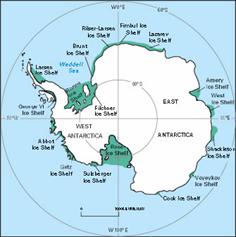
the world may not have been warmer. Ice core analyses have in fact verified a MWP
in Greenland, but show no MWP in Antarctica (though, as I will show later,
Antarctica is not warming yet in the current warm period, so perhaps Antarctic
ice samples are not such good evidence of global warming).  AGW
supporters, then, argue that our prior belief in a MWP was based on written
records that are by necessity geographically narrowly focused.  Of course,
climate proxy records are not necessarily much better.  For example, from
the fourth IPCC report, page 55, here are the locations of proxies used to
reconstruct temperatures in AD1000:

As seems to be usual in these reconstructions, there were a lot of arguments
among scientists about the proxies Mann used, and, just as important, chose not
to use.  I won't get into all that except to say that many other climate archaeologists did not and do not agree with his choice of proxies and still
support the existence of a Little Ice Age and a Medieval Warm Period.
There also may be systematic errors in the use of these proxies which I will
get to in a minute. 

But some of Mann's worst
failings were in the realm of statistical methodology.  Even as a layman,
I was immediately able to see a problem with the hockey stick:  it shows a
severe discontinuity or inflection point at the exact same point that
the data source switches between two different data sets (i.e.  from
proxies to direct measurement).  This is quite problematic.
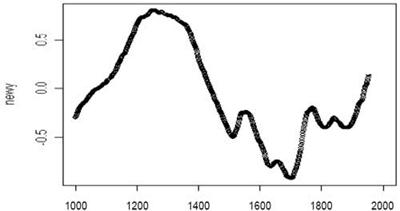
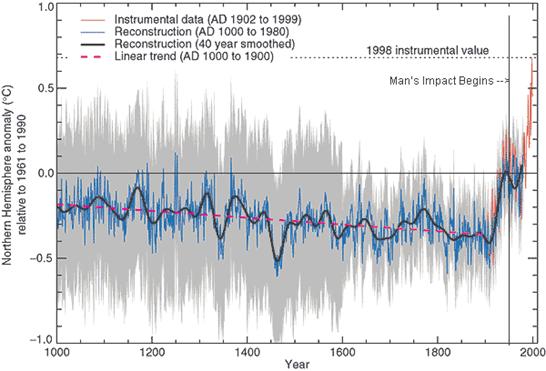
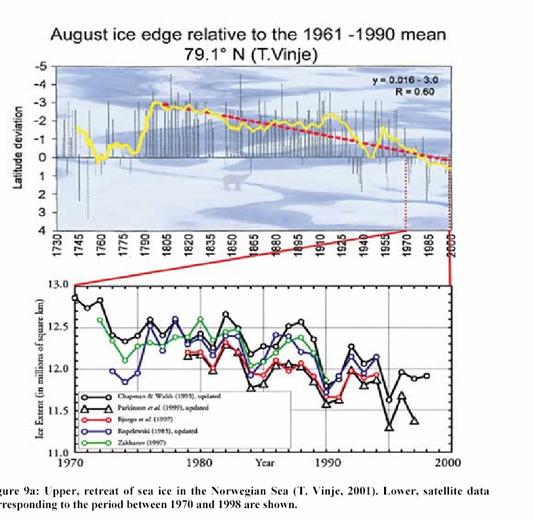
  Syun-Ichi Akasofu makes the observation that when you don't try to
splice these two data sets together, and just look at one (in this case,
proxies from Arctic ice core data as well as actual Arctic temperature
measurements) the result is that the 20th century warming in fact
appears to be part of a 250 year linear trend, a natural recovery from the
little ice age  (the scaling for the ice core data at top is a chemical
composition variable thought to be proportional to temperature).

However, the real bombshell was dropped on Mann's work by a couple of
Canadian scientists named Stephen McIntyre and Ross McKitrick (M&M).
M&M had to fight an uphill battle, because Mann resisted their third party
review of his analysis at every turn, and tried to deny them access to his data
and methodology, an absolutely unconscionable violation of the principles of
science (particularly publicly funded science).  M&M got very good at
filing Freedom of Information Act Requests (or the Canadian equivalent)

Eventually, M&M found massive flaws with Mann's statistical approach,
flaws that have since been confirmed by many experts, such that there are few
people today that treat Mann's analysis seriously (At best, his supporters
defend his work with a mantra roughly akin to "fake but accurate."  I'll
quote the MIT
Technology Review
for M&M's key finding:

But now a shock: Canadian scientists Stephen
McIntyre and Ross McKitrick have uncovered a fundamental mathematical flaw in
the computer program that was used to produce the hockey stick. "¦

[Mann's] improper normalization procedure tends to
emphasize any data that do have the hockey stick shape, and to suppress all
data that do not. To demonstrate this effect, McIntyre and McKitrick created
some meaningless test data that had, on average, no trends. This method of
generating random data is called Monte Carlo analysis, after the famous casino,
and it is widely used in statistical analysis to test procedures. When
McIntyre and McKitrick fed these random data into the Mann procedure, out
popped a hockey stick shape!

.  Recently, a US Congressional Committee asked a group of
independent statisticians led by Dr. Edward Wegman, Chair of the National
Science Foundation's Statistical Sciences Committee, to evaluate the Mann
methodology.  Wegman et. al. savaged the Mann methodology as well as the
peer review process within the climate community.  From their findings:

It is important to note the isolation of the
paleoclimate community; even though they rely heavily on statistical methods
they do not seem to be interacting with the statistical community.
Additionally, we judge that the sharing of research materials, data and results
was haphazardly and grudgingly done. In this case we judge that there was too
much reliance on peer review, which was not necessarily independent. Moreover,
the work has been sufficiently politicized that this community can hardly
reassess their public positions without losing credibility. Overall, our committee
believes that Dr. Mann's assessments that the decade of the 1990s was the
hottest decade of the millennium and that 1998 was the hottest year of the
millennium cannot be supported by his analysis.

In 2007, the IPCC released its new climate report, and the
hockey stick, which was the centerpiece bombshell of the 2001 report, and which
was the "consensus" reconstruction of this "settled" science, can hardly be
found.  There is nothing wrong with errors in science; in fact, science is
sometimes advanced the most when mistakes are realized.  What is worrying
is the unwillingness by the IPCC to acknowledge a mistake was made, and to try
to learn from that mistake.  Certainly the issues raised with the hockey
stick are not mentioned in the most recent IPCC report, and an opportunity to
be a bit introspective on methodology is missed.  M&M, who were ripped
to shreds by the global warming community for daring to question the hockey
stick, are never explicitly vindicated in the report.  The climate
community slunk away rather than acknowledging error.

In response to the problems with the Mann analysis, the IPCC
has worked to rebuild confidence in its original conclusion (i.e. that recent
years are the hottest in a millennium) using the same approach it often
does:  When one line on the graph does not work, use twelve: 

As you can see, most of these newer analyses actually outdo
Mann by showing current warming to be even more pronounced than in the past
(Mann is the green line near the top).  This is not an unusual phenomenon
in global warming, as new teams try to outdo each other (for fame and funding)
in the AGW sales sweepstakes.  Just as you can tell the newest climate
models by which ones forecast the most warming, one can find the most recent
historical reconstructions by which ones show the coldest past. 

Where to start?  Well, first, we have the same problem
here that we have in Mann:  Recent data from an entirely different data
set (the black line) has been grafted onto the end of proxy data.  Always
be suspicious of inflection points in graphs that occur exactly where the data
source has changed.  Without the black line from an entirely different data set grafted on, the data would not form a hockey stick, or show anything particularly anomalous about the 20th century.  Notice also a little trick, by the way "“ observe how
far the "direct measurement" line has been extended.  Compare this to the
actual temperatures in the charts above.  The authors have taken the
liberty to extend the line at least 0.2 degrees past where it actually should
be to make the chart look more dramatic.

There are, however, some skeptics conclusions that can be
teased out of this data, and which the IPCC completely ignores.  For
example, as more recent studies have deepened the little ice age around
1600-1700, the concurrent temperature recovery is steeper (e.g. Hegerl 2007 and
Moberg 2005) such that without the graft of the black line, these proxies make
the 20th century look like part of the fairly linear temperature
increase since 1700 or at least 1800.

But wait, without that black line grafted on, it looks like the
proxies actually level off in the 20th century!  In fact, from
the proxy data alone, it looks like the 20th century is nearly
flat.  In fact, this effect would have been even more dramatic if lead
author Briffa hadn't taken extraordinary liberties with the data in his
study.   Briffa (who replaced Mann as the lead author on this section
for the Fourth Report) in 2001 initially showed proxy-based temperatures falling
in the last half of the 20th century until he dropped out a bunch of
data points by truncating the line around 1950.  Steve McIntyre has
reconstructed the original Briffa analysis below without the truncation (pink
line is measured temperatures, green line is Briffa's proxy data).  Oops.


Note that this ability to just drop out data that does not
fit is NOT a luxury studies have in the era before the temperature record
existed.  By the way, if you are wondering if I am being fair to Briffa,
here is his explanation
for why he truncated
:

In the absence of a substantiated
explanation for the decline, we make the assumption that it is likely to be a
response to some kind of recent anthropogenic forcing. On the basis of this
assumption, the pre-twentieth century part of the reconstructions can be
considered to be free from similar events and thus accurately represent past
temperature variability.

Did you get that?  "Likely to be a response to some
kind of recent anthropogenic forcing."  Of course, he does not know what
that forcing on his tree rings is and can't prove this statement, but he throws
the data out none-the-less.  This is the editor and lead author for the
historical section of the IPCC report, who clearly has anthropogenic effects on
the brain.  Later studies avoided Briffa's problem by cherry-picking data
sets to avoid the same result.

We'll get back to this issue of the proxies diverging from
measured temperatures in the moment.  But let's take a step back and ask
"So should 12 studies telling the same story (at least once they are truncated
and "corrected') make us more confident in the answer?"  It is at this
point that it is worth making a brief mention of the concept of "systematic
error."   Imagine the problem of timing a race.  If one feared
that any individual might make a mistake in timing the race, he could get say
three people to time the race simultaneously, and average the results.
Then, if in a given race, one person was a bit slow or fast on the button, his
error might be averaged out with the other two for a result hopefully closer to
the correct number.  However, let's say that all three are using the same
type of watch and this type watch always runs slow.  In this case, no amount
of extra observers are going to make the answer any better "“ all the times will
be too low.  This latter type of error is called systematic error, and is
an error that, due to some aspect of a shared approach or equipment or data
set, multiple people studying the same problem can end up with the same error.

There are a couple of basic approaches that all of these
studies share.  For example, they all rely heavily on the same tree ring
proxies (in fact the same fifty or sixty trees), most of which are of one species
(bristlecone pine).  Scientists look at a proxy, such as tree rings, and
measure some dimension for each year.  In this case, they look at the tree
growth.  They compile this growth over hundreds of years, and get a data
set that looks like 1999- .016mm, 1998, .018mm  etc.  But how does
that correlate to temperature? What they do is pick a period, something like
1960-1990, and look at the data and say "we know temperatures average X from
1980 to 1990.  Since the tree rings grew Y, then we will use a scaling
factor of X/Y to convert our 1000 years of tree ring data to
temperatures. 

I can think of about a million problems with this.
First and foremost, you have to assume that temperature is the ONLY driver for
the variation in tree rings.  Drought, changes in the sun, changing soil
composition or chemistry,  and even CO2 concentration substantially affect
the growth of trees, making it virtually impossible to separate out temperature
from other environmental effects in the proxy.

Second, one is forced to assume that the scaling  of
the proxy is both linear and constant.  For example, one has to assume a
change from, say, 25 to 26 degrees has the same relative effect on the proxy as
a change from 30 to 31 degrees.  And one has to assume that this scaling
is unchanged over a millennium.  And if one doesn't assume the scaling is
linear, then one has the order-of-magnitude harder problem of deriving the
long-term shape of the curve from only a decade or two of data.  For a
thousand years, one is forced to extrapolate this scaling factor from just one
or two percent of the period.

But here is the problem, and a potential source for
systematic error affecting all of these studies:  Current proxy data is
wildly undershooting prediction of temperatures over the last 10-20
years.  In fact, as we learned above, the proxy data actually shows little
or no 20th century warming.  Scientists call this "divergence"
of the proxy data.  If Briffa had hadn't artificially truncated his data
at 1950, the effect would be even more dramatic.  Below is a magnification
of the spaghetti chart from above "“ remember the black line is "actual," the
other lines are the proxy studies.


In my mind, divergence is quite damning.  It implies
that scaling derived from 1960-1980 can't even hold up for the next decade,
much less going back 1000 years!  And if proxy data today can be
undershooting actual temperatures (by a wide margin) then it implies it could
certainly be undershooting reality 700 years ago.  And recognize that I am
not saying one of these studies is undershooting "“ they almost ALL are
undershooting, meaning they may share the same systematic error.  (It
could also mean that measured surface temperatures are biased high, which we
will address a bit later.

The short view (100
years)

The IPCC reports that since 1900, the world's surface has
warmed about 0.6C, a figure most folks will accept (with some provisos I'll get
to in a minute about temperature measurement biases).  From
the NOAA Global Time Series:

Temperatureline

This is actually about the same data in the Mann hockey stick chart -- it
only looks less frightening here (or more frightening in Mann) due to the
miracle of scaling.  Next, we can overlay CO2:

Historic_co2

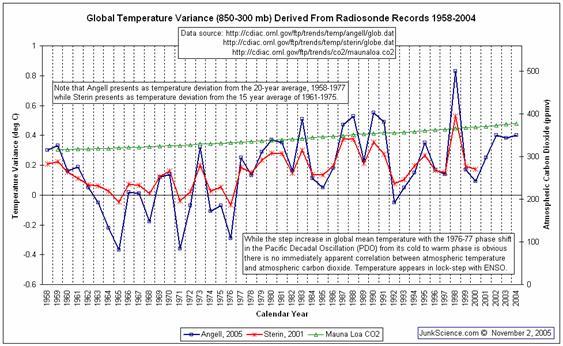
This chart is a real head-scratcher for scientists trying to
prove a causal relationship between CO2 and global temperatures.  By
theory, temperature increases from CO2 should be immediate, though the oceans
provide a big thermal sink that to this day is not fully understood.
However, from 1880 to 1910, temperatures declined despite a 15ppm increase in
CO2.  Then, from 1910 to 1940 there was another 15ppm increase in CO2 and
temperatures rose about 0.3 degrees.  Then, from 1940-1979, CO2 increased
by 30 ppm while temperatures declined again.  Then, from 1980 to present,
CO2 increased by 40 ppm and temperatures rose substantially.  By grossly
dividing these 125 years into these four periods, we see two long periods
totaling 70 years where CO2 increases but temperature declines and two long
periods totaling 55 years of both CO2 and temperature increases. 

By no means does this variation disprove a causal relation
between CO2 concentrations and global temperature.  However, it also can
be said that this chart is by no means a slam dunk testament to such a
relationship.  Here is how strong AGW supporters explain this data:
Strong AGW supporters will assign most, but not all, of the temperature
increase before 1950 to "natural" or non-anthropogenic causes.  The current
IPCC report in turn assigns a high probability that much or all of the warming after
1950 is due to anthropogenic sources, i.e. man-made CO2.  Which still
leaves the cooling between 1940 and 1979 to explain, which we will cover
shortly.

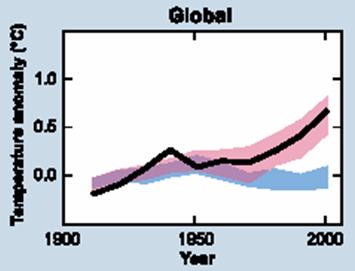
Take this chart from the fourth IPCC report (the blue band
is what the IPCC thinks would have happened without anthropogenic effects, the
pink band is their models' output with man's influence, and the black line is
actual temperatures (greatly smoothed).

Scientists know that "something" caused the pre-1950
warming, and that something probably was natural, but they are not sure exactly
what it was, except perhaps a recovery from the little ice age.  This is
of course really no answer at all, meaning that this is just something we don't
yet know.  Which raises the dilemma: if whatever natural effects were
driving temperatures up until 1950 cannot be explained, then how can anyone say
with confidence that this mystery effect just stops after 1950, conveniently at
the exact same time anthropogenic warming "takes over"?  As you see here,
it is assumed that without anthropogenic effects, the IPCC thinks the world
would have cooled after 1950.  Why?  They can't say.  In fact, I
will show later that this assumption is really just a necessary plug to prevent
their models from overestimating historic warming.  There is good evidence
that the sun has been increasing its output and would have warmed the world,
man or no man, after 1950. 

But for now, I leave you with the question "“ If we don't
know what natural forcing caused the early century warming, then how can we say
with confidence it stopped after 1950?
  (By the way, for those of you
who already know about global cooling/dimming and aerosols, I will just say for
now that these effects cannot be making the blue line go down because the IPCC
considers these anthropogenic effects, and therefore in the pink band.
For those who have no idea what I am talking about, more in a bit).

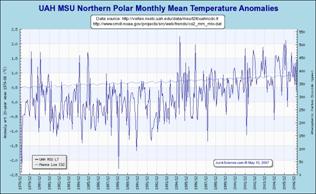
Climate scientist Syun-Ichi Akasofu of the International
Arctic Research Center at University of Alaska Fairbanks makes
a similar point
, and highlights the early 20th century
temperature rise:

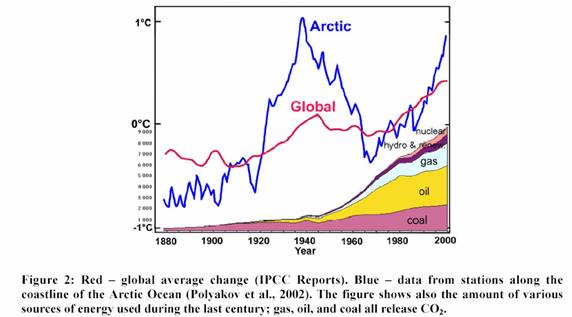
Again, what drove the Arctic warming up through 1940?
And what confidence do we have that this forcing magically went away and has
nothing to do with recent temperature rises?

Sulfates, Aerosols,
and Dimming

Strong AGW advocates are not content to say that CO2 is one
factor among many driving climate change.  They want to be able to say CO2
is THE factor.  To do so with the historical record over the last 100
years means they need to explain why the world cooled rather than warmed from
1940-1979.

Strong AGW supporters would prefer to forget the global
cooling hysteria in the 1970s.  During that time, the media played up
scientific concerns that the world was actually cooling, potentially
re-entering an ice age, and that crop failures and starvation would
ensue.  (It is interesting that AGW proponents also predict agricultural
disasters due to warming.  I guess this means that we are, by great coincidence,
currently at the exact perfect world temperature for maximizing agricultural
output, since either cooling or warming would hurt production).  But even
if they want to forget the all-too-familiar hysteria, they still need to
explain the cooling.

What AGW supporters need is some kind of climate effect that
served to reduce temperatures starting in 1940 and that went away around
1980.  Such an effect may actually exist.

There is a simple experiment that meteorologists have run
for years in many places around the world.  They take a pan of water of
known volume and surface area and put it outside, and observe how long it takes
for the water to evaporate.  If one correctly adjusts the figures to
reflect changes in temperature and humidity, the resulting evaporation rate
should be related to the amount of solar irradiance reaching the pan.  In
running these experiments, there does seem to be a reduction of solar
irradiance reaching the Earth, perhaps by as much as 4% since 1950.  The
leading hypothesis is that this dimming is from combustion products including
sulfates and particulate matter, though at this point this is more of a
hypothesis than demonstrated cause and effect.  The effect is often called
"global dimming."

The aerosol hypothesis is that sulfate aerosols and black carbon are the
main cause of global dimming, as they tend to act to cool the Earth by
reflecting and scattering sunlight before it reaches the ground.  In
addition, it is hypothesized that these aerosols as well as particulates from
combustion may act to seed cloud formation in a way that makes clouds more
reflective.  The nations of the world are taking on sulfate and
particulate production, and will likely substantially reduce this production
long before CO2 production is reduced (mainly because it is possible with
current technology to burn fossil fuels with greatly reduced sulfate output,
but it is not possible to burn fossil fuels with greatly reduced CO2
output).  If so, we might actually see an upward acceleration in
temperatures if aerosols are really the cause of dimming, since their removal
would allow a sort-of warming catch-up.

Sulfates do seem to be a pretty good fit with the cooling
period, but a couple of things cause the fit to be well short of perfect.
First, according to Stern,
production of these aerosols worldwide (right) did not peak until 1990, at
level almost 20% higher than they were in the late 1970's when the global
cooling phenomena ended. 

One can also observe that sulfate production has not fallen
that much, due to new contributions from China and India and other developing
nations (interestingly, early drafts of the fourth IPCC report hypothesized
that sulfate production may not have decreased at all from its peak, due to
uncertainties in Asian production).  Even today, sulfate levels have not
fallen much below where they were in the late 1960's, at the height of the
global cooling phenomena, and higher than most of the period from 1940 to 1979
where their production is used to explain the lack of warming.

Further, because they are short-lived, these sulfate dimming effects really only can be
expected to operate over in a few isolated areas around land-based industrial areas, limiting their effect on global temperatures
since they effect only a quarter or so of the globe.   You can see this below, where high sulfate aerosol concentrations, show in orange and red, only cover a small percentage of the globe.

Sulfate2

Given these areas, for the whole world to be cooled 1 degree C by aerosols and black carbon, the areas in orange and red would have to cool 15 or 20C, which absolutely no one has observed.  In fact, since as you can see, most of these aerosols are in the norther hemisphere, one would expect that, if cooling were a big deal, the northern hemisphere would have cooled vs. the southern, but in fact as we will see in a minute exactly the opposite is true -- the northern hemisphere is heating much faster than the south.  Research
has shown that dimming is three times greater in urban areas close to where the
sulfates are produced (and where most university evaporation experiments are
conducted) than in rural areas, and that in fact when you get out of the
northern latitudes where industrial society dominates, the effect may actually
reverse in the tropics.

There are, though, other potential explanations for
dimming.  For example, dimming may be an effect of global warming
itself.  As I will discuss in the section on feedback processes later,
most well-regulated natural systems have feedback mechanisms that tend to keep
trends in key variables from "running away."  In this case, warming may be
causing cloud formation due to increased evaporation from warmer oceans.

It is also not a done deal that test evaporation from pans
necessarily represents the rate of terrestrial evaporation.  In fact,
research has shown that pan evaporation can decrease because surrounding
evaporation increases, making the pan evaporation more an effect of atmospheric
water budgets and contents than irradiance.

This is a very important area for research, but as with
other areas where promoters of AGW want something to be true, beware what you
hear in the media about the science.  The IPCC's fourth report continues
to say that scientific understanding of many of these dimming issues is
"low."  Note also that global dimming does not "prove" AGW by any means,
it merely makes the temperature-CO2 correlation better in the last half of the
20th century.  All the other issues we have discussed remain.

The Troposphere
Dilemma and Urban heat islands

While global dimming may be causing us to under-estimate the
amount of global warming, other effects may be causing us to over-estimate
it.  One of the mysteries in climate science today has to do with
different rates of warming on the Earth's surface and in the troposphere (the
first 10km or so of atmosphere above the ground).  AGW theory is pretty
clear "“ the additional heat that is absorbed by CO2 is added to the
troposphere, so the troposphere should experience the most warming from
greenhouse gasses.  Some but not all of this warming will transfer to the
surface, such that we should expect temperature increases from AGW to be larger
in the troposphere than at the surface.

Well, it turns out that we have two ways to measure
temperature in the troposphere.  For decades, weather balloons have been
sent aloft to take temperature readings at various heights in the
atmosphere.  Since the early 70's, we have also had satellites capable of
mapping temperatures in the troposphere.  From Spencer and Christy, who
have done the hard work stitching the satellite data into a global picture,
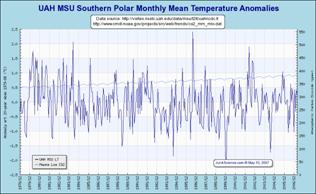
comes this chart of satellite-measured temperatures in the troposphere.
The top chart is Global, the middle is the Northern Hemisphere, the bottom is
the Southern Hemisphere

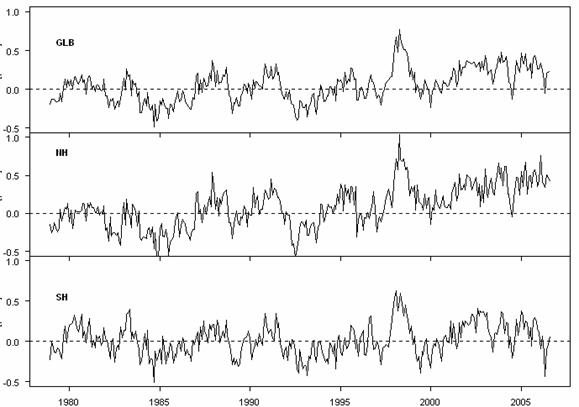
You will probably note a couple of interesting things.
The first is that while the Northern hemisphere has apparently warmed about a
half degree over the last 20 years, the Southern hemisphere has not warmed at
all, at least in the troposphere.  You might assume this is because the
Northern Hemisphere produces most of the man-made CO2, but scientists have
found that there is very good global mixing in the atmosphere, and CO2
concentrations are about the same wherever you measure them.  Part of the
explanation is probably due to the fact that temperatures are more stable in
the Southern hemisphere (since land heats and cools faster than ocean, and
there is much more ocean in the southern half of the globe), but the surface
temperature records do not show such a north-south differential.  At the
end of the day, nothing in AGW adequately explains this phenomenon.  (As
an aside, remember that AGW supporters write off the Medieval Warm Period
because it was merely a local phenomena in the Northern Hemisphere not observed
in the south "“ can't we apply the same logic to the late 20th
century based on this satellite data?)

An even more important problem is that the global
temperature increases shown here in the troposphere over the last several
decades have been lower than on the ground, exactly opposite of predictions
by AGW theory,

In 2006, David Pratt
put together a combined chart of temperature anomalies, comparing satellite
measurements of the troposphere with ground temperature measurements.  He
found, as shown in the chart below, but as you can see for yourself visually in
the satellite data, that surface warming is substantially higher over the last
25 years than warming of the troposphere.  In fact, the measured anomaly
by satellite (and by balloon, as we will see in a minute) is half or less than
the measured anomaly at the surface.

There are a couple of possible explanations for this
inconsistency.  One, of course, is that there is something other than
CO2-driven AGW that is at least partially driving recent global temperature
increases.  We will cover several such possibilities in a later chapter on
alternative theories.  One theory that probably does not explain
this differential is global dimming.  If anything, global dimming should
work the other way, cooling the ground vs. the troposphere.  Also, since
CO2 works globally but SO2 dims locally, one would expect more cooling effect
in the northern vs. the southern hemisphere, while actually the opposite is
observed.

Sat1

Another possible explanation, of course, is that one or the other
of these data sets has a measurement problem.  Take the satellite
data.  The measurement of global temperatures from space is a relatively
new art, and the scientists who compile the data set have been through a number
of iterations to their model for rolling the measurements into a reliable
global temperature (Christy just released version 6).  Changes over the
past years have actually increased some of the satellite measurements (the
difference between ground and surface used to be even greater).  However,
it is unlikely that the quality of satellite measurement is the entire reason
for the difference for the simple reason that troposphere measurement by
radiosonde weather balloons, a much older art, has reached very consistent
findings (if anything, they show even less temperature  increase since
1979).

A more likely explanation than troposphere measurement
problems is a measurement problem in the surface data.  Surface data is
measured at thousands of points, with instruments of varying types managed by
different authorities with varying standards.  For years, temperature
measurements have necessarily been located on land and usually near urban areas
in the northern hemisphere.  We have greatly increased this network over
time, but the changing mix of reporting stations adds its own complexity.

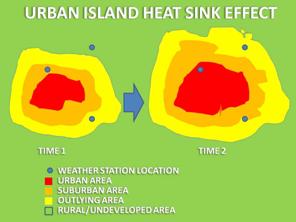
The most serious problem with land temperature data is from
urban heat islands.  Cities tend to heat their environment.  Black
asphalt absorbs heat, concrete covers vegetation, cars and power sources
produce heat.  The net effect is that a city is several degrees hotter
than its surroundings, an effect entirely different from AGW, and this effect
tends to increase over time as the city gets larger.   (Graphic
courtesy of Bruce Hall)

Climate scientists sometimes (GISS "“ yes, NOAA -- no)
attempt to correct measurements in urban areas for this effect, but this can be
chancy since the correction factors need to change over time, and no one really
knows exactly how large the factors need to be.   Some argue that the
land-based temperature set is biased too high, and some of the global warming
shown is in fact a result of the UHI effect.   
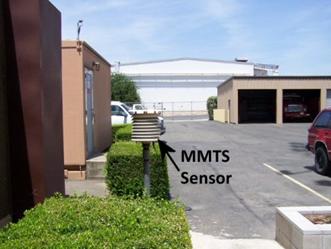
Anthony Watts
has done some great work surveying the problems with long-term temperature
measurement (some of which was obtained for this paper via Steve McIntyre's Climate Audit blog).
He has been collecting pictures of California measurement sites near his home,
and trying to correlate urban building around the measurement point with past
temperature trends.  More importantly, he has created an online database
at SurfaceStations.org where
these photos are being put online for all researchers to access.

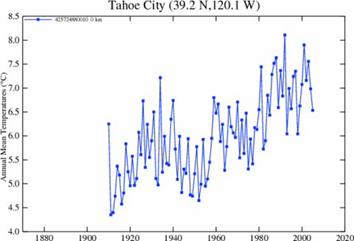
The tennis courts and nearby condos were built in 1980, just
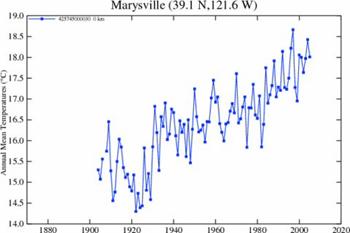
as temperature measurement here began going up.  Here is another, in
Marysville, CA, surrounded by asphalt and right next to where cars park with
hot radiators.  Air conditioners vent hot air right near the thermometer,
and you can see reflective glass and a cell tower that reflect heat on the
unit.  Oh, and the BBQ the firemen here use 3 times a week.

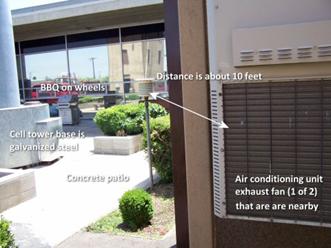
So how much of this warming is
from the addition of air conditioning exhaust, asphalt paving, a nearby
building, and car radiators, and how much is due to CO2.  No one
knows.  The more amazing thing is that AGW supporters haven't even tried
to answer this question for each station, and don't even seem to care. 

As of June 28, 2007, The
SurfaceStations.org documentation effort received a setback when the NOAA, upon
learning of this effort, removed surface station location information from
their web site. The only conclusion is that the NOAA did not want the shameful
condition of some of these sites to be publicized. 

I have seen sites like RealClimate arguing in their myth
busting segments that the global temperature models are based only on rural
measurements.  First, this can't be, because most rural areas did not have
measurement in the early 20th century, and many once-rural areas are
now urban.  Also, this would leave out huge swaths of the northern
hemisphere.  And while scientists do try to do this in the US and Europe
(with questionable success, as evidenced by the pictures above of sites that
are supposedly "rural"), it is a hopeless and impossible task in the rest of
the world.  There just was not any rural temperature measurement in China
in 1910.

Intriguingly, Gavin Schmidt, a lead researcher at NASA's
GISS, wrote
Anthony Watts
that criticism of the quality of these individual temperature
station measurements was irrelevant because GISS climate data does not relay on
individual station data, it relies on grid cell data.  Just as background,
the GISS has divided the world into grid cells, like a matrix (example below).

Unless I am missing something fundamental, this is an
incredibly disingenuous answer.  OK, the GISS data and climate models use
grid cell data, but this grid cell data is derived from ground measurement
stations.  So just because there is a statistical processing step between
"station data" and "grid cell data" does not mean that at its core, all the
climate models don't rely on station data.  All of these issues would be
easier to check of course if NASA's GISS, a publicly funded research
organization, would publicly release the actual temperature data it uses and
the specific details of the algorithms it uses to generate and smooth and
correct grid cell data.  But, like most all of climate science, they
don't.  Because they don't want people poking into it and criticizing
it.  Just incredible.

As a final note, for those that think something as seemingly
simple as consistent temperature measurement is easy, check out this theory
courtesy of Anthony
Watts

It seems that weather stations shelters known as Stevenson Screens (the
white chicken coop like boxes on stilts housing thermometers outdoors) were
originally painted with whitewash, which is a lime based paint, and reflective
of infra-red radiation, but its no longer available, and newer paints have been
used that [have] much different IR characteristics.

Why is this important? Well, paints that appear
"white" and reflective in visible light have different properties in
infrared. Some paints can even appear nearly "black" and absorb a LOT
of infrared, and thus bias the thermometer. So the repainting of thousands of
Stevenson screens worldwide with paints of uncertain infrared characteristics
was another bias that has crept into the instrumental temperature records.

After running this test, Watts actually ran an experiment comparing wood
that had been whitewashed vs. using modern white latex paint.  The
whitewashed wood was 5 degrees cooler than the modern latex painted wood.

Using Computer Models to Explain the Past

It is often argued by AGW supporters that because the
historic warming is so close to what the current global warming models say
historic temperatures should look like, and because the models are driven by
CO2 forcings, then CO2 must be causing the historic temperature increase.
We are going to spend a lot of time with models in the next chapter, but here
are a few thoughts to tide us over on this issue.

The implication here is that scientists carefully crafted
the models based on scientific theory and then ran the models, which nearly
precisely duplicated history.  Wrong.  In fact, when the models were
first built, scientists did exactly this.  And what they got looked
nothing like history.

So they tweaked and tuned, changing a constant here, adding
an effect (like sulfates) there, changing assumptions about natural forcings,
until the models matched history.  The models match history because they
were fiddled with until they matched history.  The models say CO2 caused
warming because they were built on the assumption that CO2 causes
warming.  So, unless one wants to make an incredibly circular argument,
the models are useless in determining how much CO2 affects history.  But
we'll get to a lot more on models in the next chapter.

The table of contents for the rest of this paper, . 4A Layman's Guide to Anthropogenic Global Warming (AGW) is here Free pdf of this Climate Skepticism paper is here and print version is sold at cost here

The open comment thread for this paper can be found here. 

Chapter 5: Computer Models and Predicting Future Climate (Skeptics Guide to Global Warming)

The table of contents for the rest of this paper, . 4A Layman's Guide to Anthropogenic Global Warming (AGW) is here Free pdf of this Climate Skepticism paper is here and print version is sold at cost here

We have gotten well into this paper, and we still have not
discussed what is perhaps the most problematic aspect of AGW research:
the computer models.

If an economist came up with a computer model that he claimed could predict
the market value of every house in the world in the year 2106 within $1,000,
would you believe him?  No, you would say he was nuts -- there is way too
much uncertainty and complexity.  Climate, of course, is not the same as
housing prices.  It is in fact, much, much more complex and more difficult
to predict.  There is nothing wrong with trying to predict the complex and
chaotic.  But there is a certain sense of hubris in believing that one has
succeeded with the kind of 95% certainty figures used by the IPCC.

All climate forecasting models are created by a pretty insular and
incestuous climate science community that seems to compete to see who can come
up with the most dire forecast.  Certainly there are financial incentives
to be as aggressive as possible in forecasting climate change, since funding
dollars tend to get channeled to those who are the most dramatic.
The global warming community spends a lot of time with ad hominem attacks
on skeptics, usually accusing them of being in the pay of oil and power
companies, but they all know that their own funding in turn would dry up
rapidly if they were to show any bit of skepticism in their own work.

The details of these models is beyond the scope of this paper.
However, it is important to understand how they work in broad outlines.

The modelers begin with certain assumptions about climate that they build
into the model.  For example, the computers themselves don't somehow
decide if CO2 is a more important forcing on the climate than solar activity "“
the modelers, by the assumptions the feed into the model, decide these
things.  The models return the result that CO2 is the most important
driver of climate in the coming century because their programmers built them
with that assumption, not because the model somehow sorts through different
inputs and comes up with the key drivers on its own.

Because the models have been built to test man's possible impact on the
climate via greenhouse gas emissions, they begin with an econometric forecast
of world economic growth, and, based upon assumptions about fuel sources and
efficiencies, they convert this economic growth into emissions forecasts.
The models generally contain subroutines that calculate, again based upon a
variety of assumptions, how man-made CO2 plus other inputs will change the
atmospheric CO2 concentration.  Then, via assumptions about climate
sensitivity to CO2 and various feedback loops programmed in, the models will
create forecasts of temperatures, precipitation, etc.  These models,
depending on their complexity, will show regional variations in many of these
variables.  Finally, the models are tuned so that they better match
history, in theory making them more accurate for the future.

One should note that while the IPCC asked modelers to look at a series of
different cases, the only substantial difference between these cases is the
volume of CO2 and other greenhouse gasses produced.  In other words, the
only sensitivity the IPCC seriously modeled was on levels of CO2.  No
other contingency "“ e.g. potential variations in global temperature sensitivity
to CO2, solar output, land use "“ were considered.  This should give you an
idea of how hard-wired the anthropogenic causation is in the IPCC process.

In this section, I will begin by discussing the models' basic assumptions
about the climate.  I will then discuss the econometric forecasts they are
founded on, the assumptions about CO2 sensitivity and feedback processes, and
finally model tuning and their ability to match history.

The Dangers in Modeling Complex Systems

At any one time, thousands of people are being paid literally millions of
dollars on Wall Street to try to model the behavior of various stock indices
and commodity prices.  The total brain power and money power thrown over
the last 50 years at trying to build an accurate predictive model for financial
markets literally dwarfs, by a factor of 100 or more, the cumulative resources
spent to date on long-term climate modeling.  Financial markets are
incredibly complex, and they are driven by hundreds of variables.
Interest rates, corporate profits, loan default rates, mortgage refinance
rates, real estate prices, GDP growth, exchange rates, etc. all tend to drive
the behavior of financial markets.  And no one has cracked the code.
Sure, some people have built successful short-term trading models, but people
have mostly lost their shirts when they have tried to make long-term bets based
on computer financial models that beautifully matched history but failed to
accurately predict the future.

How is it possible that a model that accurately represents the past fails to
accurately predict the future?  Financial modelers, like climate modelers,
look to history in building their models.  Again, like climate modelers,
they rely both on theory (e.g. higher interest rates should generally mean
lower stock prices) as well as observed correlations in the historic data
set.  The problem they meet, the problem that every modeler meets but most
especially the climate modeler, is that while it is easy to use various
analysis tools to find correlations in the data, there is often nothing that
will tell you if there is really a causal relationship, and which way the
causality runs. For example, one might observe that interest rates and exchange
rates move together.  Are interest rate changes leading to exchange rate
adjustments, or vice versa?  Or, in fact, are they both caused by a third
variable?  Or is their observed correlation merely coincidence?

It was once observed that if an old AFL football team wins the Superbowl, a
bear market will ensue on Wall Street in the next year, while an NFL team
victory presaged a bull market.  As of 1997, this correlation held for 28
of the last 31 years, a far better prediction record than that of any Wall
Street analyst.  But of course this correlation was spurious, and in the
next 4 years it was wrong every time.  Had someone built a financial model
on this indicator, it would have looked great when he ran it against history,
but he would have lost his shirt using it. 

Want a better prediction record?  For seventeen straight US
presidential election cycles, from 1936 to 2000, the winner of the election was
accurately predicted by"¦the Washington Redskins.  In particular, if the
Redskins won their last home game before the election, the party that occupies
the White House holds it in the election.  Otherwise, if the Redskins
lose, the opposition party wins.  Seventeen in a row!  R-squared of
one!  Success against odds of 131,072:1 of guessing all 17 right.
But of course, the input was spurious, and in 2004, soon after this
relationship made the rounds of the Internet, the algorithm failed.

This is why we spent so much time in the previous chapter on evaluating
historic correlations between CO2 and temperature.  Because the models are
built on an assumption that not only is temperature strongly correlated with
CO2, but that temperature is historically highly stable without this outside
anthropogenic forcing.  If there are problems with this assumed causation,
which we saw there are, then there in turn are major inherent problems with the
models themselves.   As climate scientist Syun-Ichi Akasofu of the
International Arctic Research Center at University of Alaska Fairbanks wrote:

The computers are "taught" that the temperature
rise during the last hundred years is due mostly to the greenhouse effect. If
the truth is that only about 10% of the present warming is caused by the
greenhouse effect, the computer code must be rewritten

Do Model Outputs Constitute Scientific Proof?

Remember what I said earlier:  The models produce the result that there
will be a lot of anthropogenic global warming in the future because they are
programmed to reach this result.  In the media, the models are used as a
sort of scientific money laundering scheme.  In money laundering, cash
from illegal origins (such as smuggling narcotics) is fed into a business that
then repays the money back to the criminal as a salary or consulting fee or
some other type of seemingly legitimate transaction.  The money he gets
back is exactly the same money, but instead of just appearing out of nowhere, it
now has a paper-trail and appears more legitimate.  The money has been
laundered.

In the same way, assumptions of dubious quality or certainty that presuppose
AGW beyond the bounds of anything we have see historically are plugged into the
models, and, shazam, the models say that there will be a lot of anthropogenic
global warming.  These dubious assumptions, which are pulled out of thin
air, are laundered by being passed through these complex black boxes we call
climate models and suddenly the results are somehow scientific proof of
AGW.  The quality hasn't changed, but the paper trail looks better, at
least in the press.  The assumptions begin as guesses of dubious quality
and come out laundered at "settled science."  Climate
Scientists Garth Paltridge wrote
:

It needs to be understood that any reasonable
simulation even of present climate requires computer models to be tuned. They contain
parameters (that is, pieces of input information) whose numerical values are
selected primarily to give the right answer about today's climate rather than
because of some actual measurement. This was particularly so in the
mid-eighties. The problem with tuning is that it makes any prediction of
conditions different from those of the present far less believable. Even today
the disease of "tuneable parameters" is still rampant in climate
models, although fairly well hidden and not much spoken of in polite society.
The scientifically-inclined reader might try sometime asking a climate
researcher just how many such parameters there are in his or her latest model.
The reader will find there are apparently lots of reasons why such a question
is ridiculous, or if not ridiculous then irrelevant, and if not irrelevant then
unimportant. Certainly the enquirer will come away having been made to feel
foolish.

Econometrics and
CO2 Forecasts

The IPCC has never been able to choose a particular climate model it thinks
is best.  Instead, it aggregates ten or twelve of them and averages their
results, hoping that if there are errors in the climate models, they will
average out somehow (forgetting that systematic errors don't average out, as we
discussed earlier in the context of historic temperature
reconstructions).  The one thing the IPCC does do to bring some order to
all this is to establish baseline econometric and emissions scenarios for all
the teams to feed into the front end of their models.  That way, for a given
forecast case, they know variation in model output is due to differing
climate-related assumptions rather than differing economic assumptions.

But a funny thing happens when one tries to make an economic growth forecast
for 100-year periods, as the IPCC has: Very small changes in assumptions make
enormous differences.  Here is a simple example.  An economy that
grows by 3% per year will be 19x larger in 100 years.  However, if that
economy were to grow instead by 4% rather than 3%, it will be 51x larger in 100
years.  So a change in the growth rate by one percentage point yields a
final size nearly 2.7 times larger.   The same is true with
forecasting CO2 growth "“ a very small change in assumptions can lead to very
large differences in absolute production.

After release of the 3rd IPCC report in 2001, researchers Ian
Castles, formerly the head of Australia's national office of statistics, and
David Henderson of the Westminster Business School and formerly the chief
economist of the OECD, decided to scrutinize
the IPCC's economic assumptions
.  They found that the IPCC had made a
fundamental mistake in crafting their econometrics, one that caused all of
their economic growth estimates (and therefore estimates of CO2 production) to
be grossly overestimated.  Based on the IPCC assumptions, South Africa
ends up with a GDP per capita far in excess of the United States by the year
2100.  Incredibly, the IPCC numbers imply that Algeria, Argentina, Libya,
Turkey, and North Korea will all pass the US in per capita income by the end of
the century.

Beyond making it clear that there is an element of the absurd in the IPCC's
economic forecasting approach, these errors tend to inflate CO2 forecasts in
two ways.  First, CO2 forecasts are raised because, in the models, larger
economies produce more CO2.  Second, though, the models assume different
rates for CO2 production per unit of GDP for each country.  Most of the
countries the IPCC shows growing so fast "“ Algeria, South Africa, Libya, North
Korea, etc. "“ have lower than average CO2 efficiencies (i.e. higher than
average CO2 production per unit of GDP), so excess growth assumptions in these
countries has a disproportionate impact on projected CO2 emissions.  By
the way, it would be interesting to see if the IPCC is using marginal rather
than average rates.  For example, France has a very low average rate of
CO2 per unit of GDP because of its nukes, but its marginal growth is met mostly
with fossil fuels.

I can't say whether these same mistakes exist in the 2007 4th
Assessment.  However, since the IPCC flatly rejected Castles and
Henderson's critique, it is likely the same methodology was used in 2007 as in
2001.  For example, here are the CO2 emissions forecasts from the 4th
assessment "“ notice most all of them have a step-change increase in slope
between history and the future.  Just look at the jump across the dotted
line in lead case A1B, and several are even steeper.

So what does this mean?  Remember, small changes in growth rate make
big differences in end values.  For example, below are the IPCC fourth
assessment results for CO2 concentration.  If CO2 concentrations were to
increase at about the same rate as they are today, we would expect an end value
in 2100 of between 520 and 570 ppm, as opposed to the IPCC numbers below where
the projection mean is over 800 in 2100.  The difference is in large part
in the economic growth forecasts. 

Since it is not at all clear that the IPCC has improved its forecasting
methodology over the past years, it is instructive as one final exercise to go
back to the 1995 emissions scenarios in the 2nd assessment.
Though the scale is hard to read, one thing is clear "“ only 10 years later we
are well below most of the forecasts, including the lead forecast is92a (this
over-forecasting has nothing to do with Kyoto, the treaty's impact has been
negligible, as will be discussed later).  One can be assured that if the
forecasts are already overstated after 10 years, they will be grossly
overstated in 100.

Climate Sensitivity
and the Role of Positive Feedbacks

As discussed earlier, climate sensitivity generally refers to the expected
reaction of global temperatures to a arbitrary change in atmospheric CO2
concentration.  In normal usage, it is usually stated as degrees Celsius
of global warming from a doubling in CO2 concentrations from pre-industrial
levels (approx 280 ppm to 560 ppm).  The IPCC and most AGW supporters put
this number at about 3.5 to 4.0 degrees C. 

But wait "“ earlier I said the number was probably more like 1.0C, and that
it was a diminishing return.  Why the difference?  Well, it has to do
with something called feedback effects.

Before I get into these, let's think about a climate sensitivity of 4
degrees C, just from a historical standpoint.  According to the IPCC, CO2
has increased by about 100ppm since 1880, which is about 36% of the way to a
doubling.  Over this same time period, global temperatures have increased
about 0.7C. Since not even the most aggressive AGW supporter will attribute all
of this rise to CO2 levels, let's be generous and credit CO2 with 0.5C.
So if we are 36% of the way to a doubling, and giving CO2 credit for 0.5
degrees, this implies that the sensitivity is probably not more than 1.4
degrees C.  And we only get a number this high if we assume a linear
relationship "“ remember that CO2 and temperature are a diminishing return
relation (chart at right), so future CO2 has less impact on temperature than
past CO2, so 1.4 would be at the high end.  In fact, using the logarithmic
relationship we saw before, 0.5 degrees over 36% of the doubling would imply a
sensitivity around 1.0.  So, based on history, we might expect at worst
another 0.5C from warming over the next century. 

Most AGW supporters would argue that the observed sensitivity over the last
30 years has been suppressed by dimming/sulfate aerosols.  However, to get
a sensitivity of 4.0, one would have to assume that without dimming, actual
warming would have been about 2.0C.  This means that for the number 4.0 to
be right,

1. Absolutely nothing else other than CO2 has been causing warming in the
last 50 years AND

2. Sulfate aerosols had to have suppressed 75% of the warming, or about
1.5C, numbers far larger than I have seen anyone suggest.  Remember that
the IPCC classifies our understanding of this cooling effect, if any, as "low"

But in fact, even the IPCC itself admits that its models assume higher
sensitivity than the historically observed sensitivity.  According to the
fourth IPCC report, a number of studies have tried to get at the sensitivity
historically (going back to periods where SO2 does not cloud the picture).
  Basically, their methodology is not much different in concept than
the back of the envelope calculations I made above.

These are shown in a) below, which shows a probability distribution of what
sensitivity is (IPCC4 p. 798). Note many of the highest probability values of
these studies are between 1 and 2.  Also note that since CO2 content is,
as the IPCC has argued, higher than it has been in recorded history, any
sensitivities calculated on historical data should be high vs. the sensitivity
going forward.  Now, note that graph c) shows how a number of the climate
models calculate sensitivity.  You can see that their most likely values
are consistently higher than any of the historical studies from actual
data.  This means that the climate models are essentially throwing out
historical experience and assuming that sensitivity is 1.5 to 2 times higher
going forward, despite the fact a diminishing return relationship says it
should be lower.


Sensitivity, based on History


Sensitivity that is built into the models  (Sorry, I still have no idea
what "constrained by climatology" means, but the text of the report makes it clear
that these sensitivities popped out of climate models


So how do these models get to such high sensitivities?  The answer, as
I have mentioned, is positive feedback.

Let me take a minute to discuss positive feedbacks.  This is something
I know a fair amount about, since my specialization at school in mechanical
engineering was in control theory and feedback processes.  Negative
feedback means that when you disturb an object or system in some way, forces
tend to counteract this disturbance.  Positive feedback means that the
forces at work tend to reinforce or magnify a disturbance.

You can think of negative feedback as a ball sitting in the bottom of a
bowl.  Flick the ball in any direction, and the sides of the bowl,
gravity, and friction will tend to bring the ball back to rest in the center of
the bowl.  Positive feedback is a ball balanced on the pointy tip of a
mountain.  Flick the ball, and it will start rolling faster and faster
down the mountain, and end up a long way away from where it started with only a
small initial flick.

Almost every process you can think of in nature operates by negative
feedback.  Roll a ball, and eventually friction and wind resistance bring
it to a stop.  There is a good reason for this.  Positive feedback
breeds instability, and processes that operate by positive feedback are
dangerous, and usually end up in extreme states.  These processes tend to
"run away."   I can illustrate this with an example:
Nuclear fission is a positive feedback process.  A high energy neutron
causes the fission reaction, which produces multiple high energy neutrons that
can cause more fission.  It is a runaway process, and it is dangerous and
unstable.  We should be happy there are not more positive feedback
processes on our planet.

Since negative feedback processes are much more common, and since positive
feedback processes almost never yield a stable system, scientists assume that
processes they meet are negative feedback until proven otherwise.  Except
in climate, it seems, where everyone assumes positive feedback is common.

In global warming models, water vapor plays a key role as both a positive
and a negative feedback loop to climate change.  Water vapor is a far more
powerful greenhouse gas than CO2, so its potential strength as a feedback
mechanism is high.  Water comes into play because CO2 driven warming will
put more water vapor in the atmosphere, because greater heat will vaporize more
water.  If this extra vapor shows up as more humid clear air, then this in
turn will cause more warming as the extra water vapor absorbs more energy and
accelerates warming.  However, if this extra water vapor shows up as
clouds, the cloud cover will tend to reflect energy back into space and retard
temperature growth. 

Which will happen?  Well, nobody knows.  The IPCC4 report admits
to not even knowing the sign of water's impact (e.g whether water is a
net positive or negative feedback) in these processes.  And this is just
one example of the many, many feedback loops that scientists are able to posit
but not prove. And climate scientists are coming up with numerous other
positive feedback loops.  As
one author put it
:

Regardless, climate models are made interesting by
the inclusion of "positive feedbacks" (multiplier effects) so that a
small temperature increment expected from increasing atmospheric carbon dioxide
invokes large increases in water vapor, which seem to produce exponential
rather than logarithmic temperature response in the models. It appears to have
become something of a game to see who can add in the most creative feedback
mechanisms to produce the scariest warming scenarios from their models but
there remains no evidence the planet includes any such effects or behaves in a
similar manner.

Note that the majority of the warming in these models appears to be from
these feedback processes.  Though it is hard to pick it out exactly,
section 8.6 of the fourth IPCC report seems to imply these positive feedback
processes increase temperature 2 degrees for every one degree from CO2.
This explains how these models get from a sensitivity of CO2 alone of about 1.0
to 1.5 degrees to a sensitivity of 3.5 or more degrees "“ it's all in the
positive feedback.

So, is it reasonable to assume these feedback loops?
First, none have really been proven empirically, which does not of course
necessarily make them wrong. .  In our daily lives, we generally deal
with negative feedback:  inertia, wind resistance, friction are all negative
feedback processes.  If one knew nothing else, and had to guess if a
natural process was governed by negative or positive feedback, Occam's razor
would say bet on negative.   Also, we will observe in the next
section that when the models with these feedbacks were first run against
history, they produced far more warming than we have actually seen (remember
the analysis we started this section with "“ post-industrial warming implies
1-1.5 degrees sensitivity, not four).

Perhaps most damning is to ask, if this really is such a heavily positive
feedback process, what stops it?  Remember the chart from earlier (show
again at the right), showing the long-term relationship of CO2 and
warming.  Also remember that the data shows, and even AGW supporters
acknowledge, that temperature rises led CO2 rises by about 800 years.
Their explanation is that "something" caused the temperature to start
upwards.  This higher temperature, as it warmed the oceans, caused CO2 to
outgas from the oceans to the atmosphere.  Then, this new CO2 caused the
warming to increase further.  In other words, outgassing CO2 from the
oceans was a positive feedback to the initial temperature perturbation.
In turn, the IPCC argues there are various other positive feedbacks that
multiply the effect of the additional warming from the CO2.  This is
positive feedback layered on positive feedback.  It would be like barely
touching the accelerator and having the car start speeding out o f control.

So the question is, if global temperature is built on top of so many positive
feedbacks and multipliers, what stops temperature form rising once it
starts?  Why didn't the Earth become Venus in any of these events?
Because, for whatever else it means, the chart above is strong evidence that
temperature does not run away. 

I have seen two suggestions, neither of which is compelling.  The first
is that the oceans ran out of CO2 at some point.  But that makes no
sense.  We know that the oceans have far more CO2 than could ever be
liberated entirely to the atmosphere today, and besides,  the record above
seems to claim that CO2 in the atmosphere never really got above there it was
say in 1880.

The second suggestion is based on the diminishing return relationship of CO2
to temperature.  At some point, as I have emphasized many times, CO2's
ability to absorb infrared energy is saturated, and incremental quantities have
little effect.  But note in the IPCC chart above, CO2 on the long time
scale never gets as high as it is today.  If you argue that CO2's
absorption ability was saturated in earlier events, then you have to argue that
it is saturated today, and that incremental CO2 will have no further warming
effect, which AGW supporters are certainly NOT arguing.  Any theory based
on some unknown negative feedback has to deal with the same problem:  If
one argues that this negative feedback took over at the temperature peaks (in
black) doesn't one also have to argue that it should be taking over now at our
current temperature peak?  The pro-AGW argument seems to depend on an assumption
of negative feedbacks in the past that for some reason can't be expected to
operate now or in the future.  Why?

In fact, we really have not seen any evidence historically of these positive
feedback multipliers.  As I demonstrated at the beginning of this chapter,
even assigning as much as 0.5C of the 20th century temperature
increase to CO2 only implies a sensitivity just over 1.0, which is about what
we would expect from CO2 alone with no feedbacks.  This is at the heart of
problems with AGW theory "“ There is no evidence that climate sensitivity to CO2
is anywhere near large enough to justify the scary scenarios spun by AGW
supporters nor to justify the draconian abatement policies they advocate.

My tendency is to conclude that in fact, positive feedbacks do not dominate
climate, just as they do not dominate any long-term stable system.  Yes,
certain effects can reasonably be said to amplify warming (ice albedo is
probably one of them) but there must exist negative feedbacks that tend to damp
out temperature movements.  Climate models will never be credible, and
will always overshoot, until they start building in these offsetting forcings.

Climate Models had
to be aggressively tweaked to match history

A funny thing happened when they first started running climate
models with high CO2 sensitivities in them against history:  The models
grossly over-predicted historic warming.  Again, remember our previous
analysis "“ historical warming implies a climate sensitivity between 1 and
1.5.  It is hard to make a model based on a 3.5 or higher sensitivity fit
that history.  So it is no surprise that one can see in the IPCC chart
below that the main model cases are already diverging in the first five years
of the forecast period from reality, just like the Superbowl predictors of the
stock market failed four years in a row.  If the models are already high
by 0.05 degree after five years, how much will they overshoot reality over 100
years?

In a large sense, this is why the global climate community has latched onto
the global dimming / aerosols hypothesis so quickly and so strongly.  The
possible presence of a man-made cooling element in the last half of the 20th
century, even one that the IPCC fourth report ranks our understanding of as
"low," gives modelers a valuable way to explain why their models are
overstating history.  The aerosols hypothesis is valuable for two reasons:

· Since
SO2 is prevalent today, but is expected to go down in the future, it allows
modelers to forecast much higher warming and climate sensitivity in the future
than has been observed in the past.

· Our
very lack of understanding of the amount, if any, of such aerosol cooling is
actually an advantage, because it allows modelers to set the value of such
cooling at whatever value they need to make their models work

I know the last statement seems unfair, but in reading the IPCC and other
reports, it appears to me that aerosol cooling values are set in exactly this
way "“ as what we used to call a "plug" figure between actual temperatures and
model output.  While this may seem a chancy and fairly circular reasoning,
it makes sense for scientists because they trust their models.  They
really believe the outputs are correct, such that any deviation is not
attributed to their assumptions about CO2 or climate sensitivity, but to other
man-made effects.

But sulfates are not the only plug being used to try to make high
sensitivity models match a lower sensitivity past.  You can see this in
the diagram below from the fourth IPCC report.  This is their summary of
how their refined and tweaked models match history. 


The blue band is without anthropogenic effects.
The pink band is with anthropogenic effects, including warming CO2 and cooling
aerosols.  The black line is measured temperatures (smoothed out of
course).


You can see the pink band which represents the models with anthropogenic
effects really seems to be a lovely fit, which should make us all
nervous.  Climate is way too chaotic a beast to be able to model this
tightly.   In fact, given uncertainties and error bars on our
historical temperature measurements, climate scientists are probably trumpeting
a perfect fit here to the wrong data.  I am reminded again of a beautiful
model for presidential election results with a perfect multi-decadal fit based
on the outcome of NFL football games. 

But ignoring this suspiciously nice fit, take a look at the blue bar.
This is what the IPCC models think the climate would be doing without
anthropogenic effects (both warming CO2 and cooling sulfates, for
example).  With the peaked shape (which should actually be even more
pronounced if they had followed the mid-century temperature peak to its max)
they are saying there is some natural effect that is warming things until 1950
and then turns off and starts cooling, coincidently in the exact same year
that anthropogenic effects start taking off. 
I challenge you to read
the IPCC assessment, all thousand or so pages, and find anywhere in that paper
where someone dares to say exactly what this natural effect was, or why it
turned off exactly in 1950. 

The reality is that this natural effect is another plug.  There is no
actual empirical data to back up the blue line (in fact, as we will see in the
alternate theories section, there is good empirical data that this blue band is
wrong).  Basically, climate scientists ran their models against history,
and found that even with their SO2 plug, they still didn't match well "“ they
were underestimating early century warming and over-estimating late century
warming.  Remember that the scientists believe their models and their
assumptions about a strong CO2 effect, so they have modeled the non-anthropogenic
effect by running their models, tuning them to historical actuals, and then
backing out the anthropogenic forcings to see what is left.  What is left,
the plug figure, is the blue line.

Already, the models used by the IPCC tend to overestimate past warming even
if all past warming is attributable to anthropogenic causes.  If
anthropogenic effects explain only a fraction of past warming, then the current
models are vastly overstated, good for stampeding the populous into otherwise
unpopular political control over the economy, but of diminished scientific
value.

The note I will leave you with is this:  Do not gain false confidence
in the global climate models when they show you charts that their outputs run
backwards closely match history.  This is an entirely circular argument,
because the models have been built, indeed forced, to match history, with
substantial plug figures added like SO2 effects and non-anthropogenic climate
trends, effects for which there are no empirical numbers.

The table of contents for the rest of this paper, . 4A Layman's Guide to Anthropogenic Global Warming (AGW) is here Free pdf of this Climate Skepticism paper is here and print version is sold at cost here

The open comment thread for this paper can be found here. 

Chapter 6: Alternate Explanations of Warming (Skeptics Guide to Global Warming)

The table of contents for the rest of this paper, . 4A Layman's Guide to Anthropogenic Global Warming (AGW) is here Free pdf of this Climate Skepticism paper is here and print version is sold at cost here

Solar Irradiance

If you walked into a room and found that it was too hot,
would you, as a first step:

  1. Measure the air to find anomalies in the mix of gasses
  2. Count the number of people in the room, to assess the effect
         of body heat on the room's temperature
  3. Check the thermostat on the furnace

If you answered #3, sorry, but you can't join the
IPCC.  If you really want to irritate an AGW supporter, ask about the
sun.  To AGW supporters, only a Luddite would check the sun's output when
they could instead be obsessing over the increase in CO2 by 0.009% of the
atmosphere.

When they looked at the problem, the IPCC decided that over
the last 50 years, the sun has been irrelevant to warming.  Note that the
blue band in this chart (described in more detail in the last section), the
IPCC thinks that without man, the world would have cooled over the last 50
years:

Further, when they detailed different climate forcings, the
forcing from changing solar irradiance was a trivial rounding error (though
they had the good grace to mark their understanding of this as "low") meaning
the sun has very little effect vs. what the sun had in 1850 (in the Little Ice
Age!)


But it turns out, interestingly, that solar irradiance may be close to its
highest point in centuries.  Al Gore says that current global temperatures
are the highest they have been in 1000 years.  A new study by
the Institute of Astronomy in Zurich says that the "sun is more active now
than it has been at anytime in the previous 1,000 years."  Related?

Sunspots have been monitored on the Sun since 1610,
shortly after the invention of the telescope. They provide the longest-running direct
measurement of our star's activity.

The variation in sunspot numbers has revealed the
Sun's 11-year cycle of activity as well as other, longer-term changes.

In particular, it has been noted that between about
1645 and 1715, few sunspots were seen on the Sun's surface.

This period is called the Maunder Minimum after the
English astronomer who studied it.

It coincided with a spell of prolonged cold weather
often referred to as the "Little Ice Age". Solar scientists strongly
suspect there is a link between the two events - but the exact mechanism
remains elusive....

But the most striking feature, he says, is that
looking at the past 1,150 years the Sun has never been as active as it has been
during the past 60 years.

Over the past few hundred years, there has been a
steady increase in the numbers of sunspots, a trend that has accelerated in the
past century, just at the time when the Earth has been getting warmer.

The data suggests that changing solar activity is
influencing in some way the global climate causing the world to get warmer.

We can look at solar output over large time frames by
looking at the production of carbon-14 (less is produced in years of high solar
activity, and vice versa).  The analysis below used the ratio of oxygen
isotopes in the stalagmites to estimate the water temperature at the time they
were formed.  The result is an interesting correlation between solar
activity and a global temperature proxy over a long time-scale (Graph from Neff et al., 2001):

Over the last 1000 years, we see that (again using a
reversed scale of C14 as a proxy) solar activity is highly correlated with long
term temperature trends (I have used the pre-Mann chart, because while it may
over-emphasize the Medieval Warm Period, I still think such a period existed).

               
Solar Output
Anomaly   
                                                                  

              Temperature Anomaly

  1000yearold

Look at the following reconstruction data by Judith Lean of
the Naval Research Library and charted from her data at NOAA by Junkscience.com
shows that interestingly, the sun's output does appear to be higher today than
they have been in many, perhaps hundreds of years

Irradiance

Would such increased activity be expected to result in
higher Earth temperatures?  I don't know, and there are some issues one
has to be careful with on this chart.  Most importantly the scaling:
While the shape of the curve looks a lot like the temperature trend over the
last 400 years, note that the entire variation from the low to the high point
is only about 0.25% "“ the scaling makes it look more dramatic.  Of course,
the same could be said for global temperature, where a half degree C
temperature increase on an absolute Kelvin scale would only be about 0.17%, so
an argument can be made that on a percentage basis, this change in irradiance
is about the same order of magnitude as our change in temperature.  A more
sophisticated comparison might say that since black body radiation is related
to absolute temperature to the fourth power, .25% increase in irradiance would
be expected to heat the Earth by .06%.

The chart on the above left compares the recent temperature
anomaly to solar irradiance, while the chart on the right compares it to CO2
concentrations.  Neither is a beautiful fit (and one may have to include
aerosols in either scenario to account for 1970's cooling) but solar irradiance
seems at least as good as that of CO2.  Remember, the IPCC shows
the world cooling due to solar effects during the same time the red solar
irradiance line is peaking. 

Recently Alexander et. al. in have done some very comprehensive
work relating solar irradiance and rainfall.  The study posits that one of
the reasons for less than perfect fit of sunspot and irradiance data with
temperature is that the Sun actually works on a 21 year cycle when the sunspot
cycle is combined with the cyclical wobble of the Suns motion through
space.  The study concluded:

The
Intergovernmental Panel on Climate Change (IPCC) (2001) dismisses the view that
solar activity has a meaningful influence on global climate. The basis for this
view is that variations in the receipt of solar activity are too small to
account for variations in the climatic responses. These variations were
determined from satellite and other observations. What the IPCC scientists
failed to appreciate is that changes in the level of solar radiation received
on earth are amenable to precise calculation. The variations are well in excess
of the IPCC value of +0,3 Wm
"“2 quoted earlier.

One of the interesting things about solar output is that, if
it is really higher, we should see effects on other planets, not just on
Earth.  And, in fact, a lot of evidence has been pouring in over the last
5 years from astronomers (not climate guys) that the rest of the solar system
has been warming dramatically.

Take
Mars
, for example.  Mar's ice caps have been melting and diminishing
since NASA's Mars Global Surveyor and Odyssey started to measure them around
2002. 

Changes in the red spot on Jupiter
seem to be a sign of warming temperatures.  And Neptunes moon Triton is
warming.  We have to be careful with how we draw conclusions on these
outer planets, since their "year" is so long, seasonal changes can last
decades. 

And
on Neptune:

As seen in Figure 1, Neptune has been getting
brighter since around 1980; furthermore, infrared measurements of the planet
since 1980 show that the planet has been warming steadily from 1980 to 2004. As
they say on Neptune, global warming has become an inconvenient truth. But with
no one to blame, Hammel and Lockwood explored how variations in the output of
the Sun might control variations in the brightness of Neptune.


Figure 1 (a) represents the corrected visible light from Neptune from 1950 to
2006; (b) shows the temperature anomalies of the Earth; (c) shows the total
solar irradiance as a percent variation by year; (d) shows the ultraviolet emission
from the Sun (Source: Hammel and Lockwood (2007)).

What would seem so simple statistically is
complicated by the degrees of freedom in the various time series which is
related to the serial correlation in the data (e.g., next year's value is
highly dependent on this year's value). Nonetheless, they find that the
correlation coefficient between solar irradiance and Neptune's brightness is
near 0.90 (1.00 is perfect). The same relationship is found between the Earth's
temperature anomalies and the solar output. Hammel and Lockwood note "In other
words, the Earth temperature values are as well correlated with solar
irradiance (r = 0.89) as they are with Neptune's blue brightness (|r| >
0.90), assuming a 10-year lag of the Neptune values." The temporal lag is
needed to account for the large mass of Neptune that would require years to
adjust to any changes in solar output.

Hammel and Lockwood conclude that "In summary, if
Neptune's atmosphere is indeed responding to some variation in solar activity
in a manner similar to that of the Earth albeit with a temporal lag" then
"Neptune may provide an independent (and extraterrestrial) locale for studies
of solar effects on planetary atmospheres."

More on the sun's
variance and climate change here
.

Cosmic Rays

One of the problems with irradiance as a driver for climate
change is that though the changes seem to be fairly well correlated with the
temperature anomaly, many scientists think the magnitude is too small to
totally account for temperature changes.  It is ironic that AGW supporters
use this as a refutation of the sun's effect, since they have exactly the same
problem with CO2, and must posit huge positive feedback loops to justify their
forecasts. 

A second, newer theory has emerged as to a potential second
warming effect of solar output.  To understand it, we have to start with
clouds.  For those that don't live in a hot climate like I do here in
Phoenix, I will give everyone a bit of background "“ clouds cool things
off.  Ok, as with everything in climate, things are actually far more
complicated "“ high clouds can sometimes cause warming, and nighttime clouds can
actually slow cooling.  Never-the-less, in general, cloudcover cools things
off by blocking out and reflecting the sun's energy.

Clouds are in fact such a strong cooling force that is has
been estimated by several sources (Theodor Landscheidt, 1998) that having
clouds cover 1% more of the Earth's surface would cancel the heating effect of
a doubling of CO2.   In fact, it was one of my criticisms earlier
that AGW theory seems overly intent on finding positive feedback loops, while
not considering negative feedbacks seriously enough "“ one such potential
negative feedback is that on a warmer Earth, more water is evaporated into
clouds, in turn cooling things back off.

But recently, an interesting new theory on cloud formation
has emerged.  In short, it holds that cosmic rays, which are the high
energy particles that arrive at Earth from supernovas, spur cloud formation by
ionizing air molecules that act as seeds for water condensation and cloud
formation.  This sounds wild, but really no wilder than warming by a gas
(CO2) that makes up a near trivial portion of the atmosphere.  Like CO2 warming,
this effect has been observed in various laboratory chambers.  But is it
really a measurable driver of climate?

Henrik
Svensmark and Eigil Fris-Christensen
looked at historic data on cloud cover
and cosmic ray incidence, from various measuring points.  Their data was
extended and refined by Shiva in 2005.

Cosmic rays
vs. CO2 detailed

So what changes cosmic ray flux to the Earth?  The
biggest influence is the sun.  When the sun's output is high, cosmic rays are
prevented from hitting the Earth, and vice versa.  So high solar activity
corresponds to low cosmic ray flux and therefore lower cloud formation and
higher temperatures. 

While the link between solar irradiance levels and warming
is pretty straight forward, the cosmic ray cloud formation proposition is still
in its infancy.  Those of us who criticize AGW supporters for running past
the evidence on CO2 should not make the same mistake on cosmic rays, and movies
such as The Global Warming Swindle have gone too far in portraying this
alternate theory as fact.

Man's Land Use

Recently, Roger Pielke has done a substantial amount of
research on a different type of anthropogenic forcing.  Specifically, he
has hypothesized that man's changing patterns of land use can be a substantial
driver of regional climate, including temperature and even more particularly,
precipitation.   For example, clearing relatively dry land and
replacing it with irrigated agriculture substantially changes to the local heat
balance,  not the least by increasing humidity.  Dr. Pielke explains
summarizes the consequences on his web site:

Humans are significantly altering
the global climate, but in a variety of diverse ways beyond the radiative
effect of carbon dioxide. The IPCC assessments have been too conservative in
recognizing the importance of these human climate forcings as they alter
regional and global climate. These assessments have also not communicated the
inability of the models to accurately forecast the spread of possibilities of
future climate. The forecasts, therefore, do not provide any skill in
quantifying the impact of different mitigation strategies on the actual climate
response
that would occur.

The table of contents for the rest of this paper, . 4A Layman's Guide to Anthropogenic Global Warming (AGW) is here Free pdf of this Climate Skepticism paper is here and print version is sold at cost here

The open comment thread for this paper can be found here. 

Chapter 7: The Effects of Global Warming (Skeptics Guide to Global Warming)

The table of contents for the rest of this paper, . 4A Layman's Guide to Anthropogenic Global Warming (AGW) is here Free pdf of this Climate Skepticism paper is here and print version is sold at cost here

There is no area in global warming discussions where AGW
advocates have done more to shoot down their own credibility than in the
absolutely egregious science and absurd claims that have been made about the
potential negative effects of global warming.  If AGW advocates are frustrated
that skeptics question their science and their credibility, they need to look
no further than their own claims on global warming effects, which are so easy
to prove wrong that it causes people like me to question everything else they
say.

Why only bad stuff?

Whenever global warming is discussed in the press, the
consequences are all universally bad.  Floods, famine, drought,
pestilence, disease "“ they are all commonly predicted results of global
warming.  But it is worth noting that in the 1970's, when climate
scientists and the press were in a panic over global cooling, the predicted
results were"¦ floods, famine, drought, pestilence, disease.  The
implication is that we currently happen to be balanced on the knife edge of
exactly the optimum world temperature for mankind.  Any change warmer or
cooler results in net negative consequences.

This, of course, seems an odd coincidence.  Since man
evolved into homo sapiens, he has experienced a wide range of cooler and
warmer temperatures than we experience today.  It seems frankly amazing
that in the mid 20th century we happened to be sitting at the
absolute ideal temperature for modern technological society and
agriculture.  Now, I guess you can argue that our society has made
enormous investments based on the locations of the best crop lands, the height
of the oceans, the typical paths of storms, etc., and that shifts in any of
these would force an expensive restructuring of these investments.
However, it is also worth noting that from the bottom of the Little Ice Age to
say 1980, the world warmed at least a degree, and no one really
noticed!  Everyone was still talking about cooling!

So I think that any honest analysis of the effects of global
warming would have to acknowledge that there are likely both positive and
negative effects.  While some areas may experience heat-induced droughts,
other will be wetter as more moisture from the oceans is evaporated.
While some crops will struggle, others, particularly in northern latitudes, will
thrive due to longer growing seasons.  For each crop of vegetables that
wilt in a heat wave there will be a crop of citrus that didn't freeze.
While more may die from the heat, fewer will die from the cold.  These may
still net to a negative sum, but that net sum will be substantially less
negative than a one-sided look at only the downsides of warming would arrive
at.

One reason that warming impact analysis is hard is because while we may talk
about the world warming a degree or two, the world does not warm evenly.
Most climate models show the most warming on dry winter nights  (Siberian
winters, for example, get a disproportionate share of the warming).  An
extra summer degree in Arizona would suck; an extra winter degree in Siberia
would probably be welcomed, and would likely extend growing seasons.

In the rest of this chapter, I will spend some time with a number of the
most common "scary results" from global warming.

Ice melting / ocean rising 

In An Inconvenient Truth, Al Gore claims that oceans will
rise twenty feet due to global warming.  Helpfully, a number of websites
have been created to show what parts of the world (including much of Florida)
would sink beneath the oceans like Atlantis with a 20-foot rise in sea level.

Fortunately, even most AGW supporters believe that Gore is
wildly exaggerating, at least for any time period less than a couple of
centuries.  The Fourth IPCC report (see chart below) predicts sea level
rise by the year 2100 of "¦ 12-15 inches.  And remember that this is based
on forecasts of both CO2 production and climate sensitivity to CO2 that are
arguably high by a factor of two or more.  From the fourth IPCC report
(different columns are for different starting CO2 forecasts):

By the way, to give a sense of scale, the IPCC estimates
that the oceans have already risen about 0.2 meters in the last 130 years or
so:

One other interesting thing you can see from the sea level
forecast chart is that even the IPCC considers ice melting virtually
irrelevant.  That is because most of the surface level increase is from
thermal expansion of the water as the oceans warm.  In the A1B case, for
example, net worldwide ice melt raises oceans by about 4 inches in the next
hundred years. 

This last conclusion may seem crazy to anyone who has
watched the media of late or seen Mr. Gore's movie.  Images of ice
crashing into the ocean and sea ice retreating are common fodder for global
warming visuals.  But the fact is that ice, like everything else in
climate, is complicated.

  • North Pole:  Arctic sea ice melting is totally
         irrelevant to ocean surface levels.  Since the ice floats, even a
         100% melting of the Arctic ice will not change sea level one bit, just as
         ice melting in your glass of water does not cause your glass to
         overflow. 

But some may argue that this ducks the
question.  Does current, well-documented retreat of artic ice sheets
provide independent confirmation of the magnitude of AGW?  In fact, though
ice sheets are retreating, this seems to be part of a two hundred year trend
that began long before man was burning fossil fuels in any quantity:

  • Alpine Glaciers:  We know that many Alpine
         glaciers around the world are retreating.  Some of this is surely
         from global warming, but some is also from fluctuations in
         precipitation.  In many cases, we have documented evidence that these
         glaciers have been retreating since the 19th century, and that
         they have been less extensive in the past.

Reid A. Bryson is Emeritus Professor and founding
chairman of the University of Wisconsin Department of Meteorology"”now the
Department of Oceanic and Atmospheric Sciences and a member of the United
Nations Global 500 Roll of Honor.  When asked about
the retreat of Alpine glaciers
, he says, "What do they find when the ice
sheets retreat, in the Alps?  A silver mine! The guys had stacked up their
tools because they were going to be back the next spring to mine more silver,
only the snow never went," he says. "There used to be less ice than now. It's
just getting back to normal."

Alaska Geographic published a chart of the retreat
of the glaciers at Glacier Bay, Alaska, showing most of the retreat occurred before
the 2nd half of the 20th century:

One special note should be made of the glaciers on
Kilimanjaro, because their retreat over the last 125 years has been
well-documented and played a starring role in An Inconvenient Truth.  Analysis
has shown that most the glacial retreat at Kilimanjaro occurred before 1953
(and therefore before most recent warming) and that the retreat has
more to do with moisture in the air than with global warming
.  One
wonders why the movie, with glacial retreats around the world that are provably
due to warming, would focus on one that is probably not due to warming.

· Greenland: 
Greenland has a lot of ice, and there is not much doubt that if it all melted,
the oceans would rise a lot.  However, we know that in the middle ages,
Greenland was much warmer and had less extensive ice coverage (thus the name
Greenland and the successful attempt to farm it for over a century)

While there is a lot of discussion about whether
the Medieval Warm Period extended worldwide, most accept that it did cover the
North Atlantic, including Greenland.  Boreholes, such as the Dahl-Jensen
below, seem to prove out our historical information, showing a temperature peak
around the year 1000.

· Antarctica:
Something like 80-85% of the world's ice is in Antarctica.  And no one
really thinks it is melting or going to melt.  In fact, if you look at the
marks on the IPCC chart above for the contribution of Antarctic ice to ocean
levels, it has a net negative impact, which means the IPCC actually expects the
Antarctic ice sheet to grow, not melt.

Whoa, that can't be right!  Mr. Gore showed those videos of ice retreating
in Antarctica.  Well, yes, sort of.  Scientists expect that global
warming will make the sea currents that circle Antarctica a bit warmer, leading
to more precipitation and more snowfall on the continent.  Besides,
Antarctica is so damn cold that raising temperatures a few degrees is not going
to melt anything. 

The one exception is the Antarctic Peninsula, which
sticks out into the warmer oceans.  This land area, representing about 2%
of the Antarctic land mass and even less of its total ice sheet, is expected to
warm and lose ice while the other 98% gains ice.

Guess what?  Mr. Gore chose that little 2% to
illustrate his movie.  Was he ignorant of the choice he was making, or did
he know exactly what he was doing, telling the literal truth (that the
peninsula is melting) but leading viewers to the wrong conclusion overall about
Antarctic ice?

By the way, one last interesting
fact that frankly, scientists don't fully understand is the fact that the South
Pole is really not experiencing any warming.  While the warming at the
north pole exceeds the global average, the south pole shows little or no
anomaly.


Hurricanes & Tornados

Alter Hurricane Katrina, the media storyline focused
strongly on the role global warming may have played in increasing hurricane
power and activity.  Lost in the rush to blame global warming was the fact
that Katrina, when it made landfall, was not even a category 5 hurricane, and
its devastation was due more to  a city sited below sea-level that did a
poor job of managing its storm protection.

In fact, many hurricane experts do not agree with the argument
that warming oceans can lead to more and stronger hurricanes.  In fact,
hurricane activity is more related to the difference in temperatures between
the cold and warmer waters, a difference AGW theory says should decrease rather
than increase.  So is there reason to believe hurricanes are on the rise
as global temperatures warm?  The answer, as shown below, seems to be no:

But what about storm damage?  It certainly seems like
recent hurricanes have resulted in far more economic damage.  And they
have, but for the simple reason that over the last several decades, Americans
have put billions of dollars of expensive homes and other facilities in
vulnerable Gulf and Atlantic coast locations.   Several years ago, Dr. RA Pielke and CW Landsea
(that can't really be the name of a scientist studying coastal strikes by
hurricanes) attempted to correct hurricane damage numbers for the density and
value of coastal real estate:

By this reckoning, it is hard to see any trend.

Another claim Mr. Gore makes in An Inconvenient Truth
is that 2004 was the most active year for tornadoes ever in the United States,
and that there has been a steady trend in increasing tornados as the globe has
warmed.

And certainly if you look at the raw numbers, you might be
worried:

But there is a little something Mr. Gore fails to
mention.  During this time period, from 1950 to 2000, the technology and
network for detecting tornados has improved vastly.  From the NOAA

With increased national doppler
radar coverage, increasing population, and greater attention to tornado
reporting, there has been an increase in the number of tornado reports over the
past several decades. This can create a misleading appearance of an increasing
trend in tornado frequency. To better understand the true variability and trend
in tornado frequency in the US, the total number of strong to violent tornadoes
(F3 to F5 category on the Fujita scale) can be analyzed. These are the
tornadoes that would have likely been reported even during the decades before
Dopplar radar use became widespread and practices resulted in increasing
tornado reports. The bar chart below indicates there has been little trend in
the strongest tornadoes over the past 55 years.

Oops!  In fact, tornado frequency seems to be falling
as temperatures warm.  Do you think this was another honest mistake, like
with Antarctica, or did Mr. Gore purposefully obfuscate the real story?

Temperature Extremes

Another argument is that global warming will lead to more temperature
extremes, particularly record sweltering highs.  That seems logical
enough, but Bruce Hall actually
compiled the data and found something interesting.  He created a data base
for each state which shows in what year that state's monthly temperature
records were set.   So for each state, he has the years when the
twelve monthly high temperature records were set (e.g. year of highest Arizona
Jan temp, year of highest Arizona Feb temp, etc.) and the years when the twelve
monthly low temperature records were set.  Here, for example, is his data
for Arizona:

Extremetempsarizona

So, for example, the record for the highest July temperature was set in 1905
at Parker, Arizona with a scorching 127 degrees.  The entry in his
database would then be Arizona-July:  1905.  He notes that there is a
bias in the data toward more recent years, since if the record was set in 1905
and tied in 1983, only the newer 1983 date will show in the data.  I would
also observe that this data is uncorrected for urban heat island effects (as
cities urbanize they get hotter, and effect that is different than CO2-cause global
warming and is usually corrected for in global warming studies).  There is
also a bias towards the present in having more measurement points today than
100 years ago:  More measurement points means that, over a state, one is
more likely to pick up the true high (or low).

Though I have
other problems with the anthropogenic global warming hypothesis
, I have
never really doubted that the world has warmed up over the last century.
So even I, a skeptic, would expect a disproportionate number of the all-time
high temperatures to be in the last decade, particularly without UHI correction
and with the bias discussed above.  The global warming folks would argue
that the effect should be doubly pronounced, since they claim that we are
seeing not just a general heating, but an increase in volatility (ie more
extreme variation around the mean).

But Hall doesn't find this when he graphs the data.
Take the 600 state monthly high temperature records that exist on the books
today (50 states times 12 months) and graph the distribution of years in which
these records were set:

Assuming about 120 years of data, you should expect to see a high
temperature record on average in a database of 600 records at 5 per year, which
is precisely where we have been of late and well below the record years in the
thirties (remember the dust bowl?) and the fifties. It seems to actually show a
reduction in temperatures or volatility or both.

This may seem impossible "“ how can the mean increase without causing a lot
more new highs?  But remember what we discussed earlier "“ global warming
is expected to be seen disproportionately in nighttime and winter
temperatures.  This means that the mean can increase even as daytime
summer highs don't increase much.  In a sense, is the lows, not the highs,
that are getting higher.

Vincent et al in 2005 did a study of temperature trends in South America
from 1960-2000.  What they observed is exactly what we discussed
here:  The number of warm days and cold days did not really change.
The warming trend showed up as a decrease in cold nights and an increase in
warm nights, meaning effectively that the diurnal (across 24 hours) temperature
variation is narrowed. 

It's a little hard to be scared by this.

Extinction and Disease

Biologist Josef Reichholf was
interviewed recently in der
Spiegel
.  He is a strong conservationist, and certainly has his axe to
grind with industrial society.  In fact he blames industrial agriculture
and modern development for problems that species face. 

Many species are certainly
threatened, but not by climate change"¦.Many species have already fled from the
countryside to the cities, which have been transformed into havens of
biodiversity. We are also seeing another interesting phenomenon: Major cities,
like Hamburg, Berlin and Munich, have formed heat islands where the climate has
been two or three degrees warmer than in the surrounding countryside for
decades. If higher temperatures are truly so bad, why do more and more animals
and plants feel so comfortable in our cities?

On the contrary, there is much to
be said for the argument that warming temperatures promote biodiversity. There
is a clear relationship between biodiversity and temperature. The number of
species increases exponentially from the regions near the poles across the
moderate latitudes and to the equator. To put it succinctly, the warmer a
region is, the more diverse are its species.

OK, but what about those polar bears?  We have all seen
the media pictures of bears stranded on blocks of ice, as if all the arctic has
melted out from under them.  Well, it turns out that polar bears have
survived much warmer conditions.  We know polar bears existed as a
separate species at least 125,000 years ago, and in the intervening years,
there have been periods where Arctic sea ice melted completely during the
summer months.  And yet polar bears still exist today.  Polar bears
may be threatened by man's hunting and encroachment on its hunting grounds, but
not likely by our fossil fuel combustion.

AGW fear-mongering also extends to breathless predictions of
increases in "tropical" diseases.  Reichholf also takes on this canard:

Many people truly believe that
malaria will spread as temperatures rise. But malaria isn't even a true
tropical disease. In the 19th century, thousands of people in Europe, including
Germany, the Netherlands and even Scandinavia, died of malaria, even though
they had never gone abroad. That's because this disease was still prevalent in
northern and central Europe in previous centuries. We only managed to eliminate
malaria in Europe by quarantining the sick, improving hygiene and draining
swamps. That's why I consider it virtually impossible that malaria would return
to us purely because of climate change. If it does appear, it'll be because it
has been brought in somewhere.

Most of the world's leading tropical disease experts tend to
agree with Reichholf.  In fact, I would argue that diseases like Malaria
are not diseases of the tropics but diseases of poverty and
under-development.  Malaria is prevalent in Africa not because Africa is
hot but because Africa is poor.  Asian tropical countries that have developed
substantially over the last several decades have also greatly reduced
malaria.  In fact, as I will discuss in later sections, by reducing world
economic growth and slowing development in the third world in the name of CO2
reduction, we will actually increase rather than reduce these diseases.

Collapse of the Gulf Stream and Freezing of Europe

One of the recent hysteria's has been that global warming
will cause the Gulf Stream to collapse as Atlantic circulation patterns are
radically altered, thus leading to the freezing of Europe.  More sober
scientists have since essentially said "nevermind."  The Gulf Stream and
Atlantic circulation patterns are far more robust than this theory assumed,
and, even if the Gulf Stream changes, proponents of the theory were
overestimating the dependence of Europe on Gulf Stream warming.

Non-warming Effects of CO2

Interestingly, we may eventually decide that other
non-climate effects of CO2 production actually present more tangible
environmental threats.  In particular, recent studies have shown that more
atmospheric CO2 is causing the PH of ocean surface layers to drop (ie become
more acidic) leading potentially to coral kills and substantial changes in sea
life.  At the same time, physicist Freeman Dyson argues that stratospheric
cooling from man-made CO2 is much more a problem than surface warming, and is
much more measurable and provable.  These topics are beyond my scope at
this point, but something we may see more of in the future.

The table of contents for the rest of this paper, . 4A Layman's Guide to Anthropogenic Global Warming (AGW) is here Free pdf of this Climate Skepticism paper is here and print version is sold at cost here

The open comment thread for this paper can be found here. 

Chapter 8: Kyoto and Policy Alternatives (Skeptics Guide to Global Warming)

The table of contents for the rest of this paper, . 4A Layman's Guide to Anthropogenic Global Warming (AGW) is here Free pdf of this Climate Skepticism paper is here and print version is sold at cost here

Kyoto Treaty

In the mid-1990's, a number of western nations crafted a CO2-reduction
treated named Kyoto for the city in which the key conference was held.
The treaty called for signatory nations to roll back their CO2 emissions to
below 1990 levels by a target date of 2012.  Japan, Russia, and many
European nations signed the treaty; the United States did not.  In fact,
the pact was ratified by 141 nations, but only calls for CO2 limits in 35 of
these (so the other 106 were really going out on a limb signing it).
China, India, Brazil and most of the third world are exempt from its limits.

We will discuss the costs and benefits of CO2 reduction a bit later.
However, it is instructive to look at why Kyoto was crafted the way it was, and
why the United States refused to sign, even when Al Gore was vice-president.

The most obvious flaw is that the entire developing world, including China,
SE Asia, and India, are exempt. These countries account for 80% of the world's
population and the great majority of growth in CO2 emissions over the next few
decades, and they are not even included. If you doubt this at all, just look at
what the economic recovery in China over the past months has done to oil
prices. China's growth in
hydrocarbon consumption will skyrocket over the coming years
, and China is
predicted to have higher CO2 production than the United States by 2009.

The second major flaw with the treaty is that European nations cleverly
crafted the treaty so that the targets were relatively easy for them to make,
and very difficult for the United States to meet.  Rather than freezing
emissions at current levels at the time of the treaty, or limiting carbon
emission growth rates, the treaty called for emissions to be rolled back to
below 1990 levels. Why 1990? Well, a couple of important things have happened
since 1990, including:

a. European (and Japanese) economic growth has stagnated since 1990, while
the US economy has grown like crazy. By setting the target date back to 1990,
rather than just starting from day the treaty was signed, the treaty
effectively called for a roll-back of economic growth in the US that other
major world economies did not enjoy.

b. In 1990, Germany was reunified, and Germany inherited a whole country
full of polluting inefficient factories from the old Soviet days. Most of the
dirty and inefficient Soviet-era factories have been closed since 1990, giving
Germany an instant one-time leg up in meeting the treaty targets, but only if
the date was set back to 1990, rather than starting at the time of treaty
signing.

c. Since 1990, the British have had a similar effect from the closing of a
number of old dirty Midlands coal mines and switching fuels from very dirty
coal burned inefficiently to more modern gas and oil furnaces and nuclear
power.

d. Since 1990, the Russians have an even greater such effect, given low
economic growth and the closure of thousands of atrociously inefficient
communist-era industries.

It is flabbergasting that US representatives could allow the US to get so
thoroughly out-manuevered in these negotiations. Does anyone in the US really
want to roll back the economic gains of the nineties, while giving the rest of
the world a free pass? Anyway, as a result of these flaws, and again having
little to do with the global warming argument itself, the Senate
voted 95-0 in 1997 not to sign or ratify the treaty unless these flaws (which
still exist in the treaty) were fixed
.  Then-Vice-President Al Gore
agreed that the treaty should not be signed without modifications, which were
never made and which Europeans were never going to make.

By the way, enough time has elapsed that we have data on the
progress of various countries in meeting these targets.  And if you leave
out various accounting games with offsets of dubious value, most all the
European nations, despite all the advantages described above, are still missing
their targets.  The political will simply does not exist to hamstring
their economies to the extent necessary to roll back CO2 growth.  Actual
growth rates for CO2 emissions have been (source UN):


United States

Europea Union

1990-1995

6.4%

-2.2%

1996-2000

10.1%

2.2%

2001-2004

2.1%

4.5%

You can see that the Europeans positioned themselves well in
the 1990's to make their targets.  Realize that as the treaty was negotiated,
they already had a good idea of these numbers for 1990-1995 and even a few
years beyond.  They knew that by selecting a 1990 baseline, they were
already on target to meet the goals and the US would be far behind.
Again, realize that the 1990-2000 EU performance on CO2 production had nothing
to do with post-Kyoto regulatory responses and everything to do with the
economic fundamentals we outlined above that would have existed with or without
the treaty.

Since 2000, however, it has been a different story.
European emissions have increased as their economies have recovered, at the
same time the US experienced a post-9/11 slowdown.

By the way, the US is generally the great Satan in AGW
circles because its per capita CO2 production is the highest in the
world.  But this is in part because our economic output per capita is
close to the highest in the world.  The US is about in
the middle of the pack in efficiency
, though behind many European countries
which have much higher fuel taxes and heavier nuclear investments.

As an interesting side note, the US per capita CO2
emissions, as show below, have actually been flat to down since the early
1970's.  To the extent that Europe is doing better at CO2 reduction than
the US, it may actually be more of an artifact of their declining populations
vs. America's continued growth.

Finally, if you get really tired of the US-bashing, you can
take some comfort that though the US is the #1 per capita producer of CO2, of
which we are uncertain is even harmful, we have done a fabulous job reducing
many other pollutants we are much more certain are harmful.  For example,
the US has much lower SO2
production
than most European nations and the
water quality is better
.  One could argue that the US has spent its
abatement dollars on things that really matter.

Cost of the
Solutions vs. the Benefits:  Why Warmer but Richer may be Better than
Colder and Poorer

If you get beyond the hard core of near religious believers in the massive
warming scenarios, the average global warming supporter would answer this paper
by saying: "Yes there is a lot of uncertainty, but though the doomsday
warming scenarios via runaway positive feedback in the climate can't be proven,
they are so bad that we need to cut back on CO2 production just to be on the
safe side."

This would be a perfectly reasonable approach if cutting back on CO2
production was nearly cost-free.  But it is not.  The burning of
hydrocarbons that create CO2 is an entrenched part of our lives and our
economies. Forty years ago we might have had an easier time of it, as we were
on a path to dramatically cut back on CO2 production via what is still the only
viable technology to massively replace fossil fuel consumption -- nuclear
power.  Ironically, it was environmentalists that shut down this effort,
and power industries around the world replaced capacity that would have gone
nuclear mostly with coal, the worst fossil fuel in terms of CO2 production (per
BTU of power, Nuclear and hydrogen produce no CO2, natural gas produces some,
gasoline produces more, and coal produces the most).

Just halting CO2 production at current levels (not even rolling it back)
would knock several points off of world economic growth.  Every point of
economic growth you knock off guarantees you that you will get more poverty,
more disease, more early death.  If you could, politically, even make such
a freeze stick, you would lock China and India, nearly 2 billion people, into
continued poverty just when they were about to escape it.  You would in
the process make the world less secure, because growing wealth is always the
best way to maintain peace.  Right now, China can become wealthier from
peaceful internal growth than it can from trying to loot its neighbors.
But in a zero sum world created by a CO2 freeze, countries like China would
have much more incentive to create trouble outside its borders.  This
tradeoff is often referred to as a cooler but poorer world vs. a richer but
warmer world.  Its not at all clear which is better.
 

What impact, warming?

We've already discussed just how much the popular media has overblown the
effect of warming.  Sea levels may rise, but only by 15 inches in one
hundred years, and even that based on arguably over-inflated IPCC models.
There is no evidence that weather patterns will be more severe, or that
diseases will spread, or that species will be threatened by warming.  And,
since most of the warming has been and will be concentrated in winter and
nights, we will see rising temperatures more in a narrowing of temperature
variability rather than a drastic increase in summer high temperatures.
Growing seasons, in turn, will be longer and deaths from cold, which tend to
outnumber heat-related deaths, will decline. 

What impact, Intervention?

While the Kyoto treaty was a massively-flawed document, with current
technologies a Kyoto type cap and trade approach is about the only way we have
available to slow or halt CO2 emissions.  And, unlike the impact of
warming on the world, the impact of such a intervention is very well understood
by the world's economists and seldom in fact disputed by global warming
advocates.  Capping world CO2 production would by definition cap world
economic growth at the rate of energy efficiency growth, a number at least two
points below projected real economic growth.  In addition, investment
would shift from microprocessors and consumer products and new drug research
and even other types of pollution control to energy. The effects of two points
or more lower economic growth over 50-100 years can be devastating:

  • Remember the power of compounded growth rates we discussed earlier.  A world real economic growth rate of 4% yields income fifty times higher in a hundred years.  A world real economic growth rate two points lower yields income only 7 times higher in 100 years.  So a two point reduction in growth rates reduces incomes in 100 years by a factor of seven!  This is enormous.  It means, literally, that on average everyone in a cooler world would make 1/7 what they would make in a warmer world.
  • Currently, there are perhaps a billion people, mostly in Asia, poised to exit millennia of subsistence poverty and reach the middle class.  Global warming intervention will likely consign these folks to continued poverty.  Does anyone remember that old ethics problem, the one about having a button that every time you pushed it, you got a thousand dollars but someone in China died.  Global warming intervention strikes me as a similar issue - intellectuals in the west
         feel better about man being in harmony with the Earth but a billion Asians get locked into poverty.
  • Lower world economic growth will in turn considerably
    shorten the lives of billions of the world's poor
  • A poorer
    world is more vulnerable to natural disasters
    .  While AGW
    advocates worry (needlessly) about hurricanes and tornados in a warmer
    world, what we can be certain of is that these storms will be more devastating and kill more people in a poorer world than a richer one.
  • The unprecedented progress the world is experiencing in
    slowing birth rates, due entirely to rising wealth, will likely be
    reversed.  A cooler world will not only be poorer, but likely more populous as well.  It will also be a hungrier world, particularly if
    a cooler world does indeed result in lower food production than a warmer
    world
  • A transformation to a prosperous middle class in Asia will
    make the world a much safer and more stable place, particularly vs. a cooler world with a billion Asian poor people who know that their march to progress was halted by western meddling.
  • A cooler world would ironically likely be an
    environmentally messier world.  While anti-growth folks blame all
    environmental messes on progress, the fact is that environmental impact is
         a sort of inverted parabola when plotted against growth.  Early
    industrial growth tends to pollute things up, but further growth and
    wealth provides the resources and technology to clean things up.  The
         US was a cleaner place in 1970 than in 1900, and a cleaner place today
    than in 1970.  Stopping or drastically slowing worldwide growth would
    lock much of the developing world, countries like Brazil and China and
    Indonesia, into the top end of the parabola.  Is Brazil, for example, more likely to burn up its rain forest if it is poor or rich?

The Commons Blog
links to this
study
by Indur Goklany on just this topic:

If global warming is real and its effects will one
day be as devastating as some believe is likely, then greater economic growth
would, by increasing greenhouse gas (GHG) emissions, sooner or later lead to
greater damages from climate change. On the other hand, by increasing wealth,
technological development and human capital, economic growth would broadly
increase human well-being, and society's capacity to reduce climate change
damages via adaptation or mitigation. Hence, the conundrum: at what point in
the future would the benefits of a richer and more technologically advanced
world be canceled out by the costs of a warmer world?

Indur Goklany attempted to shed light on this
conundrum in a recent paper presented at the 25th Annual North American
Conference of the US Association for Energy Economics, in Denver (Sept. 21,
2005). His paper "” "Is a
richer-but-warmer world better than poorer-but-cooler worlds?"
"” which can
be found here,
draws upon the results of a series of UK Government-sponsored studies which
employed the IPCC's emissions scenarios to project future climate change
between 1990 and 2100 and its global impacts on various climate-sensitive
determinants of human and environmental well-being (such as malaria, hunger,
water shortage, coastal flooding, and habitat loss). The results indicate that
notwithstanding climate change, through much of this century, human well-being
is likely to be highest in the richest-but-warmest world and lower in
poorer-but-cooler worlds. With respect to environmental well-being, matters may
be best under the former world for some critical environmental indicators through
2085-2100, but not necessarily for others.

This conclusion casts doubt on a key premise
implicit in all calls to take actions now that would go beyond "no-regret"
policies in order to reduce GHG emissions in the near term, namely, a
richer-but-warmer world will, before too long, necessarily be worse for the
globe than a poorer-but-cooler world. But the above analysis suggests this is
unlikely to happen, at least until after the 2085-2100 period.

Policy Alternatives

Above, we looked at the effect of a cap and trade scheme, which would have
about the same effect as some type of carbon tax.  This is the best
possible approach, if an interventionist approach is taken.  Any other is
worse.

The primary other alternative bandied about by scientists is some type of
alternative energy Manhattan project.  This can only be a disaster.
Many scientists are technocratic
fascists at heart
, and are convinced that if only they could run the
economy or some part of it, instead of relying on this messy bottom-up
spontaneous order we call the marketplace, things, well, would be better.
The problem is that scientists, no
matter how smart they are, miss with their bets
because the economy, and
thus the lowest cost approach to less CO2 production, is too complicated for
anyone to understand or manage.  And even if the scientists stumbled on
the right approaches, the political process would just screw the solution
up.  Probably the number one alternative energy program in the US is
ethanol subsidies, which are scientifically insane since ethanol
actually increases rather than reduces fossil fuel consumption
.
Political subsidies almost always lead to investments tailored just to capture
the subsidy, that do little to solve the underlying problem.  In Arizona,
we have thousands of cars with subsidized conversions to engines that burn
multiple fuels but never burn anything but gasoline.  In California, there
are hundreds of massive windmills that never turn, having already served their
purpose to capture a subsidy.  In California, the state bent over
backwards to encourage electric cars, but in fact a different technology, the
hybrid, has taken off.

Besides, when has this government led technology revolution approach ever
worked?  I would say twice - once for the Atomic bomb and the second time
to get to the moon.  And what did either get us?  The first got us
something I am not sure we even should want, with very little carryover into
the civilian world.  The second got us a big scientific dead end, and
probably set back our space efforts by getting us to the moon 30 years or so
before we were really ready to do something about it or follow up the efforts.

If we must intervene to limit CO2, we should jack up the price of fossil
fuels with taxes, or institute a cap and trade scheme which will result in
about the same price increase, and the market through millions of individual
efforts will find the lowest cost net way to reach whatever energy consumption
level you want with the least possible cost.  (The only real current
alternative that is rapidly deploy-able to reduce CO2 emissions anyway is nuclear
power
, which could be a solution but was killed by...the very people now
wailing about global warming.)

The table of contents for the rest of this paper, . 4A Layman's Guide to Anthropogenic Global Warming (AGW) is here Free pdf of this Climate Skepticism paper is here and print version is sold at cost here

The open comment thread for this paper can be found here.