The table of contents for the rest of this paper, . 4A Layman's Guide to Anthropogenic Global Warming (AGW) is here. Free pdf of this Climate Skepticism paper is here and print version is sold at cost here
There is no area in global warming discussions where AGW
advocates have done more to shoot down their own credibility than in the
absolutely egregious science and absurd claims that have been made about the
potential negative effects of global warming. If AGW advocates are frustrated
that skeptics question their science and their credibility, they need to look
no further than their own claims on global warming effects, which are so easy
to prove wrong that it causes people like me to question everything else they
say.
Whenever global warming is discussed in the press, the
consequences are all universally bad. Floods, famine, drought,
pestilence, disease "“ they are all commonly predicted results of global
warming. But it is worth noting that in the 1970's, when climate
scientists and the press were in a panic over global cooling, the predicted
results were"¦ floods, famine, drought, pestilence, disease. The
implication is that we currently happen to be balanced on the knife edge of
exactly the optimum world temperature for mankind. Any change warmer or
cooler results in net negative consequences.
This, of course, seems an odd coincidence. Since man
evolved into homo sapiens, he has experienced a wide range of cooler and
warmer temperatures than we experience today. It seems frankly amazing
that in the mid 20th century we happened to be sitting at the
absolute ideal temperature for modern technological society and
agriculture. Now, I guess you can argue that our society has made
enormous investments based on the locations of the best crop lands, the height
of the oceans, the typical paths of storms, etc., and that shifts in any of
these would force an expensive restructuring of these investments.
However, it is also worth noting that from the bottom of the Little Ice Age to
say 1980, the world warmed at least a degree, and no one really
noticed! Everyone was still talking about cooling!
So I think that any honest analysis of the effects of global
warming would have to acknowledge that there are likely both positive and
negative effects. While some areas may experience heat-induced droughts,
other will be wetter as more moisture from the oceans is evaporated.
While some crops will struggle, others, particularly in northern latitudes, will
thrive due to longer growing seasons. For each crop of vegetables that
wilt in a heat wave there will be a crop of citrus that didn't freeze.
While more may die from the heat, fewer will die from the cold. These may
still net to a negative sum, but that net sum will be substantially less
negative than a one-sided look at only the downsides of warming would arrive
at.
One reason that warming impact analysis is hard is because while we may talk
about the world warming a degree or two, the world does not warm evenly.
Most climate models show the most warming on dry winter nights (Siberian
winters, for example, get a disproportionate share of the warming). An
extra summer degree in Arizona would suck; an extra winter degree in Siberia
would probably be welcomed, and would likely extend growing seasons.
In the rest of this chapter, I will spend some time with a number of the
most common "scary results" from global warming.
In An Inconvenient Truth, Al Gore claims that oceans will
rise twenty feet due to global warming. Helpfully, a number of websites
have been created to show what parts of the world (including much of Florida)
would sink beneath the oceans like Atlantis with a 20-foot rise in sea level.
Fortunately, even most AGW supporters believe that Gore is
wildly exaggerating, at least for any time period less than a couple of
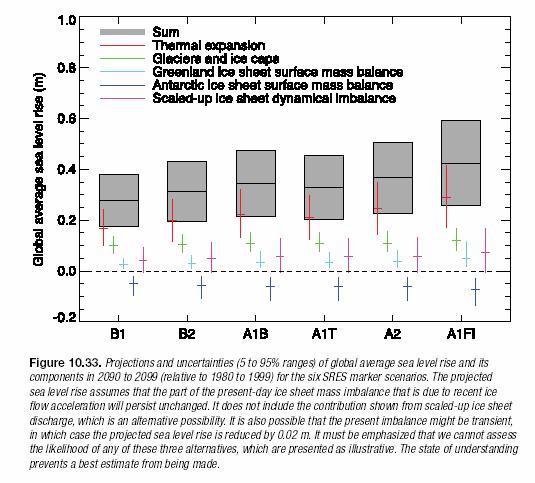
centuries. The Fourth IPCC report (see chart below) predicts sea level
rise by the year 2100 of "¦ 12-15 inches. And remember that this is based
on forecasts of both CO2 production and climate sensitivity to CO2 that are
arguably high by a factor of two or more. From the fourth IPCC report
(different columns are for different starting CO2 forecasts):
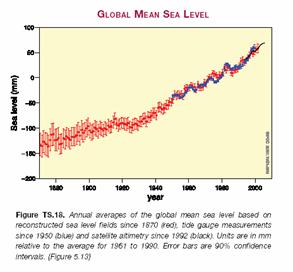
By the way, to give a sense of scale, the IPCC estimates
that the oceans have already risen about 0.2 meters in the last 130 years or
so:
One other interesting thing you can see from the sea level
forecast chart is that even the IPCC considers ice melting virtually
irrelevant. That is because most of the surface level increase is from
thermal expansion of the water as the oceans warm. In the A1B case, for
example, net worldwide ice melt raises oceans by about 4 inches in the next
hundred years.
This last conclusion may seem crazy to anyone who has
watched the media of late or seen Mr. Gore's movie. Images of ice
crashing into the ocean and sea ice retreating are common fodder for global
warming visuals. But the fact is that ice, like everything else in
climate, is complicated.
- North Pole: Arctic sea ice melting is totally
irrelevant to ocean surface levels. Since the ice floats, even a
100% melting of the Arctic ice will not change sea level one bit, just as
ice melting in your glass of water does not cause your glass to
overflow.
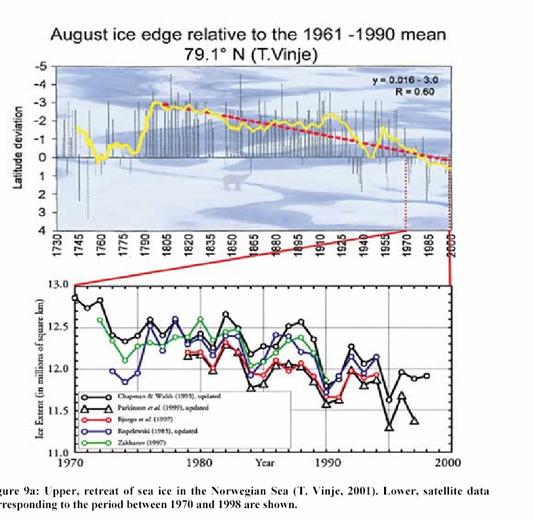
But some may argue that this ducks the
question. Does current, well-documented retreat of artic ice sheets
provide independent confirmation of the magnitude of AGW? In fact, though
ice sheets are retreating, this seems to be part of a two hundred year trend
that began long before man was burning fossil fuels in any quantity:
- Alpine Glaciers: We know that many Alpine
glaciers around the world are retreating. Some of this is surely
from global warming, but some is also from fluctuations in
precipitation. In many cases, we have documented evidence that these
glaciers have been retreating since the 19th century, and that
they have been less extensive in the past.
Reid A. Bryson is Emeritus Professor and founding
chairman of the University of Wisconsin Department of Meteorology"”now the
Department of Oceanic and Atmospheric Sciences and a member of the United
Nations Global 500 Roll of Honor. When asked about
the retreat of Alpine glaciers, he says, "What do they find when the ice
sheets retreat, in the Alps? A silver mine! The guys had stacked up their
tools because they were going to be back the next spring to mine more silver,
only the snow never went," he says. "There used to be less ice than now. It's
just getting back to normal."
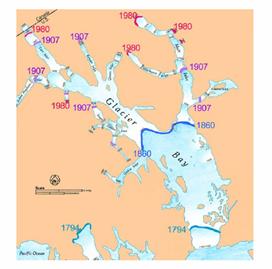
Alaska Geographic published a chart of the retreat
of the glaciers at Glacier Bay, Alaska, showing most of the retreat occurred before
the 2nd half of the 20th century:
One special note should be made of the glaciers on
Kilimanjaro, because their retreat over the last 125 years has been
well-documented and played a starring role in An Inconvenient Truth. Analysis
has shown that most the glacial retreat at Kilimanjaro occurred before 1953
(and therefore before most recent warming) and that the retreat has
more to do with moisture in the air than with global warming. One
wonders why the movie, with glacial retreats around the world that are provably
due to warming, would focus on one that is probably not due to warming.
· Greenland:
Greenland has a lot of ice, and there is not much doubt that if it all melted,
the oceans would rise a lot. However, we know that in the middle ages,
Greenland was much warmer and had less extensive ice coverage (thus the name
Greenland and the successful attempt to farm it for over a century)
While there is a lot of discussion about whether
the Medieval Warm Period extended worldwide, most accept that it did cover the
North Atlantic, including Greenland. Boreholes, such as the Dahl-Jensen
below, seem to prove out our historical information, showing a temperature peak
around the year 1000.
· Antarctica:
Something like 80-85% of the world's ice is in Antarctica. And no one
really thinks it is melting or going to melt. In fact, if you look at the
marks on the IPCC chart above for the contribution of Antarctic ice to ocean
levels, it has a net negative impact, which means the IPCC actually expects the
Antarctic ice sheet to grow, not melt.
Whoa, that can't be right! Mr. Gore showed those videos of ice retreating
in Antarctica. Well, yes, sort of. Scientists expect that global
warming will make the sea currents that circle Antarctica a bit warmer, leading
to more precipitation and more snowfall on the continent. Besides,
Antarctica is so damn cold that raising temperatures a few degrees is not going
to melt anything.
The one exception is the Antarctic Peninsula, which
sticks out into the warmer oceans. This land area, representing about 2%
of the Antarctic land mass and even less of its total ice sheet, is expected to
warm and lose ice while the other 98% gains ice.
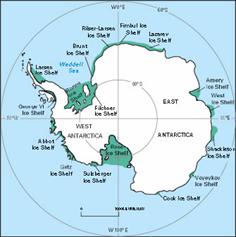
Guess what? Mr. Gore chose that little 2% to
illustrate his movie. Was he ignorant of the choice he was making, or did
he know exactly what he was doing, telling the literal truth (that the
peninsula is melting) but leading viewers to the wrong conclusion overall about
Antarctic ice?
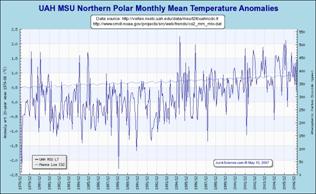
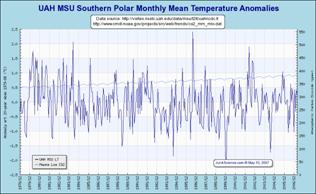
By the way, one last interesting
fact that frankly, scientists don't fully understand is the fact that the South
Pole is really not experiencing any warming. While the warming at the
north pole exceeds the global average, the south pole shows little or no
anomaly.
Alter Hurricane Katrina, the media storyline focused
strongly on the role global warming may have played in increasing hurricane
power and activity. Lost in the rush to blame global warming was the fact
that Katrina, when it made landfall, was not even a category 5 hurricane, and
its devastation was due more to a city sited below sea-level that did a
poor job of managing its storm protection.
In fact, many hurricane experts do not agree with the argument
that warming oceans can lead to more and stronger hurricanes. In fact,
hurricane activity is more related to the difference in temperatures between
the cold and warmer waters, a difference AGW theory says should decrease rather
than increase. So is there reason to believe hurricanes are on the rise
as global temperatures warm? The answer, as shown below, seems to be no:
But what about storm damage? It certainly seems like
recent hurricanes have resulted in far more economic damage. And they
have, but for the simple reason that over the last several decades, Americans
have put billions of dollars of expensive homes and other facilities in
vulnerable Gulf and Atlantic coast locations. Several years ago, Dr. RA Pielke and CW Landsea
(that can't really be the name of a scientist studying coastal strikes by
hurricanes) attempted to correct hurricane damage numbers for the density and
value of coastal real estate:
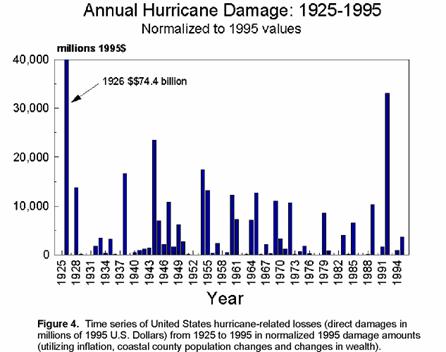
By this reckoning, it is hard to see any trend.
Another claim Mr. Gore makes in An Inconvenient Truth
is that 2004 was the most active year for tornadoes ever in the United States,
and that there has been a steady trend in increasing tornados as the globe has
warmed.
And certainly if you look at the raw numbers, you might be
worried:
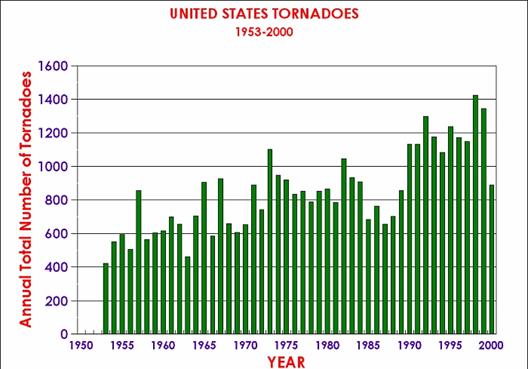
But there is a little something Mr. Gore fails to
mention. During this time period, from 1950 to 2000, the technology and
network for detecting tornados has improved vastly. From the NOAA
With increased national doppler
radar coverage, increasing population, and greater attention to tornado
reporting, there has been an increase in the number of tornado reports over the
past several decades. This can create a misleading appearance of an increasing
trend in tornado frequency. To better understand the true variability and trend
in tornado frequency in the US, the total number of strong to violent tornadoes
(F3 to F5 category on the Fujita scale) can be analyzed. These are the
tornadoes that would have likely been reported even during the decades before
Dopplar radar use became widespread and practices resulted in increasing
tornado reports. The bar chart below indicates there has been little trend in
the strongest tornadoes over the past 55 years.
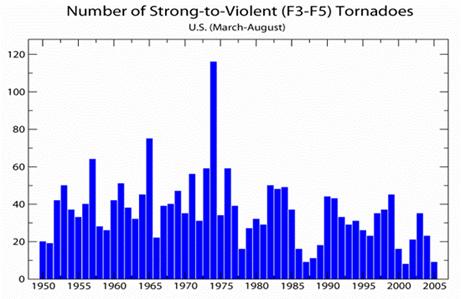
Oops! In fact, tornado frequency seems to be falling
as temperatures warm. Do you think this was another honest mistake, like
with Antarctica, or did Mr. Gore purposefully obfuscate the real story?
Another argument is that global warming will lead to more temperature
extremes, particularly record sweltering highs. That seems logical
enough, but Bruce Hall actually
compiled the data and found something interesting. He created a data base
for each state which shows in what year that state's monthly temperature
records were set. So for each state, he has the years when the
twelve monthly high temperature records were set (e.g. year of highest Arizona
Jan temp, year of highest Arizona Feb temp, etc.) and the years when the twelve
monthly low temperature records were set. Here, for example, is his data
for Arizona:
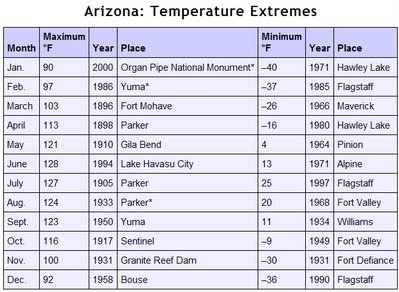
So, for example, the record for the highest July temperature was set in 1905
at Parker, Arizona with a scorching 127 degrees. The entry in his
database would then be Arizona-July: 1905. He notes that there is a
bias in the data toward more recent years, since if the record was set in 1905
and tied in 1983, only the newer 1983 date will show in the data. I would
also observe that this data is uncorrected for urban heat island effects (as
cities urbanize they get hotter, and effect that is different than CO2-cause global
warming and is usually corrected for in global warming studies). There is
also a bias towards the present in having more measurement points today than
100 years ago: More measurement points means that, over a state, one is
more likely to pick up the true high (or low).
Though I have
other problems with the anthropogenic global warming hypothesis, I have
never really doubted that the world has warmed up over the last century.
So even I, a skeptic, would expect a disproportionate number of the all-time
high temperatures to be in the last decade, particularly without UHI correction
and with the bias discussed above. The global warming folks would argue
that the effect should be doubly pronounced, since they claim that we are
seeing not just a general heating, but an increase in volatility (ie more
extreme variation around the mean).
But Hall doesn't find this when he graphs the data.
Take the 600 state monthly high temperature records that exist on the books
today (50 states times 12 months) and graph the distribution of years in which
these records were set:
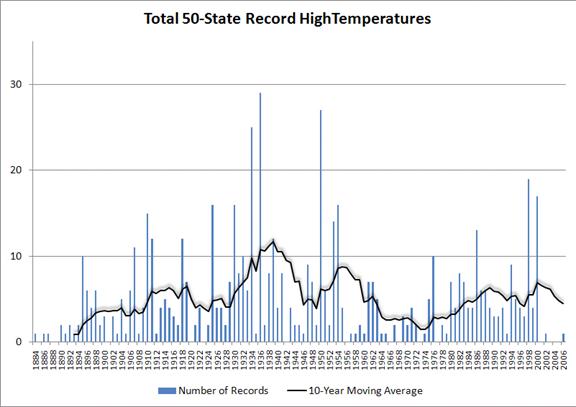
Assuming about 120 years of data, you should expect to see a high
temperature record on average in a database of 600 records at 5 per year, which
is precisely where we have been of late and well below the record years in the
thirties (remember the dust bowl?) and the fifties. It seems to actually show a
reduction in temperatures or volatility or both.
This may seem impossible "“ how can the mean increase without causing a lot
more new highs? But remember what we discussed earlier "“ global warming
is expected to be seen disproportionately in nighttime and winter
temperatures. This means that the mean can increase even as daytime
summer highs don't increase much. In a sense, is the lows, not the highs,
that are getting higher.
Vincent et al in 2005 did a study of temperature trends in South America
from 1960-2000. What they observed is exactly what we discussed
here: The number of warm days and cold days did not really change.
The warming trend showed up as a decrease in cold nights and an increase in
warm nights, meaning effectively that the diurnal (across 24 hours) temperature
variation is narrowed.
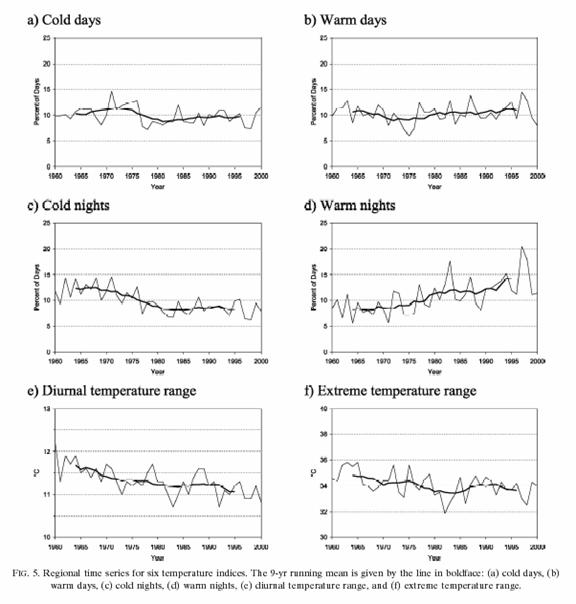
It's a little hard to be scared by this.
Biologist Josef Reichholf was
interviewed recently in der
Spiegel. He is a strong conservationist, and certainly has his axe to
grind with industrial society. In fact he blames industrial agriculture
and modern development for problems that species face.
Many species are certainly
threatened, but not by climate change"¦.Many species have already fled from the
countryside to the cities, which have been transformed into havens of
biodiversity. We are also seeing another interesting phenomenon: Major cities,
like Hamburg, Berlin and Munich, have formed heat islands where the climate has
been two or three degrees warmer than in the surrounding countryside for
decades. If higher temperatures are truly so bad, why do more and more animals
and plants feel so comfortable in our cities?
On the contrary, there is much to
be said for the argument that warming temperatures promote biodiversity. There
is a clear relationship between biodiversity and temperature. The number of
species increases exponentially from the regions near the poles across the
moderate latitudes and to the equator. To put it succinctly, the warmer a
region is, the more diverse are its species.
OK, but what about those polar bears? We have all seen
the media pictures of bears stranded on blocks of ice, as if all the arctic has
melted out from under them. Well, it turns out that polar bears have
survived much warmer conditions. We know polar bears existed as a
separate species at least 125,000 years ago, and in the intervening years,
there have been periods where Arctic sea ice melted completely during the
summer months. And yet polar bears still exist today. Polar bears
may be threatened by man's hunting and encroachment on its hunting grounds, but
not likely by our fossil fuel combustion.
AGW fear-mongering also extends to breathless predictions of
increases in "tropical" diseases. Reichholf also takes on this canard:
Many people truly believe that
malaria will spread as temperatures rise. But malaria isn't even a true
tropical disease. In the 19th century, thousands of people in Europe, including
Germany, the Netherlands and even Scandinavia, died of malaria, even though
they had never gone abroad. That's because this disease was still prevalent in
northern and central Europe in previous centuries. We only managed to eliminate
malaria in Europe by quarantining the sick, improving hygiene and draining
swamps. That's why I consider it virtually impossible that malaria would return
to us purely because of climate change. If it does appear, it'll be because it
has been brought in somewhere.
Most of the world's leading tropical disease experts tend to
agree with Reichholf. In fact, I would argue that diseases like Malaria
are not diseases of the tropics but diseases of poverty and
under-development. Malaria is prevalent in Africa not because Africa is
hot but because Africa is poor. Asian tropical countries that have developed
substantially over the last several decades have also greatly reduced
malaria. In fact, as I will discuss in later sections, by reducing world
economic growth and slowing development in the third world in the name of CO2
reduction, we will actually increase rather than reduce these diseases.
One of the recent hysteria's has been that global warming
will cause the Gulf Stream to collapse as Atlantic circulation patterns are
radically altered, thus leading to the freezing of Europe. More sober
scientists have since essentially said "nevermind." The Gulf Stream and
Atlantic circulation patterns are far more robust than this theory assumed,
and, even if the Gulf Stream changes, proponents of the theory were
overestimating the dependence of Europe on Gulf Stream warming.
Interestingly, we may eventually decide that other
non-climate effects of CO2 production actually present more tangible
environmental threats. In particular, recent studies have shown that more
atmospheric CO2 is causing the PH of ocean surface layers to drop (ie become
more acidic) leading potentially to coral kills and substantial changes in sea
life. At the same time, physicist Freeman Dyson argues that stratospheric
cooling from man-made CO2 is much more a problem than surface warming, and is
much more measurable and provable. These topics are beyond my scope at
this point, but something we may see more of in the future.
The table of contents for the rest of this paper, . 4A Layman's Guide to Anthropogenic Global Warming (AGW) is here. Free pdf of this Climate Skepticism paper is here and print version is sold at cost here
The open comment thread for this paper can be found here.
