Denying the Climate Catastrophe: 7. Are We Already Seeing Climate Change?
This is Chapter 7 of an ongoing series. Other parts of the series are here:
- Introduction
- Greenhouse Gas Theory
- Feedbacks
- A) Actual Temperature Data; B) Problems with the Surface Temperature Record
- Attribution of Past Warming: A) Arguments for it being Man-Made; B) Natural Attribution
- Climate Models vs. Actual Temperatures
- Are We Already Seeing Climate Change (this article)
- The Lukewarmer Middle Ground
- A Low-Cost Insurance Policy
Note: This is by far the longest chapter, and could have been 10x longer without a lot of aggressive editing. I have chosen not to break it into two pieces. Sorry for the length. TL;DR: The vast majority of claims of current climate impacts from CO2 are grossly exaggerated or even wholly unsupported by the actual data. The average quality of published studies in this area is very low compared to other parts of climate science.
Having discussed the theory and reality of man-made warming, we move in this chapter to what is often called "climate change" -- is manmade warming already causing adverse changes in the climate?
This is a peculiarly frustrating topic for a number of reasons.
First, everyone who discusses climate change automatically assumes the changes will be for the worse. But are they? The Medieval Warm Period, likely warmer than today, was a period of agricultural plenty and demographic expansion (at least in Europe) -- it was only the end of the warm period that brought catastrophe, in the form of famine and disease. As the world warms, are longer growing seasons in the colder parts of the northern hemisphere really so bad, and why is it no one ever mentions such positive offsets?
The second frustrating issues is that folks increasingly talk about climate change as if it were a direct result of CO2, e.g. CO2 is somehow directly worsening hurricanes. This is in part just media sloppiness, but it has also been an explicit strategy, re-branding global warming as climate change during the last 20 years when global temperatures were mostly flat. So it is important to make this point: There is absolutely no mechanism that has been suggested by anyone wherein CO2 can cause climate change except through the intermediate step of warming. CO2 causes warming, which then potentially leads to changes in weather. If CO2 is only causing incremental warming, then it likely is only causing incremental changes to other aspects of the climate. (I will note as an aside that man certainly has changed the climate through mechanisms other than CO2, but we will not discuss these. A great example is land use. Al Gore claimed the snows of Kilimanjaro are melting because of global warming, but in fact it is far more likely they are receding due to precipitation changes as a result of deforestation of Kilimanjaro's slopes.)
Finally, and perhaps the most frustrating issue, is that handling claims of various purported man-made changes to the climate has become an endless game of "wack-a-mole". It is almost impossible to keep up with the myriad claims of things that are changing (always for the worse) due to CO2. One reason that has been suggested for this endless proliferation of dire predictions is that if one wants to study the mating habits of the ocelot, one may have trouble getting funding, but funding is available in large quantities if you re-brand your study as the effect of climate change on the mating habits of the ocelot. It is the unusual weather event or natural phenomenon (Zika virus!) that is not blamed by someone somewhere on man-made climate change.
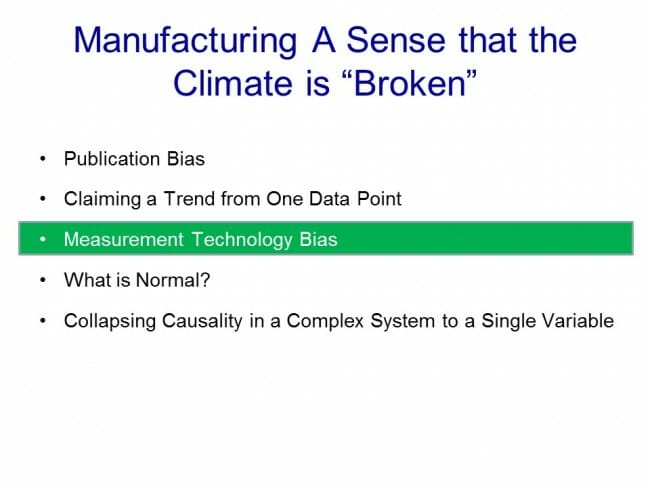
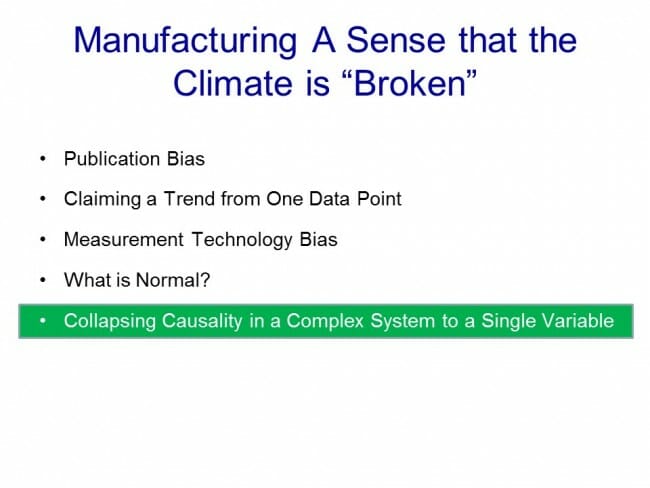
As a result, this section could be near-infinitely long. To avoid that, and to avoid a quickly tedious series of charts labelled "hurricanes not up", "tornadoes not up", etc., I want to focus more on the systematic errors that lead to the false impression that we are seeing man-made climate changes all around us.
We will start with publication bias, which I would define as having a trend in the reporting of a type of an event mistaken for a trend in the underlying events itself. Let's start with a classic example from outside climate, the "summer of the shark".
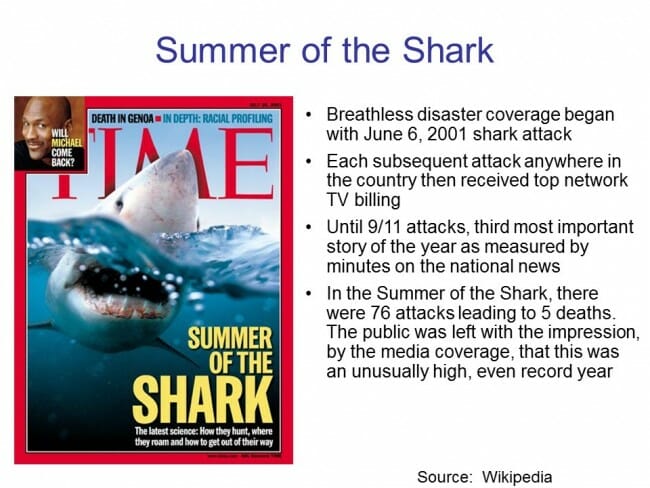
The media hysteria began in early July, 2001, when a young boy was bitten by a shark on a beach in Florida. Subsequent attacks received breathless media coverage, up to and including near-nightly footage from TV helicopters of swimming sharks. Until the 9/11 attacks, sharks were the third biggest story of the year as measured by the time dedicated to it on the three major broadcast networks’ news shows.
Through this coverage, Americans were left with a strong impression that something unusual was happening — that an unprecedented number of shark attacks were occurring in that year, and the media dedicated endless coverage to speculation by various “experts” as to the cause of this sharp increase in attacks.
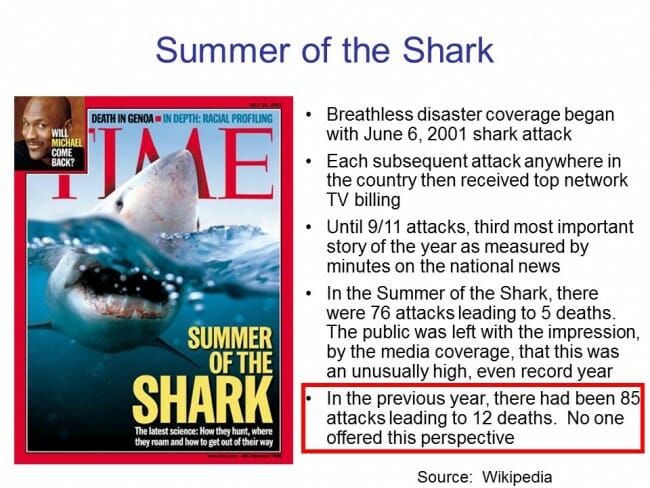
Except there was one problem — there was no sharp increase in attacks. In the year 2001, five people died in 76 shark attacks. However, just a year earlier, 12 people had died in 85 attacks. The data showed that 2001 actually was a down year for shark attacks. The increased media coverage of shark attacks was mistaken for an increase in shark attacks themselves.
Hopefully the parallel with climate reporting is obvious. Whereas a heat wave in Moscow was likely local news only 30 years ago, now it is an international story that is tied, in every broadcast, to climate change. Every single tail-of-the-distribution weather event from around the world is breathlessly reported, leaving the impression among viewers that more such events are occurring, even when there is in fact no such trend. Further, since weather events can drive media ratings, there is an incentive to make them seem scarier:
When I grew up, winter storms were never named. It was just more snow in Buffalo, or wherever. Now, though, we get "Winter Storm Saturn: East Coast Beast." Is the weather really getting scarier, or just the reporting?
The second systematic error is not limited to climate, and is so common I actually have a category on my blog called "trend that is not a trend". There is a certain chutzpah involved in claiming a trend when it actually does not exist in the data, but such claims occur all the time. In climate, a frequent variation on this failure is the claiming of a trend from a single data point -- specifically, a tail-of-the-distribution weather event will be put forward as "proof" that climate is changing, ie that there is a trend to the worse somehow in the Earth's climate.
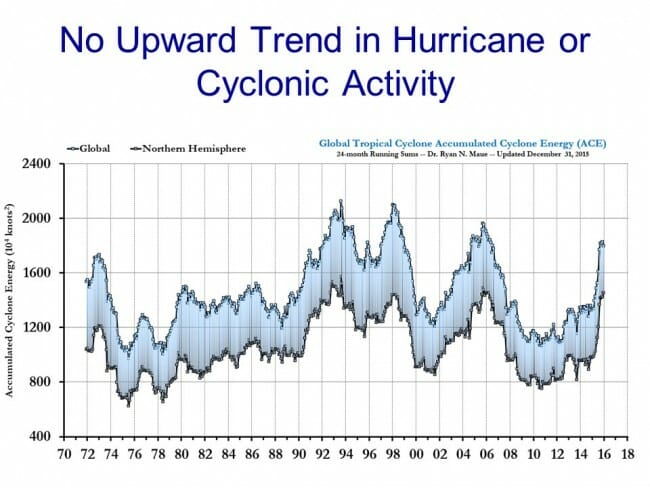
The classic example was probably just after Hurricane Katrina. In a speech in September of 2005 in San Francisco, Al Gore told his Sierra Club audience that not only was Katrina undoubtedly caused by man-made global warming, but that it was the harbinger of a catastrophic onslaught of future such hurricanes. In fact, though, there is no upward trend in Hurricane activity. 2005 was a high but not unprecedented year for hurricanes. An Katrina was soon followed by a long and historic lull in North American hurricane activity.
Counting hurricane landfalls is a poor way to look at hurricanes. A better way is to look at the total energy of hurricanes and cyclones globally. And as you can see, the numbers are cyclical (as every long-time hurricane observer could have told Mr. Gore) but without any trend:
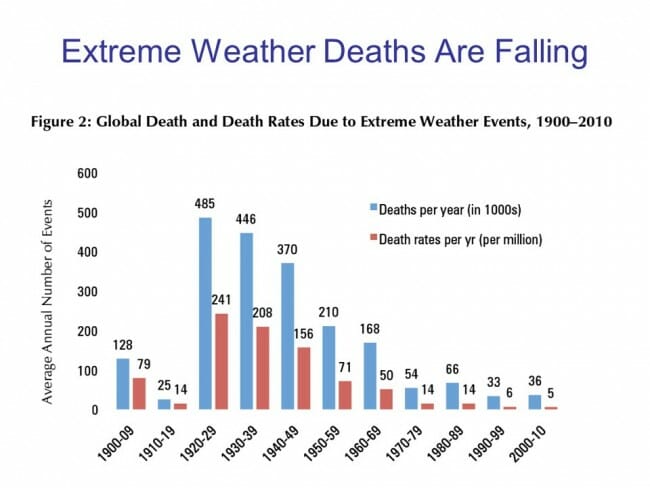
In fact, the death rates from severe weather have been dropping throughout the last century at the same time CO2 levels have been rising
Of course, it is likely that increasing wealth and better technology are responsible for much of this mitigation, rather than changes in underlying weather patterns, but this is still relevant to the debate -- many proposed CO2 abatement plans would have the effect of slowing growth in the developing world, leaving them more vulnerable to weather events. I have argued for years that the best way to fight weather deaths is to make the world rich, not to worry about 1 hurricane more or less.
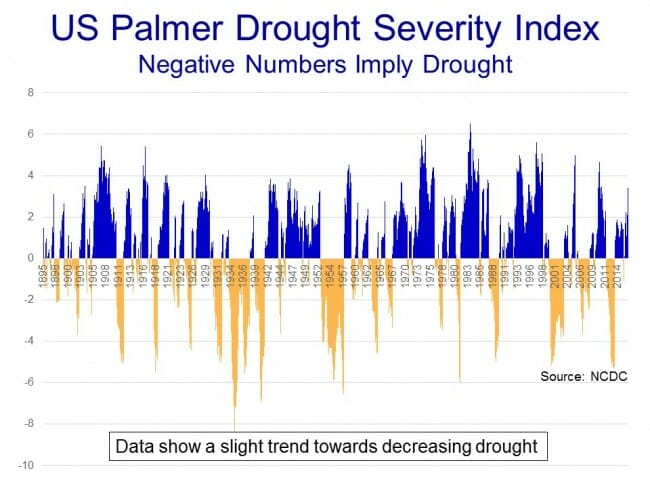
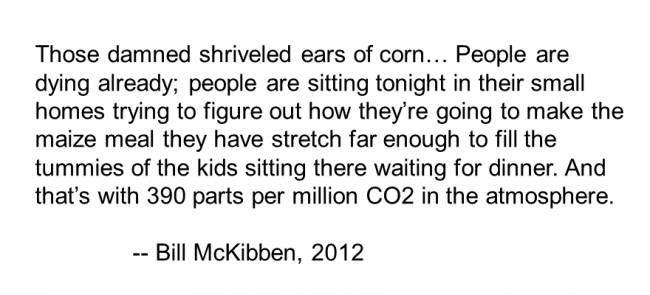
Droughts are another event where the media quickly finds someone to blame the event on man-made climate change and declare that this one event is proof of a trend. Bill McKibben tweeted about drought and corn yields many times in 2012, for example:
It turns out that based on US government data, the 2012 drought was certainly severe but no worse than several other droughts of the last 50 years (negative numbers represent drought).
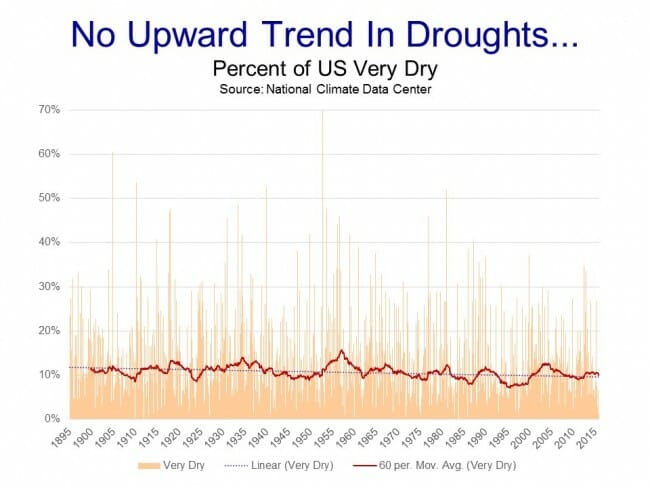
There is no upward trend at all (in fact a slightly downward trend that likely is not statistically significant) in dry weather in the US
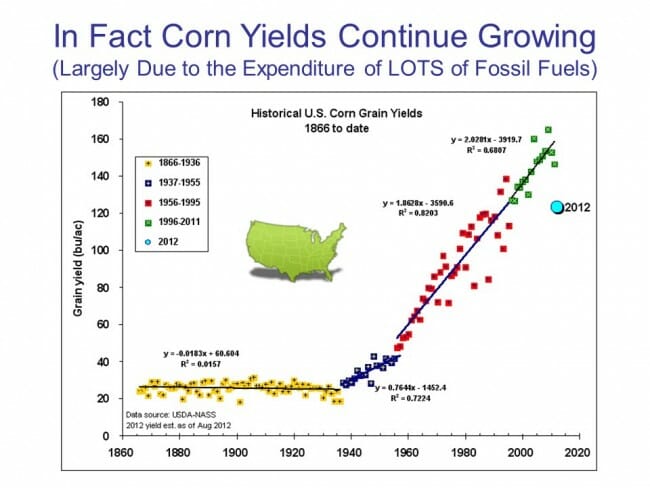
McKibben blamed bad corn yields in 2012 on man-made global warming, and again implied that one year's data point was indicative of a trend
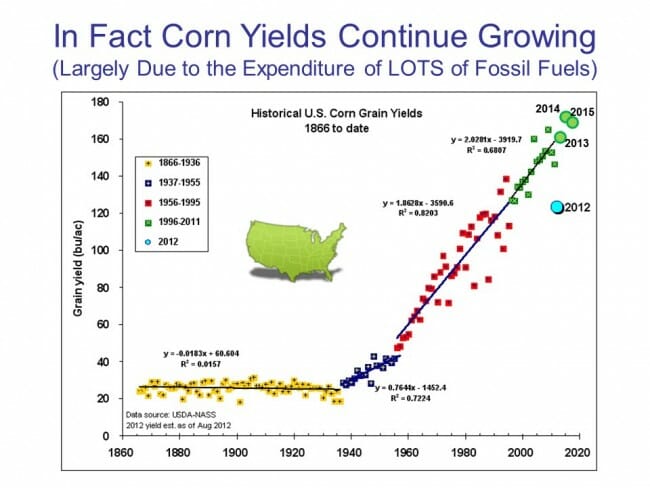
US corn yields indeed were down in 2012, but still higher than at any time they had been since 1995.
It is worth noting the strong upward trend in corn yields from 1940 to today, at the same time the world has supposedly experienced unprecedented man-made warming. I might also point out the years in yellow, which were grown prior to the strong automation of farming via the fossil fuel economy. Bill McKibben hates fossil fuels, and believes they should be entirely eliminated. If so, he also must "own" the corn yields in yellow. CO2-driven warming has not inhibited corn yields, but having McKibben return us to a pre-modern economy certainly would.
Anyway, as you might expect, corn yields after 2012 return right back to trend and continue to hit new records. 2012 did not represent a new trend, it was simply one bad year.
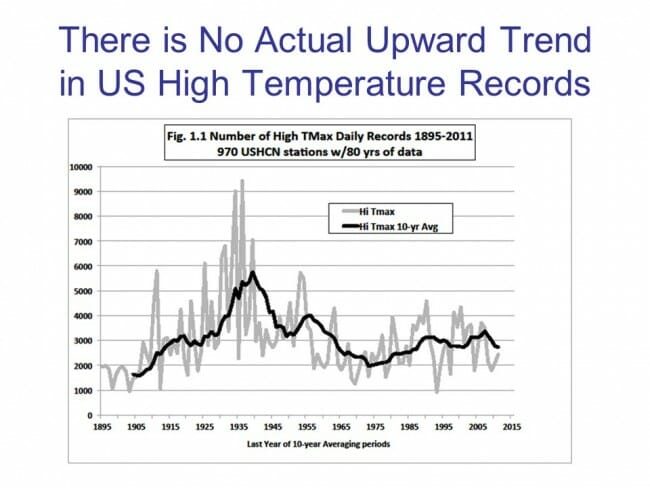
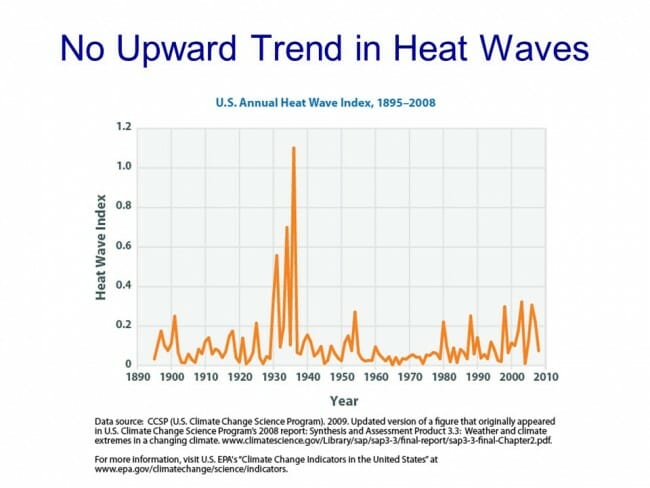
I think most folks would absolutely swear, from media coverage, that the US is seeing more new high temperatures set and an upward trend in heat waves. But it turns out neither is the case.
Obviously, one has to be careful with this analysis. Many temperature stations in the US Historical Climate Network have only been there for 20 or 30 years, so their all time high at that station for any given day is, by definition, going to be in the last 20 or 30 years. But if one looks at temperature stations with many years of data, as done above, we can see there has been no particular uptick in high temperature records and in fact a disproportionate number of our all-time local records were set in the 1930's.
While there has been a small uptick in heat waves over the last 10-20 years, it is trivial compared to the heat of the 1930's
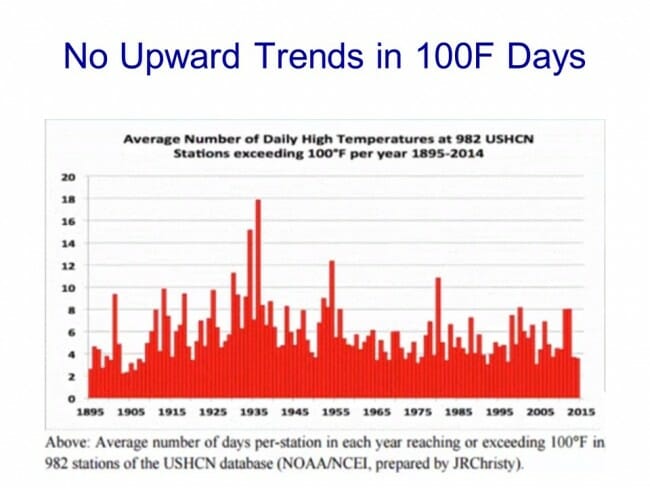
Looking at it a different way, there is no upward trend in 100 degree (Fahrenheit) days...
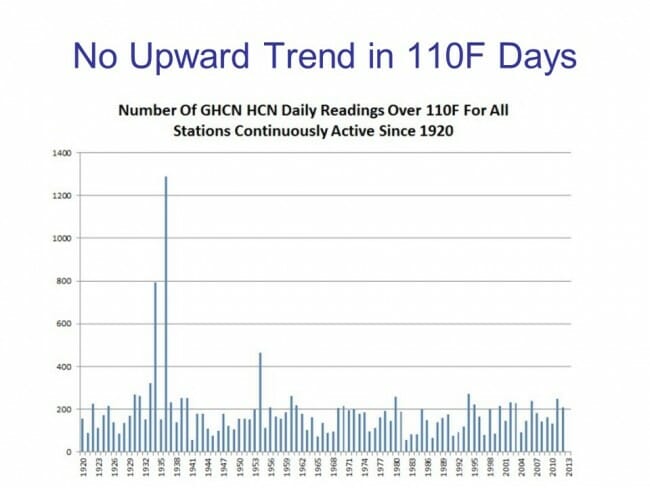
Or even 110 degree days. Again, the 1930's were hot, long before man-made CO2 could possibly have made them so
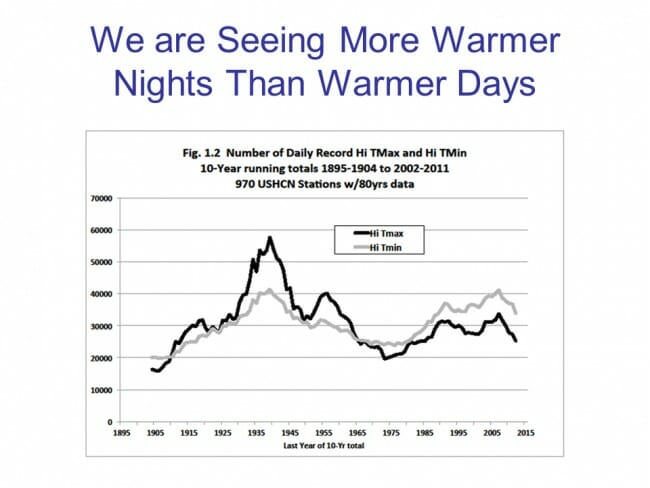
Why, one might ask, don't higher average global temperatures translate into more day-time high temperature records? Well, we actually gave the answer back in Chapter 4A, but as a reminder, much of the warming we have seen has occurred at night, raising the nighttime lows without as much affect on daytime highs, so we are seeing more record nighttime high Tmin's than we have in much of the last century without seeing more record daytime Tmax temperatures:
We could go on all day with examples of claiming a trend from a single data point. Watch for it yourself. But for now let's turn to a third category
We can measure things much more carefully and accurately than we could in the past. This is a good thing, except when we are trying to compare the past to the present. In a previous chapter, we showed a count of sunspots, and databases of sunspot counts go all the way back into the early 18th century. Were telescopes in 1716 able to see all the sunspots we can see in 2016? Or might an upward trend in sunspot counts be biased by our better ability today to detect small ones?
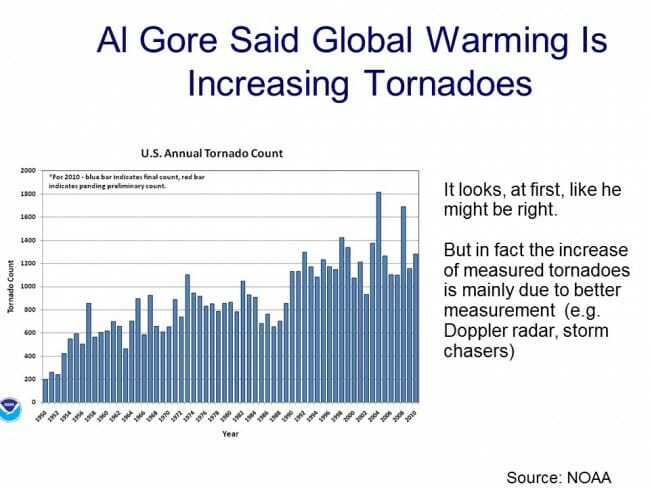
A great example of this comes, again, from Al Gore's movie in which Gore claimed that tornadoes were increasing and man-made global warming was the cause. He was working with this data:
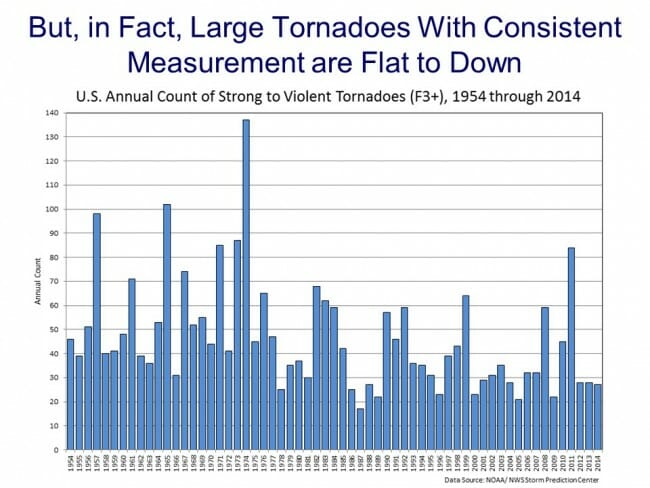
This certainly looks scary. Tornadoes have increased by a factor of 5 or 6! But if you look at the NOAA web site, right under this chart, there is a big warning that ways to beware of this data. With doppler radar and storm chasers and all kinds of other new measurement technologies, we can detect smaller tornadoes that were not counted in the 1950's. The NOAA is careful to explain that this chart is biased by changes in measurement technology. If one looks only at larger tornadoes we were unlikely to miss in the 1950's, there is no upward trend, and in fact there may be a slightly declining trend.
That, of course, does not stop nearly every person in the media from blaming global warming whenever there is an above-average tornado year
Behind nearly every media story about "abnormal" weather or that the climate is somehow "broken" is an explicit assumption that we know what "normal" is. Do we?
We have been keeping systematic weather records for perhaps 150 years, and have really been observing the climate in detail for perhaps 30 years. Many of our best tools are space-based and obviously only have 20-30 years of data at most. Almost no one thinks we have been able to observe climate in depth through many of its natural cycles, so how do we know exactly what is normal? Which year do we point to and say, "that was the normal year, that was the benchmark"?
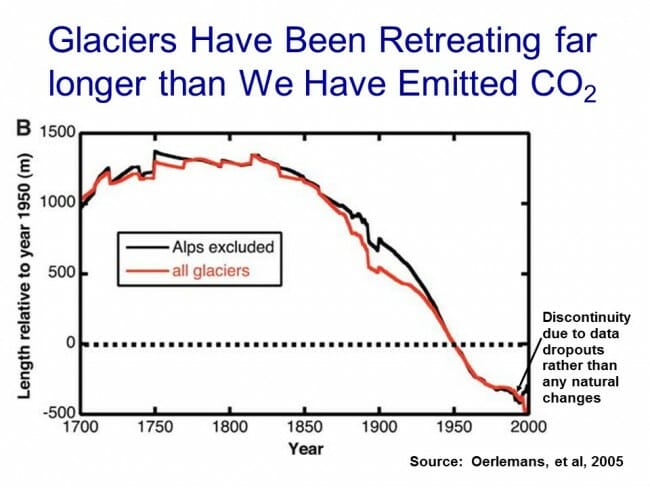
One good example of this is glaciers. Over the last 30 years, most (but not all) major glaciers around the world have retreated, leading to numerous stories blaming this retreat on man-made warming. But one reason that glaciers have retreated over the last 50 years is that they were also retreating the 50 years before that and the 50 years before that:
In fact, glaciers have been retreating around the world since the end of the Little Ice Age (I like to date it to 1812, with visions of Napoleon's army freezing in Russia, but that is of course arbitrary).
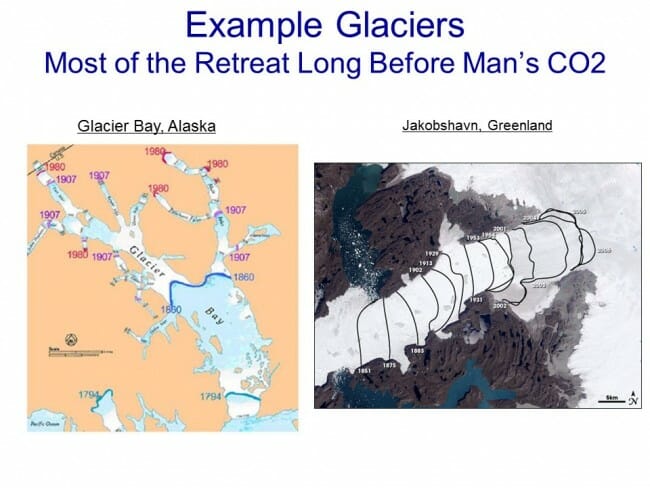
A while ago President Obama stood in front of an Alaskan glacier and blamed its retreat on man. But at least one Alaskan glacier in the area has been mapped for centuries, and has been retreating for centuries:
As you can see, from a distance perspective, most of the retreat actually occurred before 1900. If one wants to blame the modern retreat of these glaciers on man, one is left with the uncomfortable argument that natural forces drove the retreat until about 1950, at which point the natural forces stopped just in time for man-made effects to take over.
Melting ice is often linked to sea level rise, though interestingly net ice melting contributes little to IPCC forecasts of sea level rises due to expected offsets with ice building in Antarctica -- most forecast sea level rise comes from the thermal expansion of water in the oceans. And of course, the melting arctic sea ice that makes the news so often contributes nothing to sea level rise (which is why your water does not overflow your glass when the ice melts).
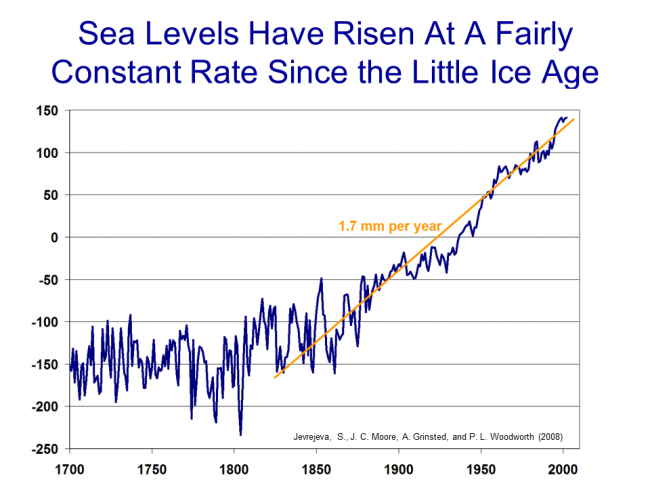
But the story for rising sea levels is the same as with glacier retreats -- the seas have been rising for much longer than man has been burning fossil fuels in earnest, going back to about the same 1812 start point:
There is some debate about manual corrections added to more recent data (that should sound familiar to those reading this whole series) but recent sea level rise seems to be no more than 3 mm per year. At most, recent warming has added perhaps 1 mm a year to the natural trend, or about 4 inches a century.
Our last failure mode is again one I see much more widely than just in climate. Whether the realm is economics or climate or human behavior, the media loves to claim that incredibly complex, multi-variable systems are in fact driven by a single variable, and -- who'd have thunk it -- that single variable happens to fit with their personal pet theory.
With all the vast complexity of the climate, are we really to believe that every unusual weather event is caused by a 0.013 percentage point change (270 ppm to 400 ppm) in the concentration of one atmospheric gas?
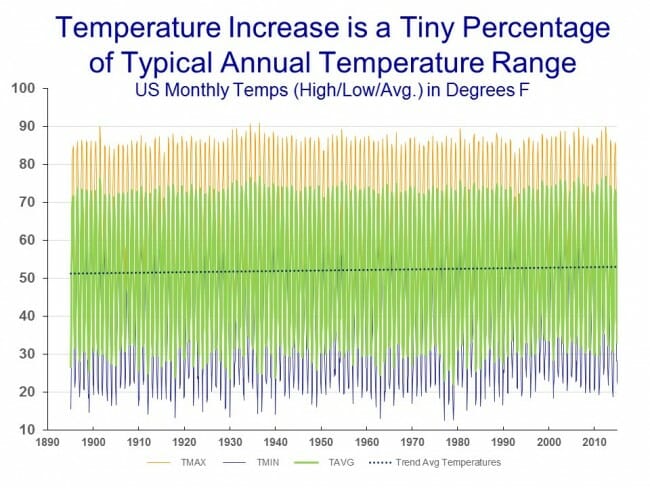
Let me illustrate this in another way. The NOAA not only publishes a temperature anomaly (which we have mostly been using in all of our charts) but they take a shot at coming up with an average temperature for the US. The following chart uses their data for the monthly average of Tmax (the daily high at all locations), Tmin (the daily low for all locations) and Tavg (generally the average of Tmin and Tmax).
Note that even the average temperatures vary across a range of 40F through the seasons and years. If one includes the daily high and low, the temperatures vary over a range of nearly 70F. And note that this is the average for all the US over a month. If we were to look at the range of daily temperatures across the breath of locations, we would see numbers that varied from well into the negative numbers to over 110.
The point of all this is that temperatures vary naturally a lot. Now look at the dotted black line. That is the long-term trend in the average, trending slightly up (since we know that average temperatures have risen over the last century). The slope of that line, around 1F per century for the US, is virtually indistinguishable. It is tiny, tiny, tiny compared to the natural variation of the averages.
The point of this is not that small increases in the average don't matter, but that it is irrational to blame every tail-of-the-distribution temperature event on man-made warming, since no matter how large we decide that number has been, its trivial compared to the natural variation we see in temperatures.
OK, I know that was long, but this section was actually pretty aggressively edited even to get it this short. For God sakes, we didn't even mention polar bears (the animals that have already survived through several ice-free inter-glacial periods but will supposedly die if we melt too much ice today). But its time to start driving towards a conclusion, which we will do in our next chapter.
Chapter 8, summarizing the lukewarmer middle ground, is here.



Engineering 101: Systems with positive feedback go boom. Some more quickly than others.
Thats why there are very few positive feedback mechanisms in nature.
Sadly, the ones that are NOW coming into force (CO2 forcing > temps rising > permafrost melting) are *not* helpful, esp. when the "higher baseline" makes normal cycles (Niño/Niña) stronger...
I'm glad you mentioned glaciers. You should read Hansen et al (OPEN ACCESS at doi:10.5194/acp-16-3761-2016) to learn about their models (!) as well as geological data on CO2, temps, ocean currents and glacial melt. This part ("Interglacials with CO2 280 ppm, i.e., the Eemian and Holsteinian (400 ky b2k), were warmer than the Holocene and had sea level at least several meters higher than today.") is scary b/c it implies we're well into an ice-water conversion that's only being slowed (NOT being stopped) by the ocean warming, which promises other significant problems (e.g., N Atlantic chaos).
Please explain why those positive feedbacks did not kick in during any of the prior warming periods -
Do those positive feedbacks have inherent knowledge to know they are only to kick in if the warming is caused by man, If so, then explain how those positive feedbacks know when the warming is caused by man or is it mann?
Joe,
There aren't any long-term positive feedback mechanisms. The positive feedback posited by the warmists is an ad-hoc jiggery poke to support their theories.
The most plausible explanation for long-term temperature change is that the energy output of the sun varies. The sun is a variable star. We have a thousand years of observations of sun spots that show that there is an eleven year cycle. Longer term cycles are suggested by other measurements but there is insufficient data to nail them down.
Roy
David,
There is no evidence that CO2 forces a temperature change.
Roy
So what N Atlantic chaos did we experience during the medieval warm period? And if positive feedbacks are unstoppable why was the warm period followed by the little ice age?
It was a 300 year "weather Event" that somehow sat over the same spot of the globe for those 300 years (ironically, the only spot of the globe that had prolific contemporaneous writings by humans).
Gr8 - as you have noted - the scientific explanation of the 300 year localized weather event has zero scientific credibility - though somehow the deniers of science have bought into it.
Roy - I misread your post. We are on the same page -
One item that has struck me is the "science deniers - (ie the AGW warmists) will ignore historical scientific evidence in creating the extra ordinary warming that will be caused by the positive feedbacks; not withstanding the historical evidence that the positive feedbacks did not manifest in the past warmer periods
The last grap h is a bunch of nonsense. Based on paleoclimate estimates of global temperatures, 5-6C is the difference between the current interglacial period and the ice ages. It also saw a 200Meter change in global sea levels. About 1/3 of the temperature change has been attributed to a change in CO2 concentration from 180-280ppM which is considerably less than doubling of CO2.
The trend of increasing sea level has been accelerating.
https://robertscribbler.com/2016/02/04/rapid-acceleration-in-sea-level-rise-from-2009-through-october-2015-global-oceans-have-risen-by-5-millimeters-per-year/hansen-sea-level-rise-3/
The premise of your question is wrong.
The ice age cycles are due to positive feedbacks that are triggered by slight changes in summer sunlight in the northern hemisphere. The first feedback mechanism was change in snow and ice cover in response to changes in sunlight. This changes the amount of the energy from sunlight that is retained by the earth through changes in the reflectivity of the Earths surface. The next positive feedback mechanism to kick in was CO2 and CH4 absorbed or emitted by the oceans and land in response to ocean temperatures. This changes the rate of escape of thermal radiation from the earth's surface into outer space via the atmospheric greenhouse effect. This is a slow process and has a time delay attached to it. Another significant positive feedback is water vapor. The effect of this are immediate because the oceans are a huge source in direct contact with the atmosphere.
The change in temperature was 5-6C almost entirely due to these feedback effects.
Au contraire - there is nothing but evidence.
Best,
D
Roy,
We are able to measure the energy output of the sun. It increased in the first half of the 20th century, then stopped. It decreased slightly at the end of the 20th century. The sun does not explain glolbal warming since 1950. That is the reason that the IPCC attribtuted all of the warming, and then some, since 1950 to GHG's emitted by humans.
Dano,
Would you be so kind as to perhaps point to an example or two? Please understand that I'm kinda like an ardent experimentalist. I've pretty much read all of the theoretical stuff and much of it is what? Interesting? Complex? Persiflage? Perhaps this might help you understand where I'm coming from:
https://www.youtube.com/watch?v=OL6-x0modwY
Regards,
Roy
Scientific method! Drink!
Best,
D
point to an example or two?
I can't find the very first paper from 1856, but I would refer you to this standard text that tens of thousands of students are taught with (Chs 2-4, esp 4.3+), and this latest paper that summarized the scholarship thusly:
HTH
Best.
D
Dano,
"Scientific method! Drink!"
I refer you to the video above of Richard Feynman explaining the scientific method. I have skimmed the referenced text and read it in sufficient detail to determine that it is not a scientific treatise but rather an extended riff on modelling. It significantly omits the third crucial step in the method, the comparison of the computed predictions with observed phenomena. It attempts to complete the circle by comparing its conclusions with other theoretical, ideal calculations but nowhere could I find a comparison to actual real world measurements.
It is a rather elaborate illustration of the reductionist methodology and its inherent flaw. It assumes that the whole is the sum of its parts. In the real world we find that this holds only in certain stable, homogeneous systems.
That it is reductionist is clearly stated by the author in the Preface: "The climate system is made up of building blocks which in themselves are based on elementary physical principles, but which have surprising and profound collective behavior when allowed to interact on the planetary scale."
The $64 question is, of course, what is this "surprising and profound collective behavior" of which he speaks. Perhaps you should ponder this question: "Which is more complex, more intractable to calculation: General Relativity, Quantum Mechanics or your kitchen sink?" Perhaps this excerpt from Wikipedia might provide some insight:
"According to an apocryphal story, Werner Heisenberg was asked what he would ask God, given the opportunity. His reply was: "When I meet God, I am going to ask him two questions: Why relativity? And why turbulence? I really believe he will have an answer for the first."[4] A similar witticism has been attributed to Horace Lamb (who had published a noted text book on Hydrodynamics)—his choice being quantum electrodynamics (instead of relativity) and turbulence. Lamb was quoted as saying in a speech to the British Association for the Advancement of Science, "I am an old man now, and when I die and go to heaven there are two matters on which I hope for enlightenment. One is quantum electrodynamics, and the other is the turbulent motion of fluids. And about the former I am rather optimistic."
Or Richard Feynman: "Turbulence is the most important unsolved problem of classical physics."
We understand ice (statics), water in a bucket (hydrostatics) and vapor (Boyle's laws) but when we stir the pot, when fluid is set in motion, we enter The Twilight Zone.
If I recall correctly there are currently some 47 different models of the climate extant, each of which yields different results, none of which are in agreement with satellite observations. Which, if any, is correct? Make a guess. This rather systematic disagreement among the models and, indeed, actual observations strongly suggests a flaw in the assumptions and methodology employed.
Regards,
Roy
Eric,
The measurements you cite are of the electromagnetic emanations of the sun, the spectrum from radio waves through x-rays. They completely ignore a very significant contribution to the energy transfer - the solar wind. The solar wind, first discovered in 1979 by the Soviet Luna probe, constitutes a multi-billion ampere DC current flowing past the earth. The earth has a spinning iron core. Spin iron in an electric field and you get a motor/generator. The aurora offer visual evidence of this energy transfer.
There is a negative correlation between the radiance of the sun and the temperature of the earth. The sun is brighter when there are fewer sunspots and dims when there's a bunch of them. And yet the earth cools during long periods of quiescence, when the sun is brighter, such as during the Dalton and Maunder minima. This seemingly paradoxical result is explained by the fact that the solar wind increases in intensity during periods of greater sunspot activity. There is a positive correlation between the number of sunspots and the intensity of the solar wind.
Regards,
Roy
Here is an analysis of solar radiance versus temperature in the late 19th and early 20th century. There is good correlation between irradiance and global average temperatures, until 1970 when AGW took over. You can't expect perfect correlation because other factors such as volcanoes and ENSO have strong short term influences on temperature.
http://hyperphysics.phy-astr.gsu.edu/hbase/thermo/solact.html
Sunspot activity correlates well with solar irradiance. The "Maunder Mininum" which you discuss in your post is actually a time of reduced sunspots and therefore reduced solar irradiance. The sun was not brighter then, as you claim.
http://science.nasa.gov/science-news/science-at-nasa/2013/08jan_sunclimate/
http://science.nasa.gov/media/medialibrary/2013/01/08/tsi_composite_strip.jpg/image_full
If I recall correctly there are some 47 different climate models cited in the last IPCC, each of which yields different results, none of which are in agreement with satellite observations.
You don't recall correctly. And you were duped, thanks!
Best,
D
Yup, you're right Dano. My bad. It was only 23.
https://ipcc.ch/pdf/assessment-report/ar4/wg1/ar4-wg1-chapter8.pdf
I got all confused by this other stuff.
 &imgrefurl=http%3A%2F%2Fthefederalist.com%2F2014%2F05%2F06%2Fclimate-change-is-real-too-bad-accurate-climate-models-arent%2F&docid=TjJNwRJbIaAxCM&tbnid=TV0DAeOLK9eHAM%3A&w=1920&h=1728&bih=764&biw=1536&ved=0ahUKEwjmt72YrYXNAhXBwiYKHSHmAYcQMwgeKAEwAQ&iact=mrc&uact=8
 &imgrefurl=https%3A%2F%2Fourchangingclimate.wordpress.com%2F2015%2F08%2F07%2Fwarm-2015-and-model-data-comparisons%2F&docid=JUtS912lxvDt6M&tbnid=ksPWVPss4QBfuM%3A&w=1440&h=1080&bih=764&biw=1536&ved=0ahUKEwjmt72YrYXNAhXBwiYKHSHmAYcQMwgjKAYwBg&iact=mrc&uact=8
 &imgrefurl=http%3A%2F%2Fwww.climatedialogue.org%2F&docid=BqCg5Cpw_w1yOM&tbnid=KCBLD3TTqde_KM%3A&w=607&h=342&bih=764&biw=1536&ved=0ahUKEwjmt72YrYXNAhXBwiYKHSHmAYcQMwgnKAowCg&iact=mrc&uact=8
Eric,
A couple of points.
I wrote "And yet the earth cools during long periods of quiescence, ". The reports cited by you cover a period of about 30 years, during which the difference in the number of sunspots between the active and quiet phases was unremarkable.
The longer term chart, 1860 to 1980, is not a measure of radiance but rather a graph showing the length of the sunspot cycles during that period.
In fact, it is impossible to calculate the total radiance including the solar wind as we were unaware of it before 1979.
You wrote:
"The "Maunder Mininum" which you discuss in your post is actually a time of reduced sunspots and therefore reduced solar irradiance. The sun was not brighter then, as you claim. You have things backwards."
Perhaps you could explain your reasoning here. Sunspots are about 1,500 degrees Kelvin cooler than the rest of the surface. The more sunspots the lower the average surface temperature. During a sunspot minimum the sun tends toward the maximum surface area at elevated temperatures. Thus the sun will appear brighter during a minimum. The apparent negative correlation between the temperature of the earth and brightness of the sun means we were missing something. The most obvious something is the solar wind, which we did not know about.
The dependence of the temperature of the earth on the radiation from the sun is masked, damped by the high specific heat capacity of the earth. It takes a long time for the earth to cool or warm. We will see very little difference over an 11 year cycle. It is only apparent when we have unusual conditions for many cycles, Maunder and Dalton being the prime examples.
"Whether solar wind has an important effect on climate is not clear to scientists. t is not as important as GHG's at present according to most climate scientists."
If you are at all familiar with the history of science then you know that more than 99% of "scientific" opinions have turned out to be wrong. For every Galileo who proved that all bodies fall at the same rate regardless of weight there were 10,000 who thought otherwise. For every Newton who showed that the force of gravity determined the orbits of the planets there were 10,000 who were convinced that the orbits were determined by the geometry of the spheres.
There is currently a great deal of consternation, if not outright panic, caused by the disclosure that more than 75% of peer reviewed medical studies can not be replicated.
I am particularly skeptical, to the point of suspecting outright fraud, of scientists who refuse to disclose their raw data or the methodology used to produce their final results. This includes EAU, NOAA and other handmaidens of Al Gore. Follow the money, not the piper.
Thanks for using the discredited Christy chart that was never published and widely panned as being misleading.
Also thanks for linking to the Chapter 8 to support your claim, although that is not the last IPCC. Do you want to link to the last IPCC to support your claim, and some newer graphics too (this is 2016)?
TIA,
Best,
D
Dano,
You are becoming quite tedious.
I spent a not negligible amount of time and effort examining the document you presented and formulating a fairly detailed response explaining why I did not consider it probative.
You have responded twice by picking the nits out of my brief concluding remark.
If you are unwilling, or unable, to continue this conversation by responding to the points I raised then I bid you adieu.
Roy
It is pretty clear from the chart I showed that higher sunspot numbers correlate with higher measured solar irradience. The centers of sunspots are dark because of a phenomenon similar to the lapse rate on earth. The energetic particles spewed from the earth, travelling along the magnetic field lines lose energy as they gain height. However, the edges of the sunspots are warmer than the rest of the sun.
The correlation between sunspot activity and solar irradiance is very clear. Sunspots are due to storms on the surface of the sun. High particle wind velocities are a result of high energy. There is no reason why the physics would be different during the Maunder Minimum than they are today. You are fooling yourself.
The rate of change of temperature of the earth's surface at any point is proportional to the imbalance between arriving and departing radiation multiplied by the effective heat capacity. The effective heat capacity of the ocean is complicated, but it is going to be positive so that there is an increase in average surface temperature with an increase in solar radiance. This was clearly observed in the first half of the 20th century. Solar wind is coincident with sunspots and higher solar irradiance. There is no reason to believe that the
forces behind the Maunder Mininum were any different than today. The number of cycles of reduced sunspots and reduced solar irradiance were simply longer than at any time since then.
"If you are at all familiar with the history of science then you know that more than 99% of "scientific" opinions have turned out to be wrong. For every Galileo who proved that all bodies fall at the same rate regardless of weight there were 10,000 who thought otherwise. For every Newton who showed that the force of gravity determined the orbits of the planets there were 10,000 who were convinced that the orbits were determined by the geometry of the spheres."
You are neglecting the history of science totally. How many people were there pursuing the scientific method in the time of Galileo and Newton? Were there even 10,000 scientists living in the world in those times? You are making up statistics here. Religious beliefs were more important in those days than science, and even Newton, the founder of modern physics and the calculus was taken up with studying literal interpretations of the Bible. Scientific skepticism is only a recent development, but it is very strong today. If my memory serves me correctly, 95% of National Academy of Science members, the elite scientists in the US, are atheists or agnostics. Your statistic is made up nonsense, and doesn't apply to modern science.
Climate can be studying by application of well established Physics and Chemistry to the Earth's atmosphere and oceans. It is foolish to think that some totally undiscovered phenomenon is going to come out of the woodwork and totally overturn everything. It makes sense for someone who is not a climate scientist to put more weight on the opinions of the 97% who believe the earth is being warmed by GHG's, than the tiny fraction of climate scientists who have other opinions.
Thanks for trying to deflect from that discredited Christy graph - It's great and all that you would want to hide from that embarrassment - but are you going to give us the last IPCC to examine to see if it supports your claim?
TIA
Best,
D
b/c you're mixing up natural cycles with manmade forcing that's adding to natural variation, e.g., this year's reconrd El Niño
Don't bother wasting your time with Dano2. I've encountered him in many different settings for years now and his modus operandi is always the same. Dismissal without cause and no ability to actually discuss the science along with often dismal attempts at witty repartee and a refusal to answer questions about his personal knowledge of any science. I usually refrain from personal comments, but I've finally made an exception in his case.
Thanks, Diane. I had him pegged from the start but I derive a kind of perverse pleasure from teasing the trolls. Other than that I'm a fairly nice guy.
Having another sads because you want your erroneous assertions to go unchallenged?
Best,
D
I had you pegged for a fibber, and for someone who couldn't weasel their way out of their fibbing.
I guess this means you aren't going to back your claim about the last IPCC. amirite?
Best,
D
Dano, I'm getting a little concerned here. Are you getting enough to eat? Sleeping well? Hovering over your keyboard, just itching to take another shot at that pretensious intulekshual sumbitch, can take a toll.
Re: glacial retreat... Hasn't the rate been higher recently?
Thanks, you can't hide your derps, perambulations and missteps on this thread.
Best,
D
...which suggests we have a predisposition toward freezing, rather than warming.
Those that do exist, clear themselves away rather quickly. Can you say "supernova"?
I bet you don't even see what you did there.
He's a troll, and a rank imbecile. Don't waste your time.
That's a troll's job, and he knows it well.
That is correct on a 100,000 year scale, before the last century, human industrial scale emissions did not exist.
http://sites.gsu.edu/geog1112/files/2013/03/Vostok_TemperatureCO21.png
Be honest. Don't kill the daughter of the guy who pays you.
You're presuming a single variable is the controlling one.
Not presuming anything. Just take a look at the parameters that could be involved. Axial/orbital parameters, which are long term factors are point ing towards long term cooling. Solar irradiance has been measured and seems to have caused the warming in the first half of the 20th century, but has been a neutral or cooling influence ever since 1950. There have been volcanic eruptions which cause cooling but no decrease in frequency or intensity that would contribute to warming. We are left with GHG's as an explanation for global warming since 1950.
If you have any significant factors that are involved, and could explain warming, please explain.
Sez little fibber who is having a sads at someone who points out little fibber's little fibs.
Best,
D
You happen to know them all -- the "parameters that could be involved" -- and know their magnitudes?
Wow! You'd better get in touch with the IPCC, quick! They've been trying to establish those factors for decades (and keep getting their guesses wrong, in the process).
You don't know what you are talking about. What have I missed? Put up or shut up.
The IPCC has made an attribution statement about the global average temperature increase since 1950. The best estimate is that 110% of the temperture increase since 1950 was a result of human emissions of GHG.
http://www.realclimate.org/images/ipcc_fig_10.5.jpg
Bye troll. You're terminated.