Being Skeptical of Data, Even When It Supports Your Position - Fire Edition
This is the, uh, whateverth installment in a series on using your common sense to fact check data, even when the data is tantalizingly useful for the point one is trying to make.
For the last decade or so, global warming activists have used major fires as further "proof" that there is a global warming trend. Often these analyses are flawed, for a variety of reasons that will be familiar to readers, e.g.
- A single bad fire is just one data point and does not prove a trend, you need a series of data to prove a trend
- There is no upward trend in US acreage in fires over the last 10 years, but there is in the last 20 years, which gives lots of nice opportunities for cherry-picking on both sides
- Acres burned is a TERRIBLE measure of global warming, because it is trying to draw global trends from a tiny fraction of the world land mass (western US); and because it is dependent on many non-climate variables such as forest management policies and firefighting policy.
- The better more direct metric of possible warming harm is drought, such as the Palmer drought severity index, which shows no trend (click to enlarge below)

- An even better metric, of course, is that there IS an actual upward trend in temperatures. There is not, however, much of an upward trend in bad weather like drought, hurricanes, or tornadoes. In this context fire is a third order variable (temp--->drought---> fire) which makes it a bad proxy, particularly when the first order variable is telling the tale.
AAAAaaaand then, there is this chart, much loved by skeptics, for long-term US fire history:
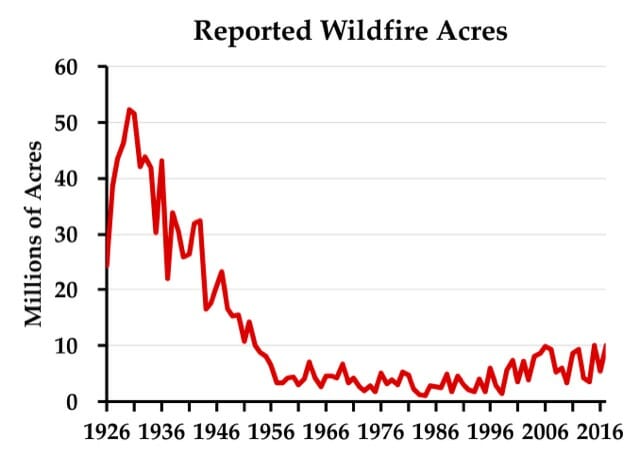
I am pretty sure that I have avoided ever using this piece of skeptic catnip (though I could be wrong, I can have moments of weakness). The reason is that nothing about this chart passes the smell test. While it is true that the 1930's were super hot and dry, likely hotter in the US than it has been this decade, there is absolutely no reason to believe the entire period of 1926-1952 were so much higher than today. Was there a different fire management policy (e.g. did they just let all fires burn themselves out)? Was there a change in how the data was recorded?
Here is my rule of thumb -- when you see a discontinuity like this (e.g. before and after 1955) you better have a good explanation and understanding of the discontinuity. This is not just to be a good person and be true to good scientific process (though we all should) but also from the practical and selfish desire to avoid having someone come along who DOES know why the discontinuity exists and embarrass you for your naivete.
I have never trusted this chart, because I have not really understood it. This week, the Antiplanner (who before he focused on transit focused most of his writing on the Forest Service and forest policy) has an explanation.
The story begins in 1908, when Congress passed the Forest Fires Emergency Funds Act, authorizing the Forest Service to use whatever funds were available from any part of its budget to put out wildfires, with the promise that Congress would reimburse those funds. As far as I know, this is the only time any democratically elected government has given a blank check to any government agency; even in wartime, the Defense Department has to live within a budget set by Congress.
This law was tested just two years later with the Big Burn of 1910, which killed 87 people as it burned 3 million acres in the northern Rocky Mountains. Congress reimbursed the funds the Forest Service spent trying (with little success) to put out the fires, but — more important — a whole generation of Forest Service leaders learned from this fire that all forest fires were bad....
This led to a conflict over the science of fire that is well documented in a 1962 book titled Fire and Water: Scientific Heresy in the Forest Service. Owners of southern pine forests believed that they needed to burn the underbrush in their forests every few years or the brush would build up, creating the fuels for uncontrollable wildfires. But the mulish Forest Service insisted that all fires were bad, so it refused to fund fire protection districts in any state that allowed prescribed burning.
The Forest Service’s stubborn attitude may have come about because most national forests were in the West, where fuel build-up was slower and in many forests didn’t lead to serious wildfire problems. But it was also a public relations problem: after convincing Congress that fire was so threatening that it deserved a blank check, the Forest Service didn’t want to dilute the message by setting fires itself.
When a state refused to ban prescribed fire, the Forest Service responded by counting all fires in that state, prescribed or wild, as wildfires. Many southern landowners believed they needed to burn their forests every four or five years, so perhaps 20 percent of forests would be burned each year, compared with less than 1 percent of forests burned through actual wildfires. Thus, counting the prescribed fires greatly inflated the total number of acres burned.
The Forest Service reluctantly and with little publicity began to reverse its anti-prescribed-fire policy in the late 1930s. After the war, the agency publicly agreed to provide fire funding to states that allowed prescribed burning. As southern states joined the cooperative program one by one, the Forest Service stopped counting prescribed burns in those states as wildfires. This explains the steady decline in acres burned from about 1946 to 1956.
There were some big fires in the West in the 1930s that were not prescribed fires. I’m pretty sure that if someone made a chart like the one shown above for just the eleven contiguous western states, it would still show a lot more acres burned in real wildfires in the 1930s than any decade since — though not by as big a margin as when southern prescribed fires are counted. The above chart should not be used to show that fires were worse in the 1930s than today, however, because it is based on a lie derived from the Forest Service’s long refusal to accept the science behind prescribed burning.
There you go, the discontinuity seems to be from a change in the way the measurement is calculated.
By the way, I work closely with the Forest Service every day and mostly this partnership is rewarding. But I can tell you that the blank check still exists for fire suppression costs and results in exactly the sort of inefficient spending that you would imagine. Every summer, much Forest Service work comes to a halt as nearly every manager and professional gets temporarily assigned to fire -- something FS employees love because they get out of the grind of their day job and essentially get to go camping.