Does this Make Sense?
I am just finishing up my paper "A Skeptical Layman's Guide to Anthropogenic Global Warming," and one thing I encounter a lot with sources and websites that are strong supporters of Anthropogenic Global Warming (AGW) theory is that they will often say such-and-such argument by skeptics was just disproved by so-and-so.
For example, skeptics often argue that historical temperature records do not correct enough for the effects of urbanization on long-term measurement points. The IPCC, in fact, has taken the position that what is called the urban heat island effect is trivial, and does not account for much or any of measured warming over the last 100 years. To this end, one of the pro-AGW sites (either RealClimate.org or the New Scientist, I can't remember which) said that "Parker in 2006 has disproved the urban heat island effect."
Now, if you were going to set out to do such a thing, how would you do it? The logical way, to me, would be to draw a line from the center of the city to the rural areas surrounding it, and take a bunch of identical thermometers and have people record temperatures every couple of miles along this line. Then you could draw a graph of temperature vs. nearness to the city center, and see what you would find.
Is that what Parker did? Uh, no. I turn it over to Steve McIntyre, one of the two men who helped highlight all the problems with the Mann hockey stick several years ago.
If you are not a climate scientist (or a realclimate reader), you
would almost certainly believe, from your own experience, that cities
are warmer than the surrounding countryside - the "urban heat island".
From that, it's easy to conclude that as cities become bigger and as
towns become cities and villages become towns, that there is a
widespread impact on urban records from changes in landscape, which
have to be considered before you can back out what portion is due to
increased GHG.One of the main IPCC creeds is that the urban heat island effect has
a negligible impact on large-scale averages such as CRU or GISS. The
obvious way of proving this would seem to be taking measurements on an
urban transect and showing that there is no urban heat island. Of
course, Jones and his associates can't do that because such transects
always show a substantial urban heat island. So they have to resort to
indirect methods to provide evidence of "things unseen", such as Jones
et al 1990, which we've discussed in the past.The newest entry in the theological literature is Parker (2004, 2006),
who, once again, does not show the absence of an urban heat island by
direct measurements, but purports to show the absence of an effect on
large-scale averages by showing that the temperature trends on calm
days is comparable to that on windy days. My first reaction to this,
and I'm sure that others had the same reaction was: well, so what? Why
would anyone interpret that as evidence one way or the other on UHI?
He goes on to take the study apart in detail, but I think most of you can see that the methodology makes absolutely zero sense unless one is desperately trying to toe the party line and win points with AGW supporters by finding some fig leaf to cover up this urban heat island problem. By the way, plenty of people have performed the analysis the logical way we discussed first, and have shown huge heat island effects:
The bottom axis by the way is a "sky-view" metric I had not seen before, but is a measurement of urban topology. Effectively the more urbanized and the more tall buildings around you that create a canyon effect, the lower the sky view fraction. Note that no one gets a number for the Urban Heat Island effect less than 1 degree C, and many hover around 6 degrees (delta temperature from urban location to surrounding rural countryside). Just a bit higher than the 0.2C assumed by the IPCC. Why would they assume such a low number in the face of strong evidence? Because assuming a higher number would reduce historical warming numbers, silly.
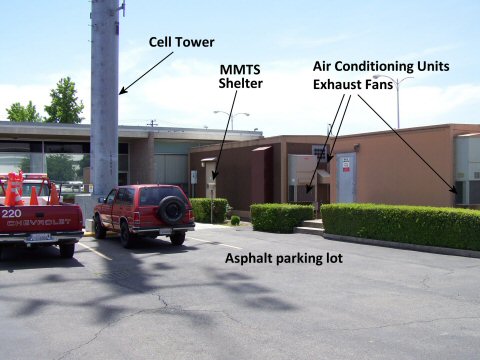
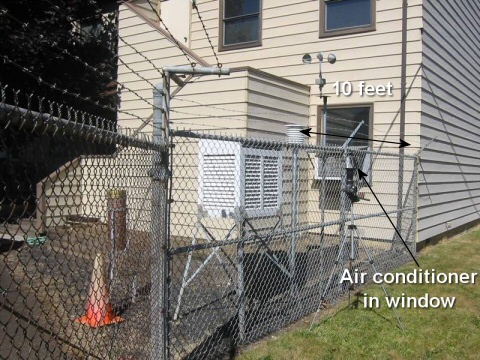
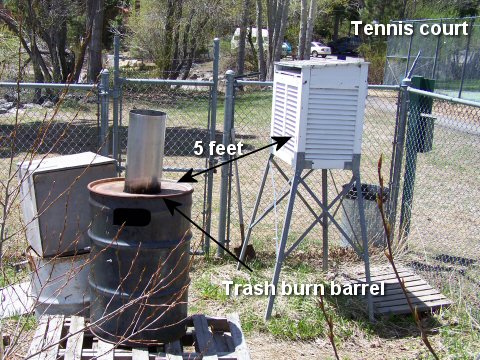
Oh, and the IPCC argues that the measurement points it uses around the world are all rural locations so urban heat island corrections are irrelevant. Below are some sample photos of USHCN sites, which are these supposedly rural sites that are used in the official historical warming numbers. By the way, these US sites are probably better than what you would find anywhere else in the world. (All pictures from surfacesations.org) As always, you can click for a larger view.
You can help with the effort of documenting all the US Historical Climate Network (USHCN) stations. See my post here -- I have already done two and its fun!


