Posts tagged ‘Robert Samuelson’

Cognitive Dissonance

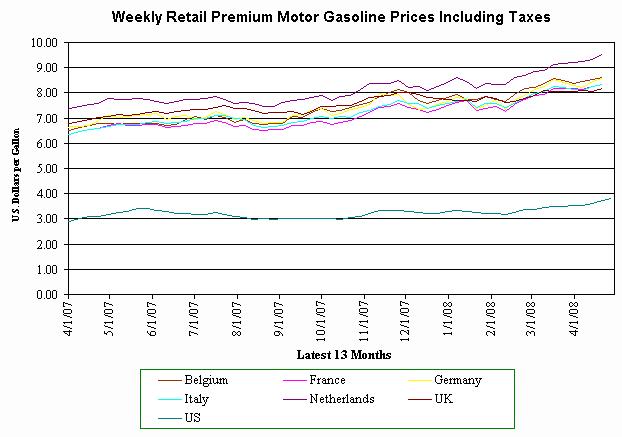
As a follow-up to this post on gas-price demagoguery, I would like to observe that the very same people who are most likely to demagogue about high gas prices in this country are the very same ones who advocate that the US adopt European-style taxation levels, regulatory policy, and CO2 targets, the results of which can be seen here:

Gas1

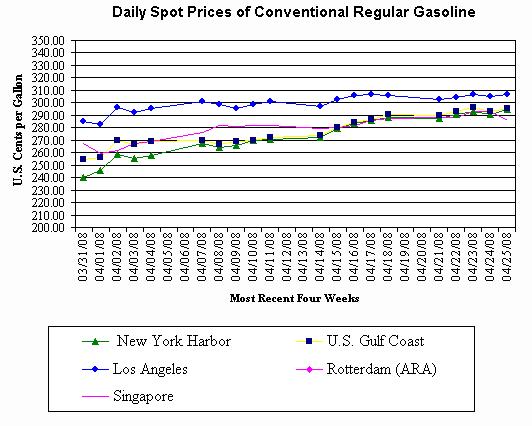
If you can't read the colors on the scale well, I think you can guess which is the US price line and which are the European gas prices.  Source here.  Just to be clear, this has nothing to do with wholesale gasoline prices, which are substantially similar between the US and Europe:

Gas2

Since the difference in price does not go to the producer, I will leave it as an exercise to guess where the extra $5 per gallon is going (hint:  Uncle Francois)  The cognitive dissonance required to call for 80% CO2 reductions while simultaneously decrying $3.50 gas prices is just stunning to me.

Update:  From the same source, here are the gas prices in dollars per US gallon EXCLUDING taxes:


Date Belgium France Germany Italy Nthrlnds UK US
4/14/2008 3.32 3.28 3.18 3.61 3.85 3.09 3.21

Update #2:  More here on Hillary's sleight of hand.  And this from Robert Samuelson, at how this cognitive dissonance extends to exploration limits:

We could be producing more, but Congress has put large areas of
potential supply off-limits. These include the Atlantic and Pacific
coasts and parts of Alaska and the Gulf of Mexico.
By government estimates, these areas may contain 25 billion to 30
billion barrels of oil (against about 30 billion barrels of proven U.S.
reserves today) and 80 trillion cubic feet or more of natural gas
(compared with about 200 tcf of proven reserves).

What keeps these areas closed are exaggerated environmental fears,
strong prejudice against oil companies and sheer stupidity. Americans
favor both "energy independence" and cheap fuel. They deplore imports
-- who wants to pay foreigners? -- but oppose more production in the
United States. Got it? The result is a "no-pain energy agenda that
sounds appealing but has no basis in reality," writes Robert Bryce in
"Gusher of Lies: The Dangerous Delusions of 'Energy Independence.' "
Immigrants and Poverty

Robert Samuelson makes the point I made here:

The standard story is that poverty is stuck; superficially, the

statistics support that. The poverty rate measures the share of

Americans below the official poverty line, which in 2006 was $20,614

for a four-person household. Last year, the poverty rate was 12.3

percent, down slightly from 12.6 percent in 2005 but higher than the

recent low, 11.3 percent in 2000. It was also higher than the 11.8

percent average for the 1970s. So the conventional wisdom seems amply

corroborated.

It isn't. Look again at the numbers. In 2006, there were 36.5

million people in poverty. That's the figure that translates into the

12.3 percent poverty rate. In 1990, the population was smaller, and

there were 33.6 million people in poverty, a rate of 13.5 percent. The

increase from 1990 to 2006 was 2.9 million people (36.5 million minus

33.6 million). Hispanics accounted for all of the gain.

Consider:

From 1990 to 2006, the number of poor Hispanics increased 3.2 million,

from 6 million to 9.2 million. Meanwhile, the number of non-Hispanic

whites in poverty fell from 16.6 million (poverty rate: 8.8 percent) in

1990 to 16 million (8.2 percent) in 2006. Among blacks, there was a

decline from 9.8 million in 1990 (poverty rate: 31.9 percent) to 9

million (24.3 percent) in 2006. White and black poverty has risen

somewhat since 2000 but is down over longer periods

This is not a ding on immigration, as readers will know I am a supporter of open immigration.  But it is an important context to have when evaluating poverty numbers.  The drop in black poverty in these numbers is an ENORMOUS piece of good news that I bet you have not read anywhere.