So If It's All About the TED Spread, Should We Be Worried?
Us non-financial types are always learning something new. After a lifetime of thinking that our economy rests on free markets, entrepreneurship, an educated and flexible labor force, risk-taking, etc., we suddenly find that everything depends on the TED Spread, a metric most of which most of us were blissfully ignorant 2 months ago.
The TED spread is basically the difference or spread between short term inter-bank loan rates and short term treasuries or T-bills. It is in some sense a measure of perceived risk of lending to banks vs. (what are considered) low or near-zero risk US treasury obligations. One way to think about it in the current market is how much extra would you need in interest to lend to your slacker brother-in-law Earl vs. say to Bill Gates.
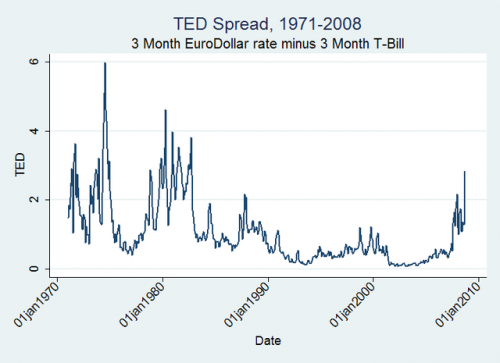
Not surprisingly, the TED spread has shot up over the last few weeks, and it tends to be the #1 metric cited in declaring impending doom for the US economy. But Alex Tabarrok looked at a longer view of the TED spread, and found this:

Now, the period from 1970-1983 were not by any means an economic glory period, but on the other hand its clear that TED spreads of the order of magnitude we have seen in the past weeks are not unprecedented by any means.
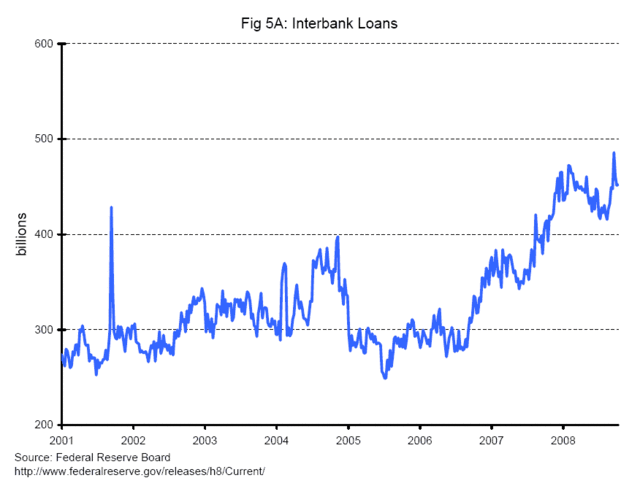
The problem I have with the TED spread is that higher recent spreads are being used as an indicator that credit has "dried up" and lending is at a standstill. Why do I resist this conclusion? Because of this chart:

So, gasoline prices rocketed from $1.50 a gallon to over $4.00 a gallon. Does this mean that gasoline purchases have stopped? Has the gasoline market closed up shop? Of course not. It just means the price went up. It is absurd to show me a price chart, which is what the TED spread graph is, and infer from it changes in the underlying transaction volume.
In fact, when one looks at actual volume, of inter-bank loans or new commercial lending, there is not (at least yet) any of the drop-off everyone seems to assume exists. For example:

your ted spread chart is inaccurate. it was at nearly 5% in recent weeks.
http://www.bloomberg.com/apps/quote?ticker=.TEDSP%3AIND
oh, and the ted spread tend to widen when inflation is high. (as the rates themselves are much higher) 200bp is a much smaller % difference when t-bills are 9% and libor is 11%. for interest rates this low, 5% is a VERY alarming TED spread and indicative of market failure. a ted spread of 6-8 time the risk free rate may well be unprecedented. (though i have not exhaustively checked, but it is certainly unique in the last 25 years)
Seems to me that some people are using conventional metrics at a time when everybody and his dog is jerking the markets around with huge flows of money hither and yon. Thus we see hard assets descending in unison with stocks and other such weird stuff. Goodbye conventional wisdom.
Lately, I've concluded that least affected by all this crap is the relationship between the US dollar and US domestic goods and services, in the short term any way. So, since here is where I live, I really don't care (financially) what LIBOR is up to, or the yen, or what OPEC or Russia or China does.
I'll be selling gold, if should happen to jerk up high enough for long enough. I'll be holding my alternative energy until the election - Obama in = hold. McCain in = sell. Bloody thing's down 50% anyway. Full moon tonight. Maybe tomorrow will bring a rally :-)
T.C.
There are also differences in taxes on Treasury debt and corporate debt. Thus if you think that the tax rates are going to increase the TED spread should widen.