Explaining Temperature History
I post most of my more detailed climate work over at my other blog. But I wanted to repost here something I wrote in response to a number of request for a brief version of what is driving global temperatures.
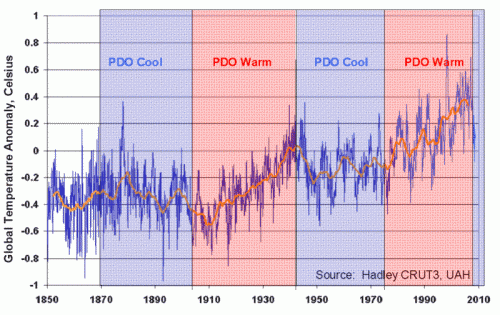
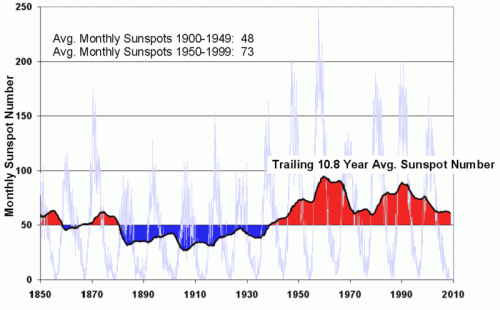
My sense is that medium to long scale 20th century temperature trends can be explained mostly through three drivers:
1. A cyclical variation driven by multi-decade oceanic cycles like the Pacific Decadal Oscillation (PDO):
2. Changes in solar output, either directly as increased heating or indirectly via a variety of theories on things like cosmic rays and cloud formation:
3. A long term trend of up to +0.05C per decade that may include a CO2-warming component.
I am willing to posit a CO2 impact net of feedbacks of perhaps 0.5-1.0C over the next century. This may appear low, but is the only scale of number reasonably supported by history. Any higher number would result in temperatures way too high historically. And even assuming a number this high runs into the following problem: There was probably a trend of about this magnitude emerging from the little ice age 200+ years ago and extending into the 20th century. You can see it in the glacier numbers below: (source)
Those that want to assign the temperature trend, once the sun and the PDO are removed, post-1950 to CO2, need to explain what effect was causing the nearly exact same trend from 1800-1950, and why that trend conveniently switched off at the exact moment man's CO2 takes over. In the context of the glacier chart, what was causing the glaciers to retreat in 1880, and why is that effect not the one at work today?
With evidence that the PDO has reversed to its cool phase and that the sun may be shifting into low gear, I think it is reasonable to posit warming no more than 0.5-1.0C over the next century. For those who have not seen it, Roy Spencer has a new paper on the PDO, clouds and temperature history. My video on why climate models overstate future warming through absurd assumptions of high positive feedbacks is here.


ltvsys521k:
it was a cold day for i have no warm clothes to wear here , the other reason was that it gradually become colder and colder .if i was in my hometown ,i think i already put on my thickest clothwow goldes at this time .but i am in gz where is a warm place .
November 12, 2008, 6:09 amJohn David Galt:
I agree with your general ideas, but I suggest rethinking this paragraph:
Those that want to assign the temperature trend, once the sun and the PDO are removed, post-1950 to CO2, need to explain what effect was causing the nearly exact same trend from 1800-1950, and why that trend conveniently switched off at the exact moment man's CO2 takes over. In the context of the glacier chart, what was causing the glaciers to retreat in 1880, and why is that effect not the one at work today?
It was in the 17th century that coal smoke got so bad in Britain that the word "smog" was coined. The level of air pollution then, at least in some rich places, was worse than anything in the world today, even Mexico City or Beijing. So it's not at all clear to me that "man's CO2 takes over" only in 1950 or later. Maybe it's effectively true, but I'm not convinced until I see the numbers. (Were the "great smogs of London" even measured?)
November 27, 2008, 12:10 pm